
SKraken: Fast and Sensitive Classification of Short Metagenomic Reads
based on Filtering Uninformative k-mers
Davide Marchiori and Matteo Comin
∗
Department of Information Engineering, University of Padova, Padova, Italy
Keywords:
Metagenomic Reads Classification, Representative k-mers.
Abstract:
The study of microbial communities is an emerging field that is revolutionizing many disciplines from ecology
to medicine. The major problem when analyzing a metagenomic sample is to taxonomic annotate its reads in
order to identify the species in the sample and their relative abundance. Many tools have been developed in
the recent years, however the performance in terms of precision and speed are not always adequate for these
very large datasets. In this work we present SKraken an efficient approach to accurately classify metagenomic
reads against a set of reference genomes, e.g. the NCBI/RefSeq database. SKraken is based on k-mers
statistics combined with the taxonomic tree. Given a set of target genomes SKraken is able to detect the most
representative k-mers for each species, filtering out uninformative k-mers. The classification performance
on several synthetic and real metagenomics datasets shows that SKraken achieves in most cases the best
performances in terms of precision and recall w.r.t. Kraken. In particular, at species level classification, the
estimation of the abundance ratios improves by 6% and the precision by 8%. This behavior is confirmed also
on a real stool metagenomic sample where SKraken is able to detect species with high precision. Because of
the efficient filtering of uninformative k-mers, SKraken requires less RAM and it is faster than Kraken, one of
the fastest tool.
Availability: https://bitbucket.org/marchiori dev/skraken
1 INTRODUCTION
Metagenomics is the study of genomic sequences in a
heterogeneous microbial sample (e.g. soil, water, hu-
man microbiome) (Mande et al., 2012; Felczykowska
et al., 2012). One of the primary goals of metage-
nomic studies is to determine the taxonomical identity
of the microorganisms that are present in a sample.
Several research areas, investigating various mi-
crobiomes, have been revolutionized by this emerging
field like ecology, medicine, microbiology, and other
(Consortium, 2012; Qin et al., 2010; Zeller et al.,
2014; Said et al., 2014). For the first time researchers
are now able to study the genomic material in envi-
ronmental samples without the need to separate and
culture bacteria or of biased preprocessing steps. This
analysis can reveal the presence of unexpected bac-
teria and viruses in a microbial sample, and it also
allows the identification and characterization of bac-
terial and viral genomes at a level of detail not pre-
viously possible. For example, in the case of the hu-
∗
Corresponding Author
man body, imbalances in the microbiome are related
with many diseases, e.g. inflammatory bowel disease
(IBD) (Qin et al., 2010) and colorectal cancer (Zeller
et al., 2014).
The taxonomic classification of metagenomics
reads is in general performed with two techniques:
(1) sequencing phylogenetic marker genes, e.g. 16S
rRNA; (2) NGS sequencing of all the genomic mate-
rial in the sample. The use of marker genes requires
amplification steps that can introduce bias in the tax-
onomic analysis. Moreover, not all bacteria can be
identified by traditional 16S sequencing, because of
its divergent gene sequences (Brown et al., 2015).
The most effective and unbiased method to study
microbial samples is via high-throughput sequencing.
However, the short length of NGS reads poses a num-
ber challenges for the correct taxonomical classifica-
tion of each read. Several methods and software tools
are available, but with the increasing throughput of
modern sequencing technologies faster and more ac-
curate algorithms are needed. These methods can be
broadly divided into three categories: (1) sequence
Marchiori D. and Comin M.
SKraken: Fast and Sensitive Classification of Short Metagenomic Reads based on Filtering Uninformative k-mers.
DOI: 10.5220/0006150500590067
In Proceedings of the 10th International Joint Conference on Biomedical Engineering Systems and Technologies (BIOSTEC 2017), pages 59-67
ISBN: 978-989-758-214-1
Copyright
c
2017 by SCITEPRESS – Science and Technology Publications, Lda. All rights reserved
59

similarity based methods, (2) marker-based methods
where certain specific marker sequences are used to
identify the species. (3) sequence composition meth-
ods, which are based on the nucleotide composition
(e.g. k-mers usage).
The sequence similarity based methods search
reads in reference databases through sequence simi-
larity, popular example are MegaBlast (Zhang et al.,
2004) and Megan (Huson et al., 2007). They are very
precise at identifying reads from genomes within the
reference database, but they are generally very slow,
especially compared with composition based meth-
ods. Marker-based methods try to mimic the taxo-
nomic classification of marker genes (Liu et al., 2011;
Caporaso et al., 2010; Segata et al., 2012). For ex-
ample, MetaPhlAn (Segata et al., 2012) is based on
marker genes that are clade specific.
The fastest and most promising approaches are
based on sequence composition. In these methods,
first the genomes of reference organisms are mod-
eled based on k-mers counts, then reads are searched
into this reduced database and classified based on the
origin of the hit sequences. On this category the
most representative methods are Kraken (Wood and
Salzberg, 2014), Clark (Ounit et al., 2015) and Lmat
(Ames et al., 2013). The performance of these meth-
ods in terms of precision are as good as MegaBlast
(Zhang et al., 2004), but they are much faster. Thus,
only these methods are really capable to keep pace
with the increasing throughput of modern sequencing
instruments.
A recent comparison of different metagenomic
classification methods has shown that Kraken (Wood
and Salzberg, 2014) is one of the most promising tool
in terms of both similarity to the correct answer and
classification speed (Lindgreen et al., 2016). The key
idea behind the success of Kraken is the construction
of a database of all reference genomes based on the
k-mers of each genome combined with a taxonomic
tree. More precisely, Kraken constructs a data struc-
ture that is an augmented taxonomic tree in which a
list of significant k-mers is associated to each node,
leafs as well as internal nodes. Given a node on this
taxonomic tree, its list of k-mers is considered repre-
sentative for the taxonomic label of the node and used
for the classification of metagenomic reads.
Inspired by this paradigm, in this paper we pro-
pose SKraken a tool for metagenomics reads classifi-
cation that selects the most representative k-mers for
each node in the taxonomic tree, filtering out unin-
formative k-mers. The main properties of SKraken
can be summarized as follows: i) an efficient detec-
tion of representative k-mers over the taxonomic tree;
ii) SKraken improve the precision of Kraken on sim-
ulated and real metagenomic datasets without com-
promising the recall. iii) The database of reference
genomes constructed by SKraken is 8% smaller than
the one computed by Kraken. As a consequence,
SKraken requires less memory RAM and the clas-
sification speed increases w.r.t. Kraken, one of the
fastest tool. In the next section we give an overview
of Kraken and analyze how to improve the classifica-
tion. SKraken is presented in section 2.1. Both tools
are tested on simulated and real metagenomic datasets
in section 3 and the conclusions are drawn in section
4.
2 METHODS
In order to better understand our contribution here
we briefly describe Kraken. One the major novel-
ties of Kraken is the ability to efficiently index a large
database of target genomes, e.g. all the genomes in
RefSeq. Instead to use the complete genome as ref-
erence Kraken, as well as many other tools (Ounit
et al., 2015; Ames et al., 2013), considers only its k-
mers, thus a genome is represented by its constituent
k-mers.
This relatively simple idea has profound implica-
tions, and it is at the base of alignment-free meth-
ods (Vinga and Almeida, 2003). Researchers have
shown that the use of k-mers frequencies for compar-
ing sequences has proved useful in different applica-
tions. The construction of phylogenetic trees, tradi-
tionally based on a multiple-sequence alignment, can
be carried out on whole genomes (Sims et al., 2009;
Comin and Verzotto, 2012). Several k-mers based
methods have been devised for the detection of en-
hancers in ChIP-Seq data (Goke et al., 2012; Kan-
torovitz et al., 2007; Comin and Verzotto, 2014; An-
tonello and Comin, 2015) and also of entropic profiles
(Antonello and Comin, 2013; Antonello and Comin,
2014). The assembly-free comparison of genomes
and metagenomes based on NGS reads and k-mers
counts has been investigated only recently (Comin
and Schimd, 2014; Comin et al., 2015; Schimd and
Comin, 2016; Ondov et al., 2016). For a compre-
hensive review of alignment-free measures and appli-
cations we refer the reader to (Vinga and Almeida,
2003).
The basic idea of Kraken is to consider the taxo-
nomic tree, taken from the complete NCBI taxonomic
information, and extend this data structure by anno-
tating each node, leafs as well as internal nodes, with
k-mers. At every node is associated a list of k-mers
that are considered important for that node and that
will be used for classification. Given a dataset of tar-
get genomes, the construction of this annotated tax-
BIOINFORMATICS 2017 - 8th International Conference on Bioinformatics Models, Methods and Algorithms
60
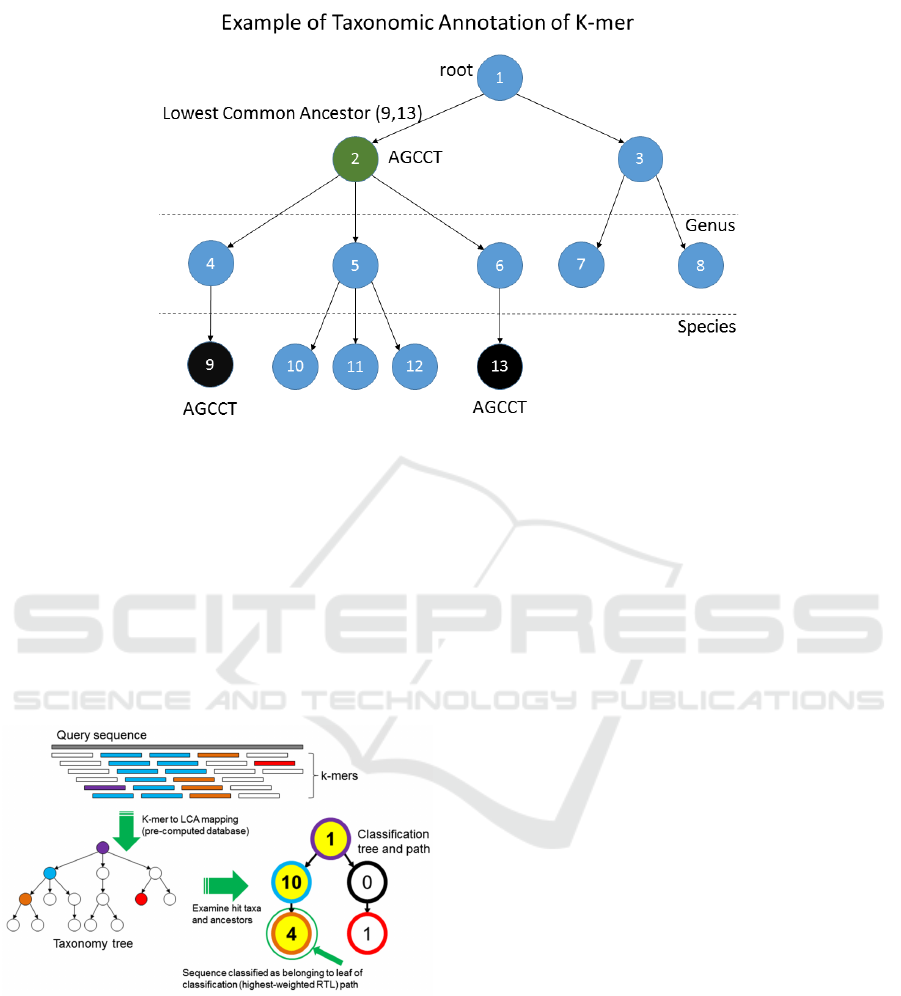
Figure 1: In this example the k-mer AGCCT , that is contained in the species 9 and 13, is moved to the lowest common
ancestor, the family node 2.
onomic tree is carried out by scanning the k-mers of
each genome in the dataset. If the k-mer appears only
in a given genome, than it is associated to the leaf
representing the species of that genome and the list of
k-mers of the node is updated. If the k-mer appears
in more than one species then its moved to the lowest
common ancestor of these nodes, see Figure 1 for an
example. At the end of this step each k-mer is associ-
ated with only one node in the taxonomic tree.
Figure 2: An overview of the metagenomic reads classifica-
tion of Kraken (Wood and Salzberg, 2014).
Once this database of annotated k-mers has been
constructed, Kraken can classify reads in a very ef-
ficient manner. Figure 2 reports an overview of the
classification process. Given a read Kraken decom-
poses the read into a list of its k-mers. Then each k-
mer is searched in the augmented taxonomic tree, and
in the corresponding node a counter is incremented
for every hit. Once all k-mers have been analyzed
the node’s counters and the taxonomic tree are used
to classify the read by searching the highest weighted
path, from the root to a leaf, in the tree.
2.1 SKraken: Selecting Informative
k-mers
The most important step of Kraken is the construc-
tion of the augmented taxonomic tree. In this data
structure k-mers are associated with nodes and then
used for the taxonomic classification of reads. In
this paper we propose SKraken that follows a sim-
ilar paradigm for the classification step. The major
differences are in the construction of the augmented
taxonomic tree, where uninformative k-mers are care-
fully selected and filtered.
One of the problem with the augmented taxo-
nomic tree of Kraken is that it is enough that two
species share a k-mer to insert this k-mer is the list
of important features of an internal node. If we con-
sider the example in Figure 1, we can note that the
k-mer AGCCT is moved from the leaf nodes 9 and
13, representing two species, to the node 2 represent-
ing a taxonomic family. Since this k-mer will be used
in the classification step, we would like to be infor-
mative for the family node 2. However, the majority
of species in this family, nodes 10, 11 and 12, do not
contain this k-mer.
To address this issue, for each k-mer, we define
a scoring function that captures its representativeness
with respect to a taxonomic node. We recall that a
k-mer is associated with only one node in the tree.
SKraken: Fast and Sensitive Classification of Short Metagenomic Reads based on Filtering Uninformative k-mers
61
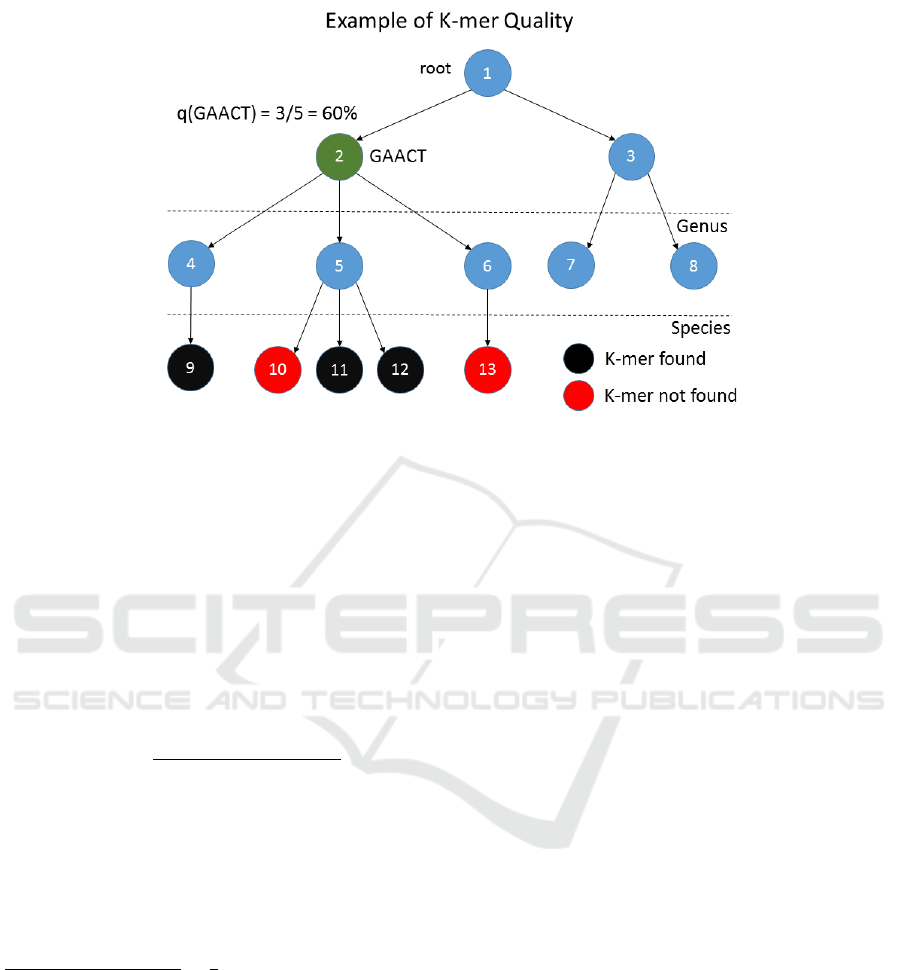
Figure 3: An example of quality score q(GAACT ).
Let’s define TaxID(m) as the taxonomic node associ-
ated with the k-mer m. However, the k-mer m can
occur in many difference species, leaf nodes. We
define NumSpecies(m) as the the number of species
that contains m. By construction TaxID(m) is the
lowest common ancestor of all these species. Thus
the species in which m appears, they are all leafs
node of the subtree rooted in TaxID(m). We define
TotSpecies(n) as the total number of species in the
subtree routed in the node n. With these values we
define q(m) the quality of a k-mer m as :
q(m) =
NumSpecies(m)
TotSpecies(TaxID(m))
Figure 3 shows an example of the quality
q(GAACT ). The quality of GAACT can also be in-
terpreted as the percentage of species nodes that con-
tains GAACT , i.e. NumSpecies(GAACT ), with re-
spect to the family node 2, i.e. TaxID(GAACT ),
in this case 60%. Similarly, if we consider the
example in Figure 1, the quality of q(AGCCT ) =
NumSpecies(AGCCT )
TotSpecies(TaxID(AGCCT ))
=
2
5
= 0.4, that is 40%. Thus,
if a k-mer has an high quality can be considered repre-
sentative for a given taxonomic node, and the related
subtree, and more likely will be informative for the
classification. Based on these observations SKraken
selects uninformative k-mers, by means of their qual-
ity, and it prunes the augmented taxonomic tree by
removing the k-mers with a quality below a given
threshold Q.
In order to compute the quality scores q(m) for
all k-mers we need to be able to evaluate efficiently
NumSpecies(m) and TotSpecies(n). The construc-
tion of the augmented taxonomic tree of SKraken is
divided into two steps. In the first step, given a set of
target genomes, we scan the k-mers of each genome
and build the augmented taxonomic tree, similarly to
Kraken. In addition, in this phase, for each k-mer
m we keep a variable to compute NumSpecies(m).
Every time m is found in a new species we incre-
ment this variable. However, there can be genomes
that are further classified as sub-species of a given
species node. In order to compute the correct value
of NumSpecies(m), we need to make sure that all
genomes of a given species are processed before mov-
ing to next species. This can be obtained by scan-
ning the input genomes in a particular order so that
all genomes of a species, and eventually sub-species,
are processed at once. Another problem is the fact
a k-mer can appears in many sub-species of a given
species node. When computing NumSpecies(m) we
need to make sure not to overcount these occurrences,
and thus the corresponding variable is incremented
only when m is found for the first time in a given
species. All other occurrences of m within the same
species will be discarded. At the end of the first
phase we have computed the augmented taxonomic
tree, with all k-mers, and the corresponding values
NumSpecies(m).
In the second phase SKraken computes the
quality values q(m) and filters uninformative k-
mers. The number of leaf nodes descendants of n,
TotSpecies(n), can be obtained for all nodes in the
tree with a post-order traversal of the taxonomic tree.
Then all k-mers are processed and the corresponding
qualities q(m) are computed. If q(m) is below a given
input parameter Q, m is removed from the database.
Note that the size of the taxonomic tree is con-
BIOINFORMATICS 2017 - 8th International Conference on Bioinformatics Models, Methods and Algorithms
62

Table 1: A summary of simulated and real metagenomics datasets.
Type Dataset Reads Species Reads Length
Single-end HiSeq 10000 10 92
Single-end MiSeq 10000 10 100
Single-end simBA5 10000 1216 100
Paired-end Mix1 1000000 10 100
Paired-end Mix2 1000000 10 100
Paired-end SRR1804065 1053741 775 100
stant and much smaller with respect to the number of
k-mers. The overall process depends only on the total
number of k-mers and it is linear in size of the input
reference genomes. Once the augmented taxonomic
tree is build reads can be classified with the same pro-
cedure of Kraken.
3 RESULTS
The comparison of different metagenomic classifica-
tion methods is a non-trivial task (Lindgreen et al.,
2016). Since our algorithm is inspired by Kraken,
one of the best performing methods (Lindgreen et al.,
2016), we compare SKraken with it as reference tool.
These tools require to build a reference database, we
use as input for both all bacterial and archaeal com-
plete genomes in NCBI RefSeq. In order to test
the performance of SKraken we used several metage-
nomic datasets representing simulated and real com-
munities. The simulated and real datasets are ob-
tained from the original paper of Kraken (Wood and
Salzberg, 2014) as well as from other related studies
(Girotto et al., 2016; Ounit et al., 2015)). The simu-
lated datasets represent five mock communities that
are constructed from real sequencing data: MiSeq,
HiSeq, Mix1, Mix2, simBA5. The MiSeq and HiSeq
metagenomes were built using 10 sets of bacterial
whole-genome shotgun reads. Mix1 and Mix2 are
based on the same species of HiSeq, but with two dif-
ferent abundance profiles.
The MiSeq dataset is particularly difficult to ana-
lyze because it contains five genomes from the En-
terobacteriaceae family (Citrobacter, Enterobacter,
Klebsiella, Proteus and Salmonella). The high se-
quence similarity of this family can make the clas-
sification of the MiSeq dataset more difficult. The
metagenome simBA5 was created by simulating reads
from the complete set of bacterial and archaeal
genomes in RefSeq, for a total of 1216 species. It
contains reads with an high error rate and it was cre-
ated with the purpose to evaluate the performance on
datasets with many errors and many species.
We also evaluated the performance of SKraken on
a real stool metagenomic sample (SRR1804065) from
the Human Microbiome Project. Because there is no
ground truth for this dataset, we use BLAST to find
the reads that uniquely map, with a sequence identity
of 95%, to a genome and filter out all other reads. If
two paired-end reads do not map on the same genome
we discard them. As a result the real metagenomic
sample contains 775 distinct species and 1053741
reads. A summary of the main characteristics of
all simulated and real metagenomics datasets can be
found in Table 1.
In order to compare the results we used the stan-
dard metrics of precision and recall. Given N the
number of reads, Y the number of reads classified and
X the number of reads correctly classified, we define
precision as the fraction of correct assignments over
the total number of assignments (X /Y ), and recall as
the ratio between the number of correct assignments
and the number of reads to be classified (X/N). If
one is interested in the number of reads that remains
unclassified, it can be indirectly estimated from the
recall. In fact the percentage of reads unclassified
is bounded above by 1 − recall. When analyzing a
metagenomic sample one need to verify that the abun-
dance ratios of species estimated by the tools is sim-
ilar to the known profile. To test also this important
aspect we compute the Pearson correlation between
the estimated abundance profile and the known ratios.
A Pearson correlation of 0 means that the distribu-
tion of abundance ratios are very different, whereas a
correlation of 1 that they match perfectly the correct
abundance profile.
For Kraken we use the default parameter k =
31 because, as suggest by the authors (Wood and
Salzberg, 2014), it is the best balance between pre-
cision and recall. For SKraken we use the same value
of k = 31 and we test the performance varying the fil-
tering parameter Q.
To assess the performance of SKraken we devised
a series of tests varying the parameter Q and the tax-
onomic level at which the classification is evaluated.
In the first set of experiments we want to test how
the filtering parameter Q impact the performance met-
rics. We run Kraken and SKraken on the dataset Mix1
and evaluate the classification accuracy at the species-
SKraken: Fast and Sensitive Classification of Short Metagenomic Reads based on Filtering Uninformative k-mers
63
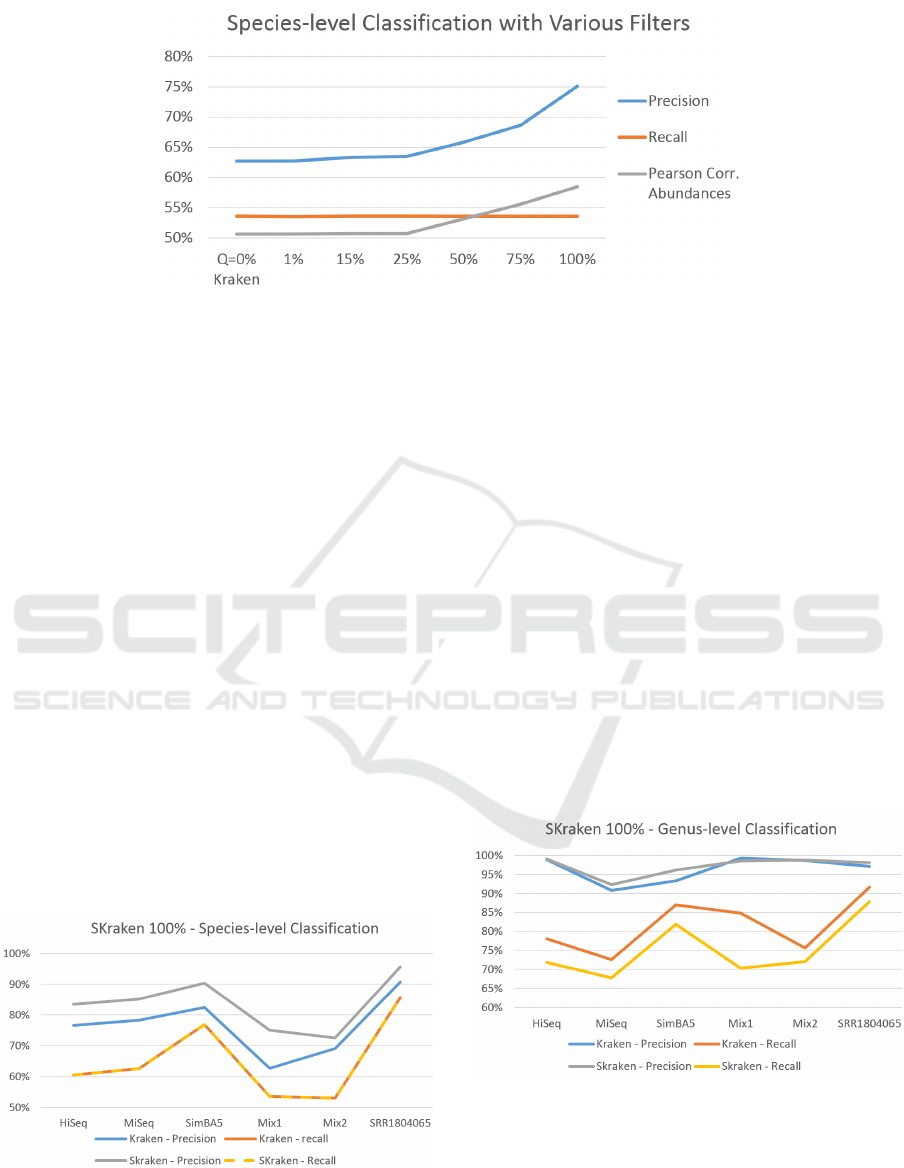
Figure 4: Results on dataset Mix1 varying the filtering parameter Q.
level. The results are reported in Figure 4. If the pa-
rameter Q = 0 all k-mers are kept and there is not fil-
tering, thus the performance of Kraken and SKraken
are identical. As Q grows we can see that the preci-
sion improves from 63% to 75%, whereas the recall
remains constant. However, it is not obvious that by
classifying more reads correctly also the distribution
of species is consistent with the correct profile. For
this reason, another important observation is that also
the Pearson correlation with the known abundance ra-
tios also increases. This behavior is observed also for
the other datasets (data not shown).
Thus, we use the most stringent filtering (Q =
100%) to classify all dataset at the species-level. Fig-
ure 5 shows a summary of precision and recall for
all simulated and real metagenomic datasets. This
test confirms that SKraken is able to improve the pre-
cision on all datasets without compromising the re-
call. On simulated metagenomes the average preci-
sion increases on from 73% of Kraken to 81% of
SKraken. Also on the real metagenome, where the
performance of Kraken are excellent with a precision
of 91%, SKraken achieves 96%.
Figure 5: Precision and Recall of Species-level classifica-
tion of Kraken and SKraken (Q = 100%) for all datasets.
In general the study of metagenomic sample re-
quires an analysis in depth of the genomic content,
and for this reason researchers focus at the lowest tax-
onomic level, species. However metagenomic reads
can be mapped at a higher level, thus the classification
at the genus-level is also of interest. We performed a
set of experiments similar to the ones above, consid-
ering the genus taxonomic level for classification. At
first we try to use as filtering parameter Q = 100%,
and the results are in Figure 6. If we observe the per-
formance of Kraken at genus level we can see that are
better than those at species level, as expected. In fact,
in the taxonomy tree, when the classification level is
more specific, the label assignment is more difficult.
Moreover, it is possible that, although at species level
a read is assigned a wrong label, at genus level the
same label is indeed correct, thus making genus level
classification relatively less difficult. In fact the av-
erage precision of Kraken is 96% at genus-level and
73% at species-level.
Figure 6: Precision and Recall of Genus-level classification
of Kraken and SKraken (Q = 100%) for all datasets.
With filtering parameter Q = 100% the precision
improves in almost all datasets, however the recall of
SKraken decreases. If we consider a less stringent
threshold Q = 25% (see Figure 7), we can obtain re-
BIOINFORMATICS 2017 - 8th International Conference on Bioinformatics Models, Methods and Algorithms
64
sults that are in line with the previous experiments,
with a moderate improvement in the precision and re-
call almost unchanged. A possible explanation of the
small gain in terms of precision is the fact that the
classification at the genus level is relatively easier, and
Kraken has already very good performance.
Figure 7: Precision and Recall of Genus-level classification
of Kraken and SKraken (Q = 25%) for all datasets.
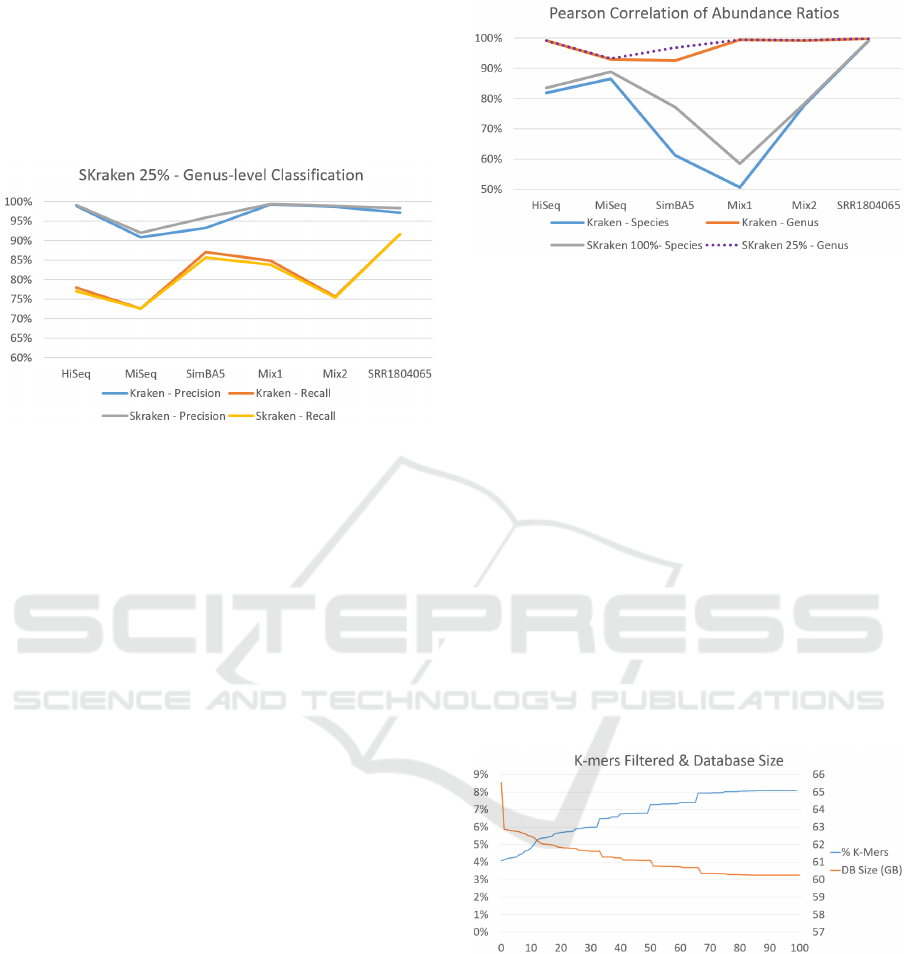
In the last series of experiments we test the abil-
ity to detect the correct abundance ratios in a metage-
nomic sample. The Pearson correlation is used to
compare the estimated abundances with the known
ones. Figure 8 reports the correlations for various
level of classification. The correlations of Kraken
at the genus level are very high and difficult to im-
prove, however SKraken obtains similar results on al-
most all metagenomes with the exception of simBA5
where the correlation increases from 0.92 to 0.97.
This dataset, simBA5, is also one of the most com-
plex and realistic metagenomes with 1216 species. If
we compare these Pearson correlations with those of
species level classification in general the values de-
crease confirming that it is more difficult to detect the
correct species, rather than the genus. This is the case
where the classification accuracy can benefit from a
careful selection of discriminative k-mers. In fact for
all dataset the correlation of SKraken is better the
original algorithm. The average Pearson correlation
of Kraken is 0.71 and of SKraken is 0.77. Again, in
one of the most difficult metagenome, simBA5, the
improvement is substantial from 0.61 to 0.77.
To summarize the results of these experiments on
different simulated and real datasets have shown that
SKraken is able to improve the precision in the tax-
onomic classification of metagenomic reads without
compromising the recall. Not only more reads are
classified to the correct taxa, but also the estimated
abundance ratios is better than the one computed by
Kraken. An important property of SKraken is that
the impact on these metrics improves as the taxo-
nomic level evaluated in the classification becomes
Figure 8: The Pearson correlation of the estimated abun-
dances with the correct ratios for various level of classifica-
tion and parameters.
lower and thus more difficult. Moreover, as the num-
ber of newly sequenced species grows the probability
that two non-related species share a given k-mer will
grows. For this reason we conjecture that SKraken
will be able to remove more uninformative k-mers as
the number of sequenced genomes increases.
3.1 Filtered k-mers and Memory
Another effect of SKraken is that, since k-mers are
filtered, the size of the augmented taxonomic tree de-
creases. This database needs to be loaded in memory
in full during the classification step. The size of the
database produced by Kraken, when using all bacte-
rial and archaeal complete genomes in NCBI RefSeq,
is about 65GB and it contains 5.8 billion k-mers.
Figure 9: Percentage of k-mers filtered and Database size as
a function of the quality threshold Q.
In Figure 9 we evaluate the percentage of k-mers
filtered and the impact in memory for different values
of threshold Q. As expected, the percentage of k-mers
filtered grows with the threshold Q and it reaches the
maximum of 8.1% with Q = 100. By construction,
the impact in memory depends linearly by the number
of k-mers to be indexed. When using the most strin-
gent filtering, Q = 100, SKraken requires to index 5.3
billion k-mers in 60GB of space. This reduction de-
creases the amount of RAM required for classifica-
SKraken: Fast and Sensitive Classification of Short Metagenomic Reads based on Filtering Uninformative k-mers
65

tion, but also it increases correspondingly the classifi-
cation speed.
4 CONCLUSIONS
The taxonomic classification of metagenomics reads
remains a crucial step in many metagenomics anal-
ysis. In this work we presented SKraken an ap-
proach based on filtering uninformative k-mers. We
compared the classification performances of SKraken
on several synthetic and real metagenomics datasets,
showing that SKraken achieves in most cases the
best performances in terms of precision and recall
w.r.t. Kraken. In particular the precision at species
level classification improves by 8%. In the estima-
tion of the abundance ratios in a metagenomic sample
SKraken obtains good results on all datasets. This be-
havior is confirmed also on a real stool metagenomic
sample where SKraken is able to detect species with
high precision. Another desirable property is that
SKraken requires less amount of RAM w.r.t. Kraken.
As future direction of investigation it would be inter-
esting to explore alternative definitions of k-mer qual-
ity incorporating other topological information of the
tree of life.
ACKNOWLEDGEMENTS
The authors would like to thank the anonymous re-
viewers for their valuable comments and suggestions.
This work was supported by the Italian MIUR project
PRIN20122F87B2.
REFERENCES
Ames, S. K., Hysom, D. A., Gardner, S. N., Lloyd, G. S.,
Gokhale, M. B., and Allen, J. E. (2013). Scalable
metagenomic taxonomy classification using a refer-
ence genome database. Bioinformatics, 29.
Antonello, M. and Comin, M. (2013). Fast Computation
of Entropic Profiles for the Detection of Conservation
in Genomes, pages 277–288. Springer Berlin Heidel-
berg, Berlin, Heidelberg.
Antonello, M. and Comin, M. (2014). Fast entropic pro-
filer: An information theoretic approach for the dis-
covery of patterns in genomes. IEEE/ACM Transac-
tions on Computational Biology and Bioinformatics,
11(3):500–509.
Antonello, M. and Comin, M. (2015). Fast alignment-
free comparison for regulatory sequences using mul-
tiple resolution entropic profiles. In Proceedings of
the International Conference on Bioinformatics Mod-
els, Methods and Algorithms (BIOSTEC 2015), pages
171–177.
Brown, C., Hug, L., Thomas, B., Sharon, I., Castelle, C.,
and Singh, A. e. a. (2015). Unusual biology across a
group comprising more than 15% of domain bacteria.
Nature, 523(7559):208–11.
Caporaso, J. G., Kuczynski, J., Stombaugh, J., Bittinger,
K., Bushman, F. D., Costello, E. K., Fierer, N., Pea,
A. G., Goodrich, J. K., Gordon, J. I., Huttley, G. A.,
Kelley, S. T., Knights, D., Koenig, J. E., Ley, R. E.,
Lozupone, C. A., McDonald, D., Muegge, B. D., Pir-
rung, M., Reeder, J., Sevinsky, J. R., Turnbaugh, P. J.,
Walters, W. A., Widmann, J., Yatsunenko, T., Zan-
eveld, J., and Knight, R. (2010). Qiime allows anal-
ysis of high-throughput community sequencing data.
Nature methods, 7(5):335336.
Comin, M., Leoni, A., and Schimd, M. (2015). Clustering
of reads with alignment-free measures and quality val-
ues. Algorithms for Molecular Biology, 10(1):1–10.
Comin, M. and Schimd, M. (2014). Assembly-free
genome comparison based on next-generation se-
quencing reads and variable length patterns. BMC
Bioinformatics, 15(9):1–10.
Comin, M. and Verzotto, D. (2012). Whole-genome phy-
logeny by virtue of unic subwords. In Database and
Expert Systems Applications (DEXA), 2012 23rd In-
ternational Workshop on, pages 190–194.
Comin, M. and Verzotto, D. (2014). Beyond fixed-
resolution alignment-free measures for mammalian
enhancers sequence comparison. IEEE/ACM Trans-
actions on Computational Biology and Bioinformat-
ics, 11(4):628–637.
Consortium, H. M. P. (2012). Structure, function and di-
versity of the healthy human microbiome. Nature,
486(7402):207–214.
Felczykowska, A., Bloch, S. K., Nejman-Faleczyk, B.,
and Baraska, S. (2012). Metagenomic approach
in the investigation of new bioactive compounds in
the marine environment. Acta Biochimica Polonica,
59(4):501505.
Girotto, S., Pizzi, C., and Comin, M. (2016). Metaprob:
accurate metagenomic reads binning based on
probabilistic sequence signatures. Bioinformatics,
32(17):i567–i575.
Goke, J., Schulz, M. H., Lasserre, J., and Vingron, M.
(2012). Estimation of pairwise sequence similarity
of mammalian enhancers with word neighbourhood
counts. Bioinformatics, 28(5):656–663.
Huson, D. H., Auch, A. F., Qi, J., and Schuster, S. C. (2007).
Megan analysis of metagenomic data. Genome Res.,
17.
Kantorovitz, M. R., Robinson, G. E., and Sinha, S. (2007).
A statistical method for alignment-free comparison of
regulatory sequences. Bioinformatics., 23.
Lindgreen, S., Adair, K. L., and Gardner, P. (2016). An
evaluation of the accuracy and speed of metagenome
analysis tools. Scientific Reports, 6:19233.
Liu, B., Gibbons, T., Ghodsi, M., Treangen, T., and Pop,
M. (2011). Accurate and fast estimation of taxonomic
BIOINFORMATICS 2017 - 8th International Conference on Bioinformatics Models, Methods and Algorithms
66

profiles from metagenomic shotgun sequences. BMC
Genomics, 12.
Mande, S. S., Mohammed, M. H., and Ghosh, T. S.
(2012). Classification of metagenomic sequences:
methods and challenges. Briefings in Bioinformatics,
13(6):669–681.
Ondov, B. D., Treangen, T. J., Melsted, P., Mallonee, A. B.,
Bergman, N. H., Koren, S., and Phillippy, A. M.
(2016). Mash: fast genome and metagenome distance
estimation using minhash. bioRxiv.
Ounit, R., Wanamaker, S., Close, T. J., and Lonardi, S.
(2015). Clark: fast and accurate classification of
metagenomic and genomic sequences using discrim-
inative k-mers. BMC Genomics, 16(1):1–13.
Qin, J., Li, R., Raes, J., and et al. (2010). A human gut
microbial gene catalogue established by metagenomic
sequencing. Nature, (464):5965.
Said, H. S., Suda, W., Nakagome, S., Chinen, H., Oshima,
K., Kim, S., Kimura, R., Iraha, A., Ishida, H., Fujita,
J., Mano, S., Morita, H., Dohi, T., Oota, H., and Hat-
tori, M. (2014). Dysbiosis of Salivary Microbiota in
Inflammatory Bowel Disease and Its Association With
Oral Immunological Biomarkers. DNA Research: An
International Journal for Rapid Publication of Re-
ports on Genes and Genomes, 21(1):15–25.
Schimd, M. and Comin, M. (2016). Fast comparison of
genomic and meta-genomic reads with alignment-free
measures based on quality values. BMC Medical Ge-
nomics, 9(1):41–50.
Segata, N., Waldron, L., Ballarini, A., Narasimhan, V.,
Jousson, O., and Huttenhower, C. (2012). Metage-
nomic microbial community profiling using unique
clade-specific marker genes. Nat Methods, 9.
Sims, G. E., Jun, S. . R., Wu, G. A., and Kim, S. . H. (2009).
Alignment-free genome comparison with feature fre-
quency profiles (ffp) and optimal resolutions. Proc
Nat Acad Sci., 106.
Vinga, S. and Almeida, J. (2003). Alignment-free sequence
comparison–a review. Bioinformatics., 19.
Wood, D. and Salzberg, S. (2014). Kraken: ultra-
fast metagenomic sequence classification using exact
alignments. Genome Biol., 15.
Zeller, G., Tap, J., Voigt, A. Y., Sunagawa, S., Kultima,
J. R., Costea, P. I., Amiot, A., B
¨
ohm, J., Brunetti,
F., Habermann, N., Hercog, R., Koch, M., Luciani,
A., Mende, D. R., Schneider, M. A., Schrotz-King,
P., Tournigand, C., Tran Van Nhieu, J., Yamada, T.,
Zimmermann, J., Benes, V., Kloor, M., Ulrich, C. M.,
von Knebel Doeberitz, M., Sobhani, I., and Bork, P.
(2014). Potential of fecal microbiota for early-stage
detection of colorectal cancer. Molecular Systems Bi-
ology, 10(11).
Zhang, Z., Schwartz, S., Wagner, L., and Miller, W. (2004).
A greedy algorithm for aligning dna sequences. Jour-
nal of Computational Biology, 7(1-2):203–214.
SKraken: Fast and Sensitive Classification of Short Metagenomic Reads based on Filtering Uninformative k-mers
67
