
Automated Cell Segmentation of Fission Yeast Phase Images
Segmenting Cells from Light Microscopy Images
Jennifer O’Brien
1,2
, Sanual Hoque
1
, Daniel Mulvihill
2
and Konstantinos Sirlantzis
1
1
School of Engineering and Digital Arts, University of Kent, Canterbury, U.K.
2
School of Biosciences, University of Kent, Canterbury, U.K.
Keywords:
Automated Segmentation, Light Microscopy, Fission Yeast.
Abstract:
Robust image analysis is an important aspect of all cell biology studies. The geometrics of cells are critical for
developing an understanding of biological processes. Time constraints placed on researchers lead to a narrower
focus on what data are collected and recorded from an experiment, resulting in a loss of data. Currently,
preprocessing of microscope images is followed by the utilisation and parameterisation of inbuilt functions of
various softwares to obtain information. Using the fission yeast, Schizosaccharomyes pombe, we propose a
novel, fully automated, segmentation software for cells with a significantly lower rate of segmentation errors
than PombeX with the same dataset.
1 INTRODUCTION
Fission yeast are rod-shaped, unicellular organisms
that share the same molecular and cellular pathways
and proteins as more complex eukaryotes (Hayles
et al., 2013). However, they lack differentiated cells
that can complicate experimental results making them
ideal model organisms for studying fundamental cel-
lular processes.
The cell cycle of all eukaryotes has the same four
stages: gap 1 (G1), DNA synthesis (S), gap 2 (G2)
and mitosis (M) (Figure 1). In G1 cells grow to twice
their original size, duplicating all of the internal struc-
tures except the nucleus. Chromosomal duplication
occurs during S phase and this process is checked du-
ring G2. During mitosis the nucleus divides and the
cell separates into two identical daughter cells.
Fission yeast cells grow exclusively from their
ends. Therefore, knowing the length, width and area
of a cell can inform researchers as to how the cell
is growing, and in what stage of the cell cycle it is.
By monitoring these parameters in cultures of mutant
cells, researchers can rapidly determine whether cell
growth or cell cycle regulation are perturbed by the
mutations within the cells genome.
Labelling proteins with fluorescent proteins has
had a significant impact on the types of experiments
bioscientists can design. Previously, 4,6-diaminidino-
2-pheylindole (DAPI) staining was used to visualise
the nuclei of cells. As with all DNA binding agents,
Figure 1: Progression of the cell cycle through stages.
DAPI perturbs DNA organisation and so only single-
time point images of one generation can be analy-
sed (Zink et al., 2003). Using fluorescent proteins
such as green fluorescent protein (GFP) to tag intrin-
sic SNA binding proteins, such as histones, allows
cells to continue growing and dividing and therefore
time-lapse images can be taken to analyse the effect
of mutants on the DNA cycle.
Automating the analysis of microscopy images in-
creases the volume of data that can be scrutinised.
These larger datasets increase the probability of rare,
atypical occurrences being detected and reduce the
risk of skewed data. Another benefit of such programs
is the reduced workload to the researcher, which al-
lows for more experiments to be planned and execu-
ted, and money to be saved.
92
O’Brien J., Hoque S., Mulvihill D. and Sirlantzis K.
Automated Cell Segmentation of Fission Yeast Phase Images - Segmenting Cells from Light Microscopy Images.
DOI: 10.5220/0006149100920099
In Proceedings of the 10th International Joint Conference on Biomedical Engineering Systems and Technologies (BIOSTEC 2017), pages 92-99
ISBN: 978-989-758-215-8
Copyright
c
2017 by SCITEPRESS – Science and Technology Publications, Lda. All rights reserved

1.1 Previous Research
There have been a number of software previously de-
veloped that were designed to segment cells in mi-
croscopy images. Some are designed for use with
rod-shaped cells including, or even specifically, fis-
sion yeast; whilst others are more generic. Many of
these programs, however, require fluorescent images
too for segmentation. Those which are phase only en-
counter problems because fission yeast are unicellu-
lar organisms so images should have a sparser density
than tissue samples which most software is designed
for.
The use of a high content analysis system by
PombeX involves accompanying fluorescently label-
led nuclei images for the phase images. An upda-
ted version now means that the fluorescent images
are not necessary for segmentation. Both methods
distinguish foreground and background pixels based
on intensities and then use an active contour algo-
rithm (Peng et al., 2013). To ensure segmentation
measurements are as reliable as possible, machine le-
arning classifiers remove incorrectly segmented cells
as far as possible.
LineageTracker is another software which has
been designed specifically for fission yeast, but has an
exclusive remit. It was intended for analysing fluores-
cently labelled spindle poles (Schmitter et al., 2013).
Due to the specificity of the program, cell segmenta-
tion requires exactly two fluorescent markers per cell,
which have to be manually selected.
CellSegm is a segmentation software which is de-
signed to segment cells from 2-dimensional or 3-
dimensional fluorescent images. It was intended for
surface stained cells, however, it has been modi-
fied to work without staining by utilising stained nu-
clei (Hodneland et al., 2013). It also has modules
which output statistical data.
RodCellJ is an ImageJ based segmentation pro-
gram. It segments fluorescent nuclei and tracks them,
however, it does not segment the cells from a phase
image (Schmitter et al., 2013). This means that re-
searchers are unable to identify if the cells growth is
perturbed unless it disturbs the DNA cycle.
CellProfiler is a user-friendly interface for cell
segmentation that allows users to create pipelines to
select modules for segmentation. These pipelines are
published and freely available, however, there is not
one currently available which is suited for fission ye-
ast segmentation (Carpenter et al., 2006).
1.2 Problem Formation
We aim to develop a fully automated system that seg-
ments fission yeast cells from phase images with no
additional inputs. These segmented cells should be
accurate to a degree that geometric parameters, such
as cell length, width and area, can be measured. A low
segmentation error rate is crucial as they skew results,
and result in manual segmentation being preferable.
2 METHODOLOGY
2.1 Terminology and Notations Used
EMMG Edinburgh minimal media with glutamate as
a nitrogen source.
°C degrees Celsius.
2.2 Growth and Mounting of Cells
Schizosaccharomyces pombe strain hht-cgfp (gene
encoding for histones is fused to cDNA for GFP at
the endogenous locus resulting in fluorescent nuclei),
provided by the Mulvihill lab were cultured to log
phase in EMMG(Moreno et al., 1991) at 25°C. Cells
were mounted as stated in Fission Yeast: a laboratory
manual(Mulvihill, 2016).
2.3 Image Viewing and Capturing
Program development images were captured on a
photometrics quantEM CCD camera attached to an
Olympus IX71 inverted microscope with a 100x oil
lens. Program testing images were captured on a zyla
4.2 sCMOS camera attached to an Olympus IX71 in-
verted microscope with 60x air and 100x oil lenses.
MetaMorph (Molecular Devices, USA) software was
used to view and capture the images. Different ca-
meras were used to thoroughly test the usability of
the proposed Outline software regardless of the set
up found in different labs. Images were stored as
16-bit or 32-bit (developmental and testing respecti-
vely) TIFF files. Each image consists of a 512 x 512
or 1024 x 1024 array (developmental and testing re-
spectively) with each pixel representing 16 µm by 16
µm or 6.5 µm by 6.5 µm (developmental and testing
respectively).
Altering the focus of the images may result in dif-
ferent outcomes, however, for this study, the images
were captured under the conditions required for hu-
man segmentation. This ensured fair assessment of
segmentation by visual inspection.
Automated Cell Segmentation of Fission Yeast Phase Images - Segmenting Cells from Light Microscopy Images
93
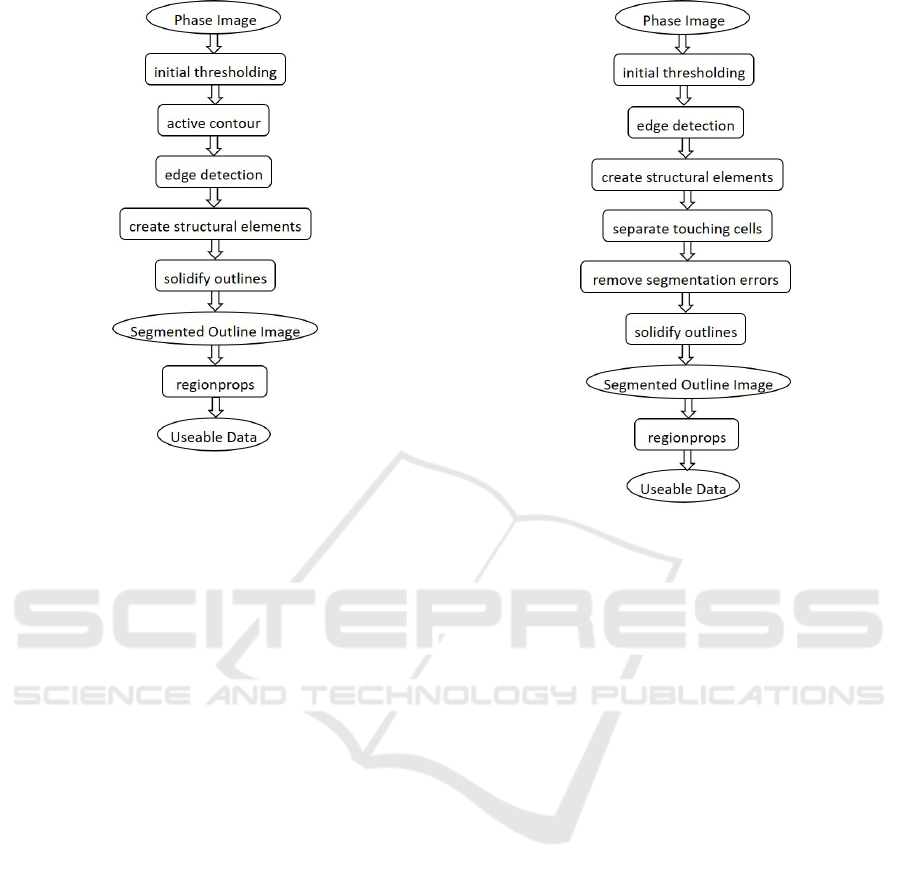
Figure 2: Block diagram of Outline software implementing
the proposed method.
2.4 Proposed Automated Segmentation
Analysis Software
2.4.1 General Description of the Algorithm
The steps of the automated segmentation method pro-
posed in this paper are: Phase Image - the raw image
taken from the saved TIFF file from MetaMorph; Ini-
tial Thresholding was selected based on the version of
the Outline software run; Edge Detection using a Lap-
lacian of Gaussian filter; Structural Elements - hori-
zontal and vertical lines with widths of three pixels
are used to dilate, holes are filled as are the outer four
pixels on each side; Solidifying Outlines opens and
erodes the image with disks of 10 and three pixels re-
spectively; Segmented Outline Image then extracts the
perimeter and overlays the segmentation outlines over
the original image; Regionprops returns the length,
width, area and perimeter etc of the cells; Useable
Data is the output table of Regionprops.
2.4.2 Differences between Outline Versions
The main differences between the different versions
are in the initial thresholding. OutlineV1 has no thres-
holding, OutlineV2 requires a threshold value to be
provided by the user.The threshold values for Outli-
neV2 are selected visually by the user using the Image
Segmenter app in Matlab. The first five images from
each new dataset were assessed and the median seg-
mentation selected for the whole dataset. OutlineV3
Figure 3: Block diagram of FinalOutline software.
automatically thresholds the images.
FinalOutline has the same thresholding as Out-
lineV3, but has additional changes in later stages.
There is a module to segment end-to-end touching
cells which is important for the analysis of just di-
vided cells. Another module which has been added
converts the segmented outlines to red which is easier
to evaluate the accuracy of the segmentation.
2.4.3 Schematic of FinalOutline
The differences and extra modules for the FinalOut-
line software are: Initial Thresholding uses histogram
equalisation; Separate Touching Cells compares the
number of objects before and after the structural ele-
ments, if the number is the same, it continues, if it
is different, it returns to the original image and de-
termines where the ends of the separate cells are in
Separate Touching Cells and creating an artificial di-
vide which is then incorporated in the Solidify Out-
lines module; Remove Segmentation Errors removes
and cell segmentations which have more than four cell
ends detected in Separate Touching Cells. All of the
modules which have not been described here remai-
ned the same between all versions of the Outline soft-
ware.
BIOIMAGING 2017 - 4th International Conference on Bioimaging
94

Figure 4: Segmentations to demonstrate the assessment cri-
teria; (a) perfect, (b) acceptable, (c) unacceptable segmen-
tation, (d) segmentation of background as cell.
3 RESULTS AND DISCUSSION
3.1 Assessing Segmentation Efficiency
Cells which were deemed perfect were segmented to
the standard considered reasonable by manual seg-
mentation. For this paper, we consider this to be
continuously touching the inner or outer line of the
cell wall (Figure 4a). Acceptable segmentations are
when the segmented line deviates slightly from per-
fect segmentation as determined by the researcher (Fi-
gure 4b). Segmentation errors include segmentati-
ons where it is obvious to the human eye that part
of the cell has been excluded or where segmentation
has occurred in a region where there are no cells (Fi-
gure 4c-d). These segmentations skew the data and
are therefore detrimental to program efficacy. These
criteria are still subjective, however, they can be grou-
ped to valid (perfect and acceptable) and invalid (seg-
mentation errors) to demonstrate the usability of the
software to the end user.
Two development datasets were collected on dif-
ferent days to recreate the realistic variability in da-
tasets. A total of 119 images were taken, containing
408 cells - 140 single cells and 268 touching cells.
The results of cell segmentation by each version of
Outline for the combined dataset can be seen in Table
1.
Another dataset was created for testing different
lenses. One dataset per lens was taken for the testing
datasets. The 60x air lens had a total of 300 images
while the 100x oil lens had 200. The segmentation
efficiency of both FinalOutline and PombeX on both
datasets can be seen in Table 2.
The percentages seen in both tables are based on
the total number of cells determined by visual in-
spection.
3.2 Differences between Outline
Software Versions
Automating the initial step of the program for Out-
lineV3 resulted in over a four-fold decrease in per-
fect segmentations and around a ten-fold increase in
erroneous segmentations (Table 1). When compared
to OutlineV3, FinalOutline produces better segmenta-
tion results. The number of perfect segmentations in-
creases from 32 to 177 with nine touching cells being
segmented separately, the slightly off segmentations
also improve from 91 to 137 and the segmentation
errors fall considerably from 50.98% to 13.48% (Ta-
ble 1). These numbers are still high when compared
to the first two versions as there are still significantly
more erroneous segmentations and missed cells.
Some of the missed cells in FinalOutline have
been removed from the segmented output images by
the program in response to Remove Segmentation Er-
rors. This is verifiable as OutlineV1 has a total of
247 cells segmented as touching, OutlineV2 has 249
while only 187 are segmented by FinalOutline (Table
1). Even if all of the erroneous segmentations of Fi-
nalOutline, and none of those from OutlineV1 or Out-
lineV2, were of touching cells, there are less touching
cells included in the output data of FinalOutline.
3.3 Comparison of FinalOutline with
PombeX
Images collected on 100x oil lens are of a higher qua-
lity but do not allow for high throughput. We tested
our program, FinalOutline, and PombeX on both ty-
pes of images. Neither program requires any input
parameters and needs only the phase images for ana-
lysis.
PombeX was able to segment significantly more
cells from the 60x air lens dataset compared to the
100x oil lens dataset (over 10% from less than 1%).
FinalOutline was more successful on the 100x oil da-
taset (27.91% perfect for 100x oil, 6.67% for 60x air;
Table 2). For PombeX, the number of missed cells
was over three-fold more in the 60x air data then the
100x oil data. However, a total of 6.49% of cells mis-
sed in the 60x air data is much lower than the 93.91%
of FinalOutline for the same data.
The most concerning statistic for bioscientists are
the percentage of segmentation errors. These errors
are what skew results and make manual segmentation
preferable over current programs. FinalOutline had
0.58% and 2.25% error rates (100x oil and 60x air
data respectively) which are vast improvements on the
325.00% and 330.74% of segmentation errors (100x
oil and 60 air respectively) of PombeX (Table 2).
Automated Cell Segmentation of Fission Yeast Phase Images - Segmenting Cells from Light Microscopy Images
95
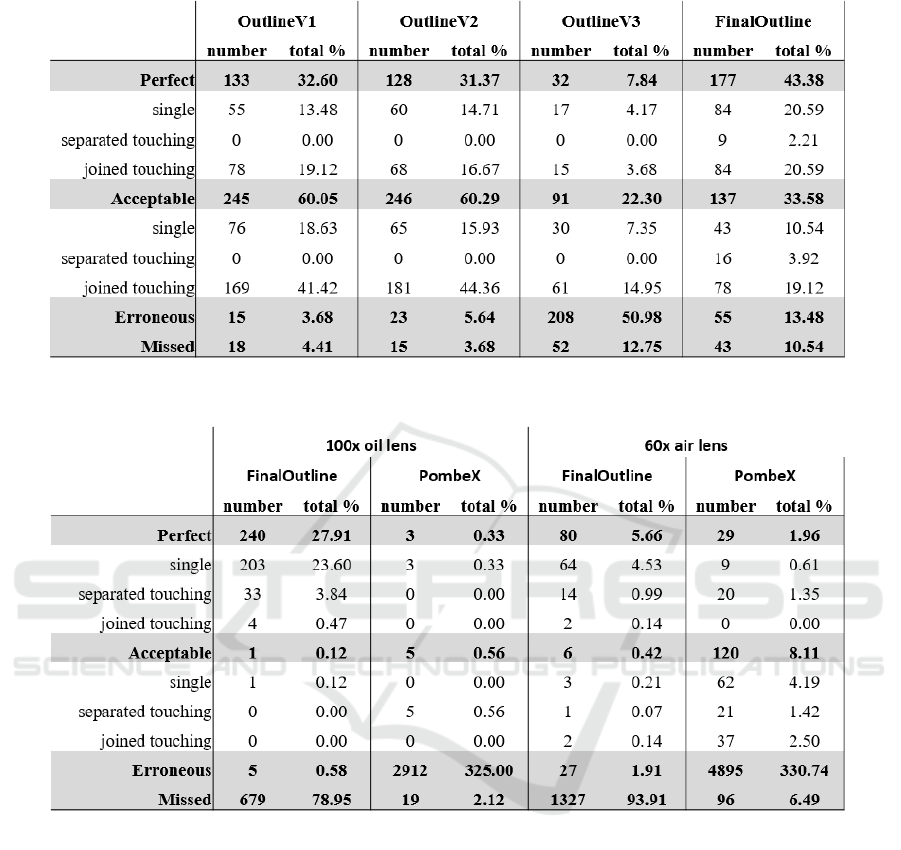
Table 1: Performance of the Outline software.
Table 2: Performance of FinalOutline compared to PombeX on images taken with either a 100x oil lens or a 60x air lens.
Two features FinalOutline has, which PombeX
does not, is an easy input function and saved output
files. The input function allows for a whole folder of
images to be automatically analysed. To set it up for
a new set of data takes less than one minute. Once
it has been configured, the computer can be left until
the researcher is ready.
The output files of FinalOutline include the seg-
mented images and two tables. The first table contains
the image number and the number of cells while the
second table contains the length, width, perimeter and
area of every cell in the dataset. Having these files sa-
ved allows researchers to quickly assess the quality of
the segmentation outlines and remove erroneous data
from the tables based on the images to reduce skew-
ness. PombeX displays the segmented image but has
no statistical output data.
4 CONCLUSION
The proposed automated segmentation software
shows many characteristics beneficial for bioscien-
tists. The software is fully automated and requires no
seeds for segmentation as many other programs do.
The number of segmentation errors are minimal in Fi-
nalOutline but reducing them further will increase the
usability of the program.
BIOIMAGING 2017 - 4th International Conference on Bioimaging
96
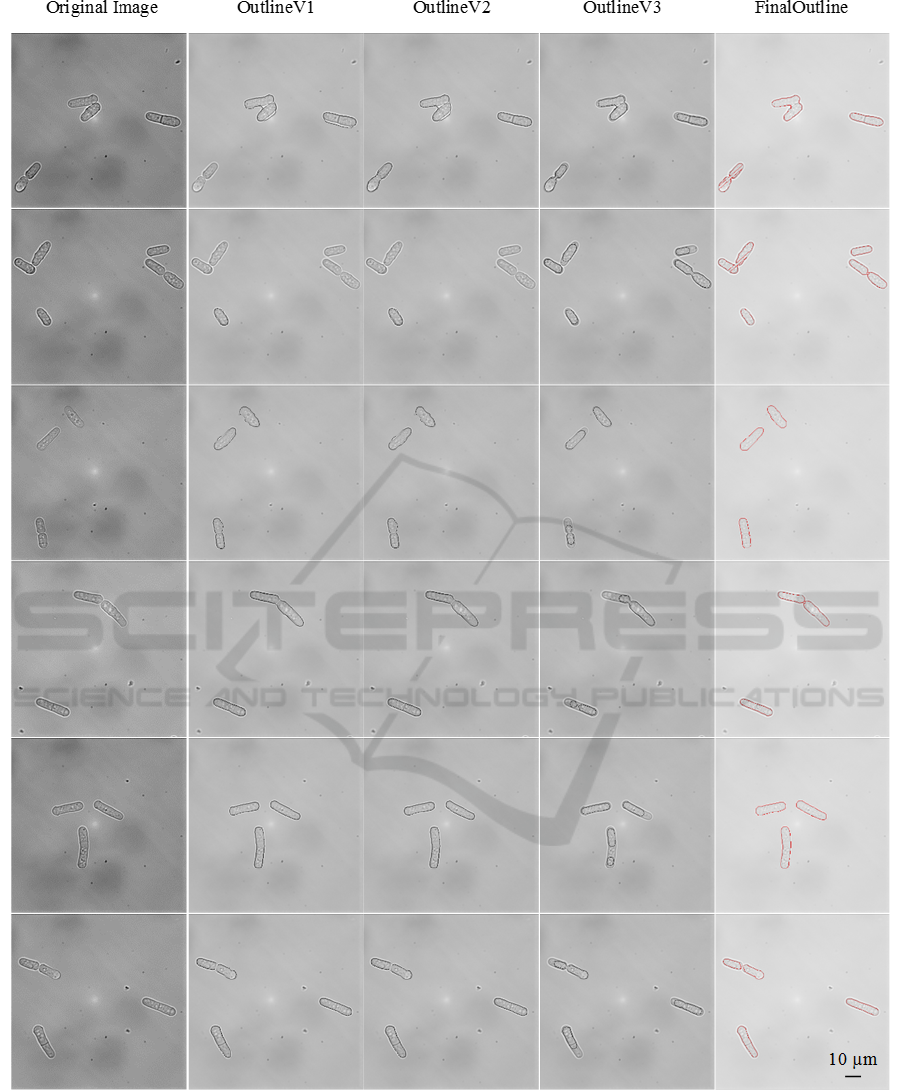
Figure 5: Example images from the developmental dataset; (L-R) original image, output from OutlineV1, output from Outli-
neV2, output from OutlineV3, output from FinalOutline.
ACKNOWLEDGEMENTS
This work was funded by 50th anniversary GTA fun-
ding from the University of Kent, secured by the
Industrial Biotechnology Centre. Support from the
Schools of Biosciences and Engineering and Digital
Arts.
Automated Cell Segmentation of Fission Yeast Phase Images - Segmenting Cells from Light Microscopy Images
97
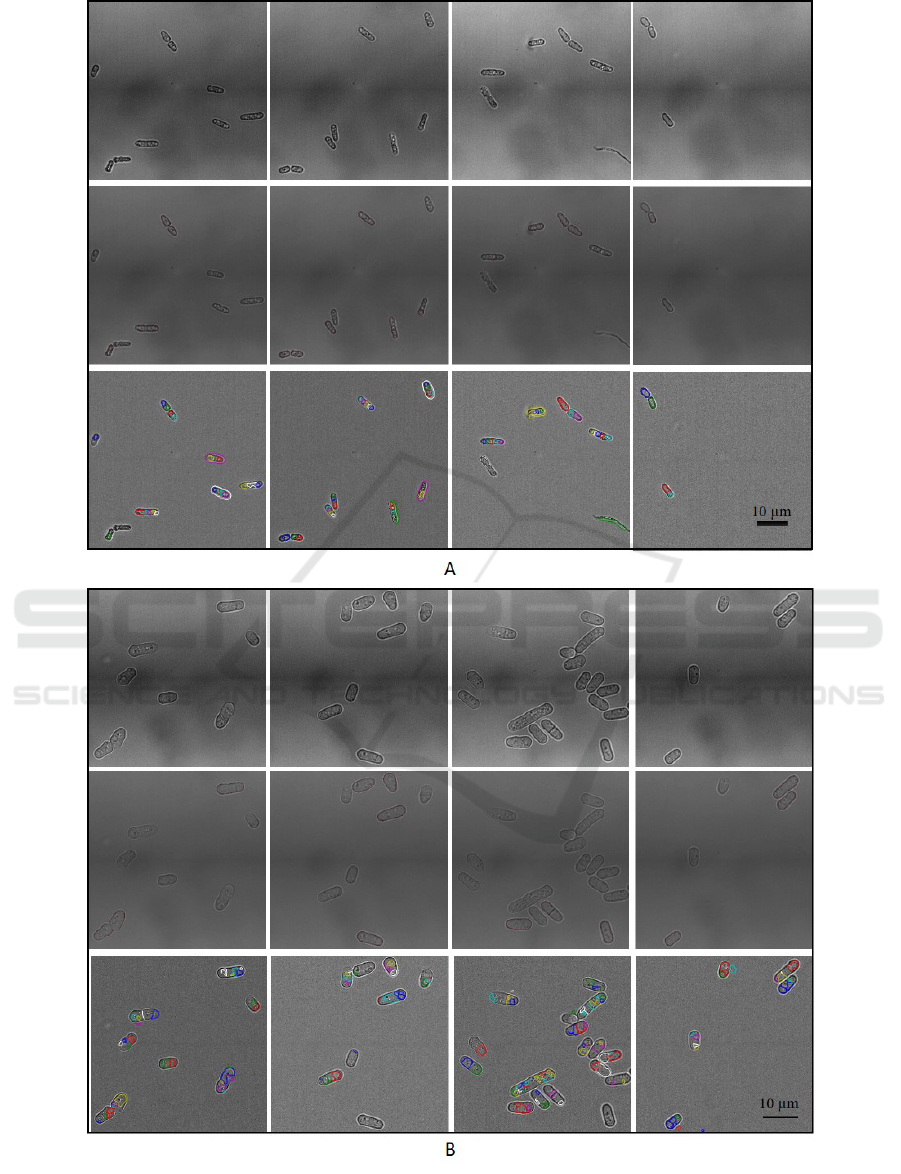
Figure 6: (A) Example images from 60x air lens testing dataset; (T-B) original image, output from FinalOutline, output from
PombeX. (B) Example images from 100x oil lens testing dataset; (T-B) original image, output from FinalOutline, output from
PombeX. Images from FinalOutline output shown with contrast adjusted for clarity.
BIOIMAGING 2017 - 4th International Conference on Bioimaging
98

REFERENCES
Carpenter, A. E., Jones, T. R., Lamprecht, M. R., Clarke, C.,
Kang, I. H., Friman, O., Guertin, D. A., Chang, J. H.,
Lindquist, R. A., Moffat, J., Golland, P., and Sabatini,
D. M. (2006). CellProfiler: image analysis software
for identifying and quantifying cell phenotypes. Ge-
nome Biology, 7:R100.
Hayles, J., Wood, V., Jeffery, L., Hoe, K.-L., Kim, D.-
U., Park, H.-O., Salas-Pino, S., Heichinger, C., and
Nurse, P. (2013). A genome-wide resource of cell cy-
cle and cell shape genes of fission yeast. Open Bio-
logy, 3(5):130053.
Hodneland, E., K
¨
ogel, T., Frei, D. M., Gerdes, H.-H., and
Lundervold, A. (2013). CellSegm - a MATLAB tool-
box for high-throughput 3D cell segmentation. Source
Code for Biology and Medicine, 8(16).
Moreno, S., Klar, A., and Nurse, P. (1991). Molecular ge-
netic analysis of fission yeast Schizosaccharomyces
pombe. Methods Enzymol., 194:795–823.
Mulvihill, D. P. (2016). Fission Yeast: a laboratory manual.
In Hagan, I. M., Carr, A. M., Grallert, A., and Nurse,
P., editors, Fission Yeast, chapter 10. Live C, pages
220–222. CSH Press, Cold Spring Harbor, 1st edition.
Peng, J.-Y., Chen, Y.-J., Green, M. D., Sabatinos, S. A.,
Forsburg, S. L., and Hsu, C.-N. (2013). PombeX: Ro-
bust Cell Segmentation for Fission Yeast Transillumi-
nation Images. PLOS ONE, 8(12):e81434.
Schmitter, D., Wachowicz, P., Sage, D., Chasapi, A., Xe-
narios, I., Simanis, and Unser, M. (2013). A 2D/3D
image analysis system to track fluorescently labeled
structures in rod-shaped cells: application to measure
spindle pole asymmetry during mitosis. Cell Div., 8:6.
Zink, D., Sadoni, N., and Stelzer, E. (2003). Visualizing
chromatin and chromosomes in living cells. Methods,
29(1):42–50.
Automated Cell Segmentation of Fission Yeast Phase Images - Segmenting Cells from Light Microscopy Images
99
