
Boosted Tree Classifier for in Vivo Identification of Early Cervical
Cancer using Multispectral Digital Colposcopy
Nilgoon Zarei
1
, Dennis Cox
2
, Pierre Lane
1
, Scott Cantor
3
, Neely Atkinson
2
, Jose-Miguel
Yamal
4
, Leonid Fradkin
5
, Daniel Serachitopol
2
, Sylvia Lam
1
, Dirk Niekerk
6
, Dianne Miller
7
,
Jessica McAlpine
7
, Kayla Castaneda
5
, Felipe Castaneda
5
, Michele Follen
5
and Calum MacAulay
1
1
Integrative Oncology, BC Cancer Research Centre and University of British Columbia,
Vancouver, British Columbia, Canada
2
Rice University, Houston, U.S.A.
3
University of Texas, MD Anderson Cancer Center, Houston, U.S.A.
4
University of Texas, Houston, U.S.A.
5
Brookdale Hospital and Medical Center, New York, U.S.A.
6
BC Cancer Agency, Vancouver, Canada
7
Vancouver General Hospital, Vancouver, Canada
Keywords: Boosted Tree Classifier, Machine Learning, Image Processing, Multispectral Digital Colposcopy, Cervical
Cancer.
Abstract: Background: Cervical cancer develops over several years; screening and early diagnosis have decreased the
incidence and mortality threefold over the last fifty years. Opportunities for the application of imaging and
automation in the screening process exist in settings where resources are limited. Methods: Patients with
high-grade squamous intraepithelial lesions (SIL) underwent imaging with a Multispectral Digital
Colposcopy (MDC) prior to have a loop excision of the cervix. The image taken with white light was
annotated by a clinician. The excised specimen was mapped by the study histopathologist blinded to the
MDC data. This map was used to define areas of high grade in the excised tissue. Eleven reviewers mapped
the histopathologic data into the MDC images. The reviewers’ maps were analyzed and areas of agreement
were calculated. We compared the result of a boosted tree classifier with a previously developed ensemble
classifier. Results: Using a boosted tree classifier we obtained a sensitivity of 95%, a specificity of 96%, and
an accuracy of 96% on the training sets. When we applied the classifier to a test set, we obtained a
sensitivity of 82%, a specificity of 81%, and an accuracy of 81%. The boosted tree classifier performed
better than the previously developed ensemble classifier. Conclusion: Here we presented promising results
which show that a boosted tree analysis on MDC images is a method that could be used as an adjunct to
colposcopy and would result in greater diagnostic accuracy compared to existing methods.
1 INTRODUCTION
Cervical cancer is a preventable disease. However,
approximately 500,000 patients with cervical cancer
are diagnosed every year and about half that many
succumb to the disease. Cervical cancer has
decreased in incidence and mortality in all countries
with organized screening and detection programs.
These programs are costly and require a great deal of
trained personnel. Automated detection of cervical
cancer and its precursors could improve cancer
management in low and middle income countries
where resources do not permit large screening
infrastructure (world cancer research, 2012).
Cervical intraepithelial neoplasia (CIN) or SIL
are cervical cancer precursors which can develop
over three to twenty years into cancer. This long
transition period makes cervical cancer an ideal
cancer for early detection and treatment. Optical
technologies such as fluorescence and reflectance
spectroscopy have been extensively investigated
as effective and non-invasive methods for cancer
Zarei N., Cox D., Lane P., Cantor S., Atkinson N., Yamal J., Fradkin L., Serachitopol D., Lam S., Niekerk D., Miller D., McAlpine J., Castaneda K., Castaneda F., Follen M. and MacAulay C.
Boosted Tree Classifier for in Vivo Identification of Early Cervical Cancer using Multispectral Digital Colposcopy.
DOI: 10.5220/0006148900850091
In Proceedings of the 10th International Joint Conference on Biomedical Engineering Systems and Technologies (BIOSTEC 2017), pages 85-91
ISBN: 978-989-758-215-8
Copyright
c
2017 by SCITEPRESS – Science and Technology Publications, Lda. All rights reserved
85
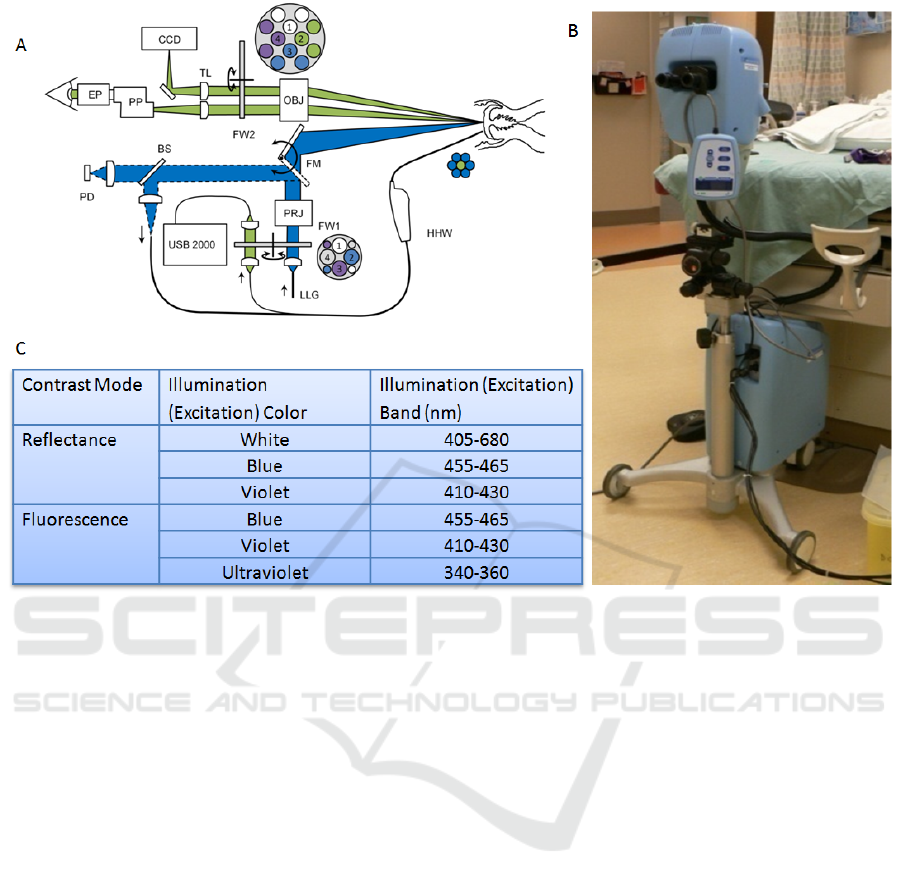
Figure 1: This figure shows A) a cartoon of the Multispectral Digital Colposcope (MDC) device, B) a photo of the “in
house” device, and C) the table of the illumination colour and excitation.
screening. Morphological, cytological and histo-
pathological information can be quantified using
fluorescence and reflectance imaging (Nordstrom et
al., 2001).
We are interested in developing optical
technologies for cervical cancer screening in
developing countries. This device was developed to
be used as an adjunct to colposcopy (a method for
generating a close-up view of the cervix) as an
improved guide for biopsy site selection in resource
rich countries where screening programs are
accessible and robust. This paper reports on the
development of a classification algorithm using
multispectral image data acquired from MDCs.
2 MATERIALS AND METHODS
2.1 Instrumentation
The MDC is a device that combines whole cervix
imaging and a point probe imaging. The analysis
presented here only makes use of the whole cervix
images. The device acquires a cross polarized
white-light illumination image and 2 reflectance and
3 fluorescence images. The system consists of a
colposcope, and a colour charge-coupled device
(CCD) (MicroPublisher 3.3, QImaging) to capture
images. Illumination is provided by a Xenon arc
lamp in the base of the device. The lamp provides
monochromatic and broadband illumination. The
fluorescence excitation light is produced using band-
pass filters enclosed in a motorized filter wheel.
Figure 1 shows the diagram of the system, a
photograph of the system and the specifications of
the reflectance and fluorescence excitation light
produced by this device. These excitation and
emission wavelengths were determined from a
previously reported study. (Chang et al., 2002)
Previous versions of the device generated an
automated diagnosis with 80% sensitivity and 80%
specificity for the diagnosis of high-grade SIL
(Chang et al., 2002, and Benavides et al., 2003, and
Park et al., 2005, and Milbourne et al., 2005 and
Park et al., 2008).
BIOIMAGING 2017 - 4th International Conference on Bioimaging
86
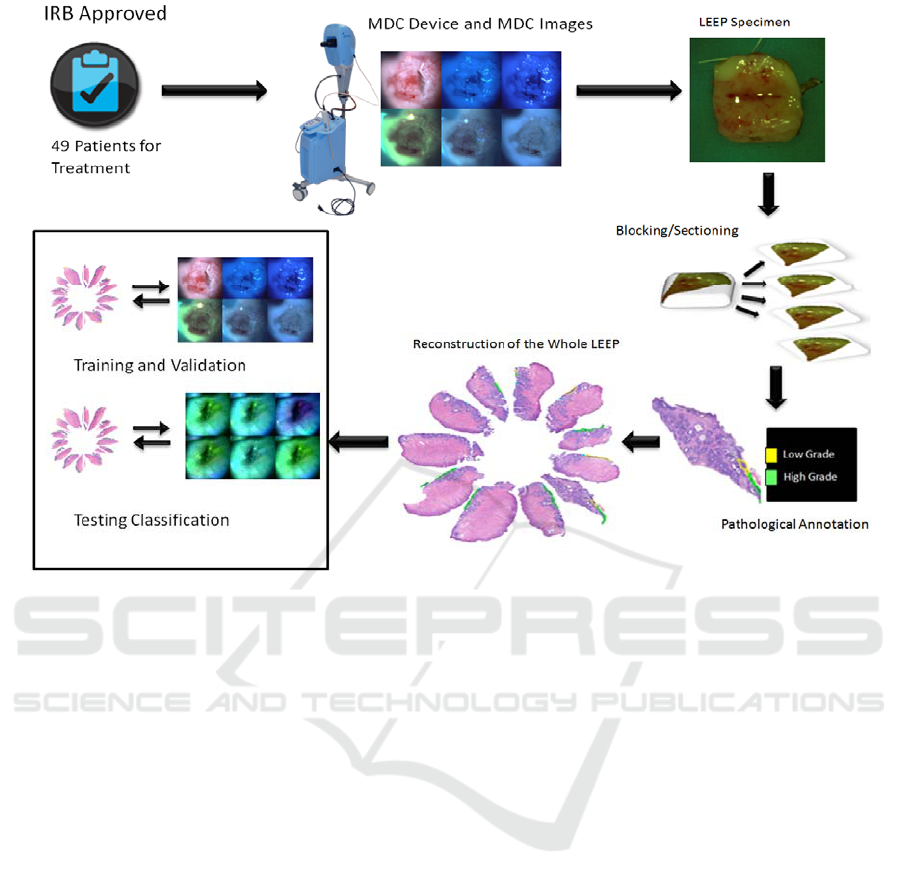
Figure 2: This figure shows the study design. Patients were consented for an IRB-approved study, images were acquired,
the Loop Electrical Excision Procedure (LEEP) was carried out, the specimen were processed and annotated, and the
dataset was subjected to analysis for training and testing classification.
2.2 Clinical Data
2.2.1 Patients Recruitment and Data
Collection
The study protocol was reviewed and approved by
the Institutional Review Board (IRB) at the British
Columbia Cancer Agency. Eligibility requirements
were: 18 years of age or older, high-grade result on a
cytologic sample or colposcopically-directed
biopsies, and not be pregnant. Each patient was to
undergo standard of care Loop Electrical Excision
Procedure (LEEP). Participants signed an informed
consent for this study.
During colposcopic examination, acetic acid
(6%) was applied to the cervix for 2 minutes. Acetic
acid enhances the differences in appearance between
normal and dysplastic tissue. Six images were
taken using the MDC; three reflectance images and
three fluorescence images. Sample images are
shown in Figure 2. The physician/colposcopist was
asked to denote in the white light image which areas
were thought to be most abnormal and were the
margins or edges of the LEEP specimen were
located.
After the application of local anaesthesia, the
patients underwent a LEEP. The removed specimen
was oriented by the surgeon. The specimen is
oriented in reference to a clock face. The most
superior part of the specimen was located at the 12
o’clock position; the most inferior was at the 6
o’clock position. The 12 o’clock position was
marked on the specimen before going to
pathological processing where it was cut into 6-12
pieces each piece’s clock position recorded prior to
embedding to keep the specimen fragments oriented
in the later process.
The LEEP pieces were sectioned and reviewed
by a clinical pathologist for final diagnosis and
annotated by the study pathologist. Each section
was carefully marked identifying areas of low-grade
SIL, high-grade SIL, and cancer. Preserving the
orientation of each section from each piece helped
us to reconstruct the histopathologic map which
served as the gold standard for the rest of this study.
Figure 2 shows a representation of this process.
Boosted Tree Classifier for in Vivo Identification of Early Cervical Cancer using Multispectral Digital Colposcopy
87
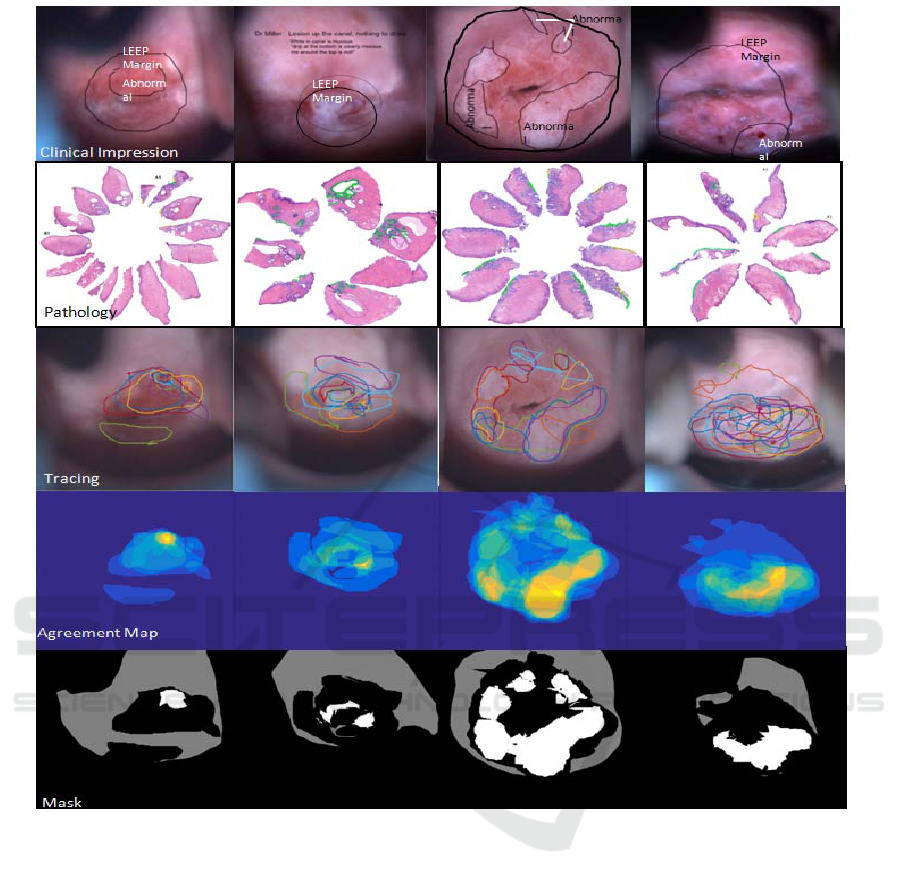
Figure 3: This figure shows four patients results. In each column we present the clinical impression of the colposcopist, the
histopathologic map, the tracing by the 11 reviewers, the agreement map, and the mask generated by the calculation of 60%
agreement.
2.2.2 Data Preparation and Pre-Processing
Gaussian filters were used to reduce the noise in the
images. Image registration was used to correct for
image rotation and image translation due to patient
motion. We used an automated registration
algorithm from MATLAB, “imregister” which was
successful in 80% of the cases and for the rest of the
images we used manual registration using the
cervical os and other landmarks in each image. For
the registration process, the white light image was
used as our reference.
2.2.3 Image Annotation
A group of 11 experts were tasked with tracing the
areas (Region of Interest, ROI) that they believed
were associated with high-grade disease based upon
only the reconstruction pathology map. The logic to
be used in the determination of the ROIs was: 1)
search for high-grade (≥CIN2) lesions in the
reconstructed pathology map (annotated by the study
pathologist), and 2) match the above annotation (if
found) to the corresponding areas in the MDC
images.
The colposcopic data and MDC images were
acquired from 49 patients. Figure 3 shows images
and tracings of the ROIs for four of the 49 patients.
BIOIMAGING 2017 - 4th International Conference on Bioimaging
88
The uppermost images show the markings made by
the physicians on the white light MDC images. The
next row shows the histopathologic maps annotated
by the study histopathologist. Areas of CIN 2 and 3
are shown with green markings and HPV changes
and CIN 1 are shown with yellow marking. The
next row shows the tracings made by the eleven
reviewers. The agreement maps are shown as heat-
maps in the next row. Finally the last row shows the
defined consensus mask used for our analysis.
2.3 Classifier Design
2.3.1 Labelling the MDC Images
Relative to the MDC white light image for our
consensus image we considered a location as i)
abnormal if 60% of the experts’ annotations defined
it as >CIN2 (we chose 60% agreement in order to
have enough positive pixels), ii) “uncertain” if
experts’ annotation defining it as >CIN2 was greater
than 0 % but less than 60% , and iii) normal
otherwise. Registration relative to the white light
image was carried out on all five MDC images,
which specifically included the blue and violet
reflectance images and the blue, violet and
ultraviolet fluorescence images. We then labeled
each of the MDC image pixels based on their
correspondence to the consensus image.
For our analysis we used a Windows-based
approach wherein 10x10-pixel windows were
selected from the abnormal/normal areas of MDC
images. The corresponding label for this region was
the label at the middle of the 10x10 window in the
consensus mask. After cleaning the dataset
(removing the “uncertain pixels) we obtained
248,960 pixels that were used for classification.
2.3.2 Feature Selection
We used a histogram of the intensities within each
window region as our set of features. The reason for
this selection was due to the histogram property
which conveyed statistical information regarding the
image intensity distribution including mean and
variance
.
2.3.3 Training, Validation, and Test Dataset
We divided our dataset into two sets: 80% were used
for training-validation and 20% were used as the test
set. We used a boosted tree classifier for our analysis
(Windeatt and Ardeshir, 2002). The input of our
classifier is the features defined as above (histogram
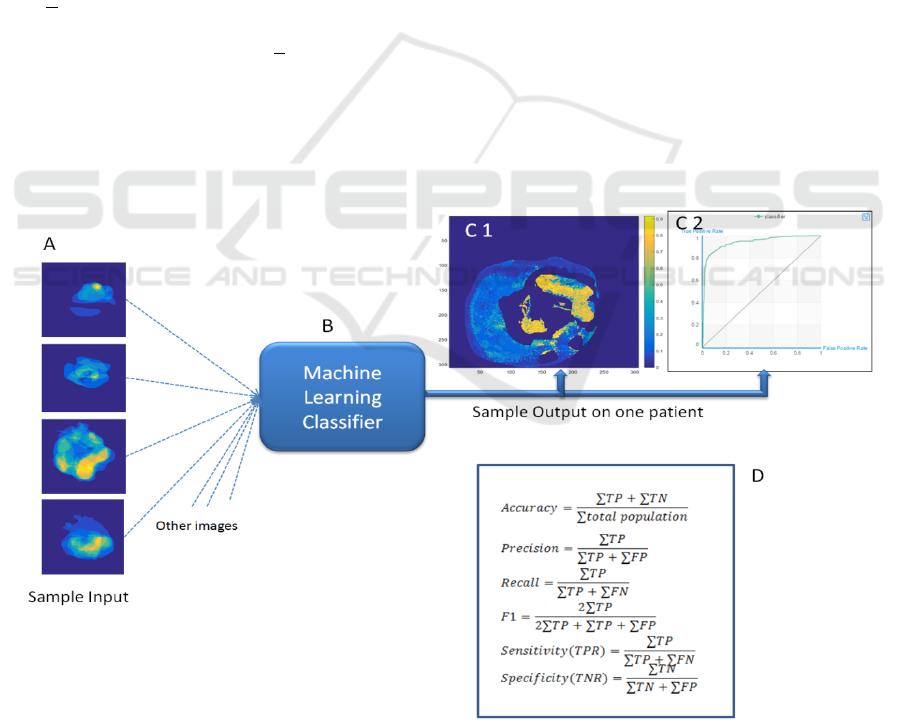
Figure 4: This figure shows the strategy for the analysis. Eighty percent of the data was used to train a classifier, shown in
A. The classifier was tested on the remaining data (B). Output from a sample patient is shown in C 1 and 2. The probability
of disease in shown in C1 and the Receiver Operating Characteristic (ROC) curve is shown in C2. The formulas in D are
used to report the results of the training and test data.
Boosted Tree Classifier for in Vivo Identification of Early Cervical Cancer using Multispectral Digital Colposcopy
89
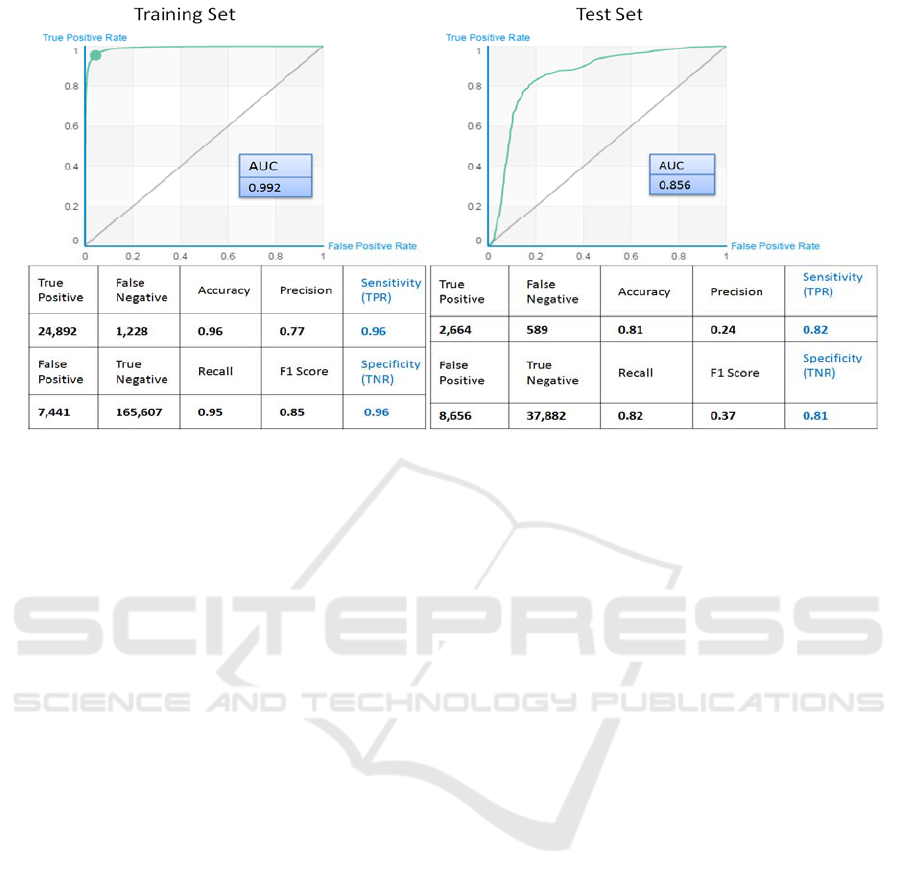
Figure 5: This figure represents the results of the boosted tree classifier. On the left, we shows the results of the training and
validation set using 80% of the data. On the right, we show the results on the test set for the remaining 20% of the data.
of intensities for all MDC images), and the output is
the predicted labels for each pixel.
Figure 4 shows the strategy followed for the
analysis. As shown in the figure, a probability map
and a Receiver Operating Characteristic (ROC)
curve can be generated for the pixels of each image.
Data on the results of the boosted tree analysis for
the entire data set is represented in the sensitivity
(recall), specificity, accuracy, precision and an F1
score values.
3 RESULTS
The classification results on both training and test
sets are summarized in Figure 5. We obtained 95%
sensitivity and 96% specificity when we applied a
boosted-tree classifier to the training set and 82%
Sensitivity and 81% specificity with the test set.
Area Under the Curve (AUC) was 0.99 and 0.86 for
training and test set respectively.
4 DISCUSSION
We compared our method with the existing method
presented on cervical image data in (Park, et al.,
2008) Park group designed an ensemble classifier
that consisted of four classifiers, a linear classifier
with Euclidian distance, a linear classifier with
Mahalanobis distance, a K-nearest neighbour (KNN)
classifier with eight neighbours, and a support vector
machine with a linear kernel. In This paper the
ensemble classifier used only the information in
white light images. To compare our method with this
method (Park et al., 2008) we implemented their
classifier and used only the white light image pixel
intensities as input. The result is presented as the red
dashed line in Figure 6 suggests near random
prediction. When we added other MDC image pixel
intensities as input to the ensemble classifier (MDC
images), the output ROC curve improved, as shown
in Figure 6 by blue dashed line. Our boosted-tree
classifier which used MDC images outperformed the
method presented from Park group (red dashed line)
significantly as shown by the green line in Figure 7.
The strengths of this study are found in the
detailed specimen histological review and mapping.
The large number of pixels provides a relatively
large data set for analysis. Dividing the data into
training and test sets allows better estimation of
overtraining effects.
Weaknesses of the study include the fact that the
histopathologic map does not include detailed
section data from every square millimeter of the
excised sample. Thus, assumptions were made
about the tissue in-between the sections. Another
potential study weakness is how the reviewers
interpreted the instructions and how accurately they
defined the lesions in the consensus map
.
BIOIMAGING 2017 - 4th International Conference on Bioimaging
90
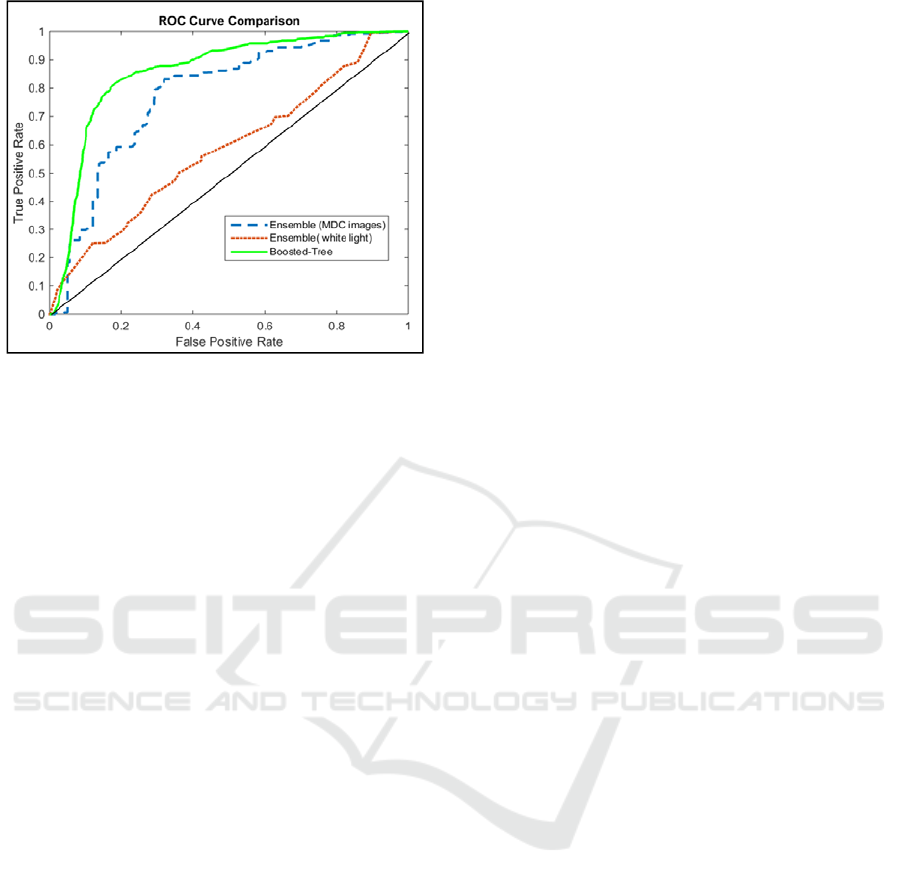
Figure 6: This figure shows the results of the Ensemble
(MDC images and only white light) and the Boosted-Tree
classifier applied to the test set data.
5 CONCLUSIONS
In this paper, we showed preliminary results from
our pilot study for classification of CIN2 or worse
tissue from CIN1 or better tissues in cervix. We
designed a boosted tree classifier which used the
information from the MDC images. We presented
promising results that outperformed existing
methods applied to cervical images. This study is at
an early stage and a larger dataset is needed to
validate the effectiveness of this method, we believe
this method has the potential to be used as an
adjunct to colposcopy and would result in greater
accuracy of diagnosis compared to existing methods.
REFERENCES
World Cancer Research, http://www.wcrf.org/int/cancer-
facts-figures/data-specific-cancers/cervical-cancer-
statistics (13 September 2016).
Nordstrom, et al., 2001 "Identification of cervical
intraepithelial neoplasia (CIN) using UV excited
fluorescence and diffuse reflectance tissue
spectroscopy." Lasers in Surgery and Medicine 29.2
118-127.
Chang, et al., 2002, "Optimal excitation wavelengths for
discrimination of cervical neoplasia." IEEE
Transactions on Biomedical Engineering 49.10, 1102-
1111.
Benavides, et al., 2003, "Multispectral digital colposcopy
for in vivo detection of cervical cancer." Optics
Express 11.10, 1223-1236.
Park, et al., 2005, "Multispectral digital microscopy for in
vivo monitoring of oral neoplasia in the hamster cheek
pouch model of carcinogenesis." Optics Express 13.3,
749-762.
Milbourne, et al., 2005,"Results of a pilot study of
multispectral digital colposcopy for the in vivo
detection of cervical intraepithelial
neoplasia."Gynecologic Oncology 99.3, S67-S75.
Windeatt, and Ardeshir, 2002, Boosted tree ensembles for
solving multiclass problems. In International
Workshop on Multiple Classifier Systems (pp. 42-51),
Springer Berlin Heidelberg.
Park, et al., 2008 "Automated image analysis of digital
colposcopy for the detection of cervical
neoplasia." Journal of Biomedical Optics 13.1,
014029-014029.
Boosted Tree Classifier for in Vivo Identification of Early Cervical Cancer using Multispectral Digital Colposcopy
91
