
Linear Discriminant Analysis based on Fast Approximate SVD
Nassara Elhadji Ille Gado, Edith Grall-Maës and Malika Kharouf
University of Champagne / University of Technology of Troyes,
Charles Delaunay Institute(ICD) UMR 6281 UTT-CNRS / LM2S, Troyes, France
{nassara.elhadji_ille_gado, edith.grall, malika.kharouf}@utt.fr
Keywords:
LDA, Fast SVD, Dimension Reduction, Large Scale Data.
Abstract:
We present an approach for performing linear discriminant analysis (LDA) in the contemporary challeng-
ing context of high dimensionality. The projection matrix of LDA is usually obtained by simultaneously
maximizing the between-class covariance and minimizing the within-class covariance. However it involves
matrix eigendecomposition which is computationally expensive in both time and memory requirement when
the number of samples and the number of features are large. To deal with this complexity, we propose to use a
recent dimension reduction method. The technique is based on fast approximate singular value decomposition
(SVD) which has deep connections with low-rank approximation of the data matrix. The proposed approach,
appSVD+LDA, consists of two stages. The first stage leads to a set of artificial features based on the original
data. The second stage is the classical LDA. The foundation of our approach is presented and its performances
in term of accuracy and computation time in comparison with some state-of-the-art techniques are provided
for different real data sets.
1 INTRODUCTION
Linear Discriminant Analysis (LDA) is a well-known
supervised technique for feature extraction (Fried-
man, 1989), (Duda et al., 2012), (Welling, 2005).
It has been widely used in many applications such
as face recognition (Chen et al., 2005), handwritten
code classification (Hastie et al., 2001), text classi-
fication (Moulin et al., 2014). The traditional LDA
seeks a projection matrix so that data points in dif-
ferent classes are far from each other while those in
the same class are close to each other, thus achieving
maximum discrimination. To find such optimal pro-
jection matrix, LDA involves eigendecomposition of
the scatter matrices. For face recognition and docu-
ments classification for example, the intrinsic struc-
ture of samples can make a scatter matrix singular
since the data sets are from a very high-dimensional
space. In high dimensional context, the singularity
problem and eigendecomposition complexity of the
scatter matrices make LDA infeasible.
Many approaches have been proposed to outper-
form LDA in high dimension (Yu and Yang, 2001)
(Ye and Li, 2004) and (Ye et al., 2005). A common
way to deal with the curse of dimensionality is to de-
termine an intermediate subspace where optimization
problems can be solved efficiently with much smaller
size matrices. Dimension reduction strategies consist
in eliminating irrelevant information. The most popu-
lar techniques proposed for dimension reduction with
large scale data sets are principal component analysis
(PCA)(Lee et al., 2012) and random projection (RP)
(Achlioptas, 2003), (Cardoso and Wichert, 2012).
In this paper, we use a dimension reduction strat-
egy which uses fast approximate singular value de-
composition (SVD) (Menon and Elkan, 2011). This
technique was also used in (Boutsidis et al., 2015).
The principle is to reconstruct some d-dimensional
feature space onto its best rank-k approximation for
some k ≪ d. After dimension reduction, it becomes
practically easy to handle data in the new reduced fea-
ture space. Hence, the proposed appSVD+LDA ap-
proach deals with a multi-class supervised classifica-
tion problem. It consists of outperforming the tradi-
tional LDA in a new artificial subspace constructed by
fast approximate SVD.
The remainder of this paper is organized as fol-
lows: in section 2, we give a brief description of LDA
and fast approximate SVD methods. In section 3,
we describe the proposed approach appSVD+LDA.
In section 4 numerical results supporting the perfor-
mance of the proposed approach compared to some
state-of-the-art methods are presented. Finally in sec-
tion 5 we conclude the paper.
Gado, N., Grall-Maës, E. and Kharouf, M.
Linear Discriminant Analysis based on Fast Approximate SVD.
DOI: 10.5220/0006148603590365
In Proceedings of the 6th International Conference on Pattern Recognition Applications and Methods (ICPRAM 2017), pages 359-365
ISBN: 978-989-758-222-6
Copyright
c
2017 by SCITEPRESS – Science and Technology Publications, Lda. All rights reserved
359

2 A BRIEF REVIEW OF LDA AND
FAST APPROXIMATE-SVD
2.1 Classical Linear Discriminant
Analysis (LDA)
In this section, we give a brief LDA basics. Con-
sider the following supervised multi-class classifica-
tion problem : we dispose of a set of N labelled data
belonging to K classes {C
1
,C
2
, ...,C
K
} with class size
{N
1
, N
2
, ...,N
K
}, where N
1
+ N
2
+ ... + N
K
= N.
X = {x
1
, x
2
, ..., x
N
} where x
i
∈ R
1×d
is the observed
sample and {y
i
}
i=1,...,N
, y
i
∈ 1...K is the given class
membership for x
i
. The goal is to build a classifier
based on the training set X ∈ R
N×d
to predict the class
label of a new unlabelled set X
u
= {x
u
1
, x
u
2
, ..., x
u
N
u
}.
The LDA objective function is to seek a projection
matrix W such that the data points in the new space
which belong to the same class are very close while
data points in different classes are far from each other
(Welling, 2005). W maximizes the following ratio
J(W) = argmax
W
det(W
T
S
b
W)
det(W
T
S
w
W)
. (1)
S
b
is the between class scatter matrix and S
w
is the
within class scatter matrix defined by
S
b
=
K
∑
i=1
N
i
(m
i
− m)
T
(m
i
− m),
S
w
=
K
∑
i=1
∑
x
j
∈C
i
(x
j
− m
i
)
T
(x
j
− m
i
), (2)
where m =
1
N
∑
N
i=1
(x
i
) is the total sample mean vec-
tor, m
i
is the mean vector of the i-th class.
The optimal discriminative projection matrix W
can be obtained by computing the eigenvectors of the
matrix S
−1
w
S
b
(Chen et al., 2005). Since the rank
of S
b
is bounded by K − 1, there are at most K − 1
eigenvectors corresponding to non zeros eigenvalues.
The time complexity and the memory requirement in-
crease with N and d. Then, when N and d are large
(or d is large), it is difficult to perform LDA.
2.2 Fast Approximate-SVD
Low-rank approximation or approximate SVD is a
minimization problem, in which the cost function
measures the fit between a given matrix (the data)
and an approximating matrix (the optimization vari-
able), subject to a constraint that the approximating
matrix has a reduced rank. The problem aims to
find a low-rank matrix X
k
which approximates the
matrix X in some lower rank such as min
X
k
k X −
X
k
k
F
s.t. rank(X
k
) = k where F indicates the Frobe-
nius norm.
Approximate SVD can be seen as a process of
finding a rank-k approximation as forcing the origi-
nal matrix to provide a shrunken description of itself.
The problem is used for mathematical modeling and
data compression. Let X ∈ R
N×d
be the data matrix,
and let the SVD of X be of the form :
X = UΣV
T
(3)
where, U ∈ R
N×N
, V ∈ R
d×d
and Σ ∈ R
N×d
. The
matricesU andV are orthogonal. Σ is a semi-diagonal
matrix with non-negative real numbers entries σ
1
≥
. . . ≥ σ
s
> 0 (singular values) where s ≤ min{N, d}.
Giving a value of k ≤ min{N, d} and by using (3),
the truncated form X
k
of X is defined by :
X
k
=
∑
k
i=1
u
i
v
i
T
σ
i
= U
k
Σ
k
V
k
T
, (4)
where only the first k column vectors of U, V and
the k × k sub-matrix are selected. The form X
k
in
(4) is mathematically guaranteed to be the optimal
approximation of X (Boutsidis et al., 2015). Due to
the orthogonality of U
k
,V
k
, the matrix XV
k
V
k
T
(resp.
U
k
U
k
T
X) has rank at most equal to k and ap-
proximates X. The computation complexity of (4)
is O(Nd min{N, d}) which makes it infeasible if
min{N, d} is large.
To speed up the computation of the best rank-k ap-
proximation of X, it is possible to use a fast approxi-
mate SVD algorithm. This algorithm, recently used in
(Boutsidis et al., 2015), uses random projection. The
principle is the following (Menon and Elkan, 2011) :
we consider the subspace spanned by a random pro-
jection Y = X × R where R is a d × p random matrix.
It is shown that by projecting X onto the column space
of Y, and then finding the best rank-k approximation
to this new space (i.e. the truncated SVD), we get a
good approximation to the best rank-k approximation
of X itself. Thus the algorithm of fast approximate
SVD takes as input the matrix X and integers k and
p such that 2 < k < rank(X) and k ≤ p ≪ d. The er-
ror in the approximationis directly linked to p (details
about the error bound can be found in (Boutsidis et al.,
2015)). The fast approximate SVD (Fast-AppSVD)
algorithm is the following:
1. Generate an d × p random matrix R ∼ N (0, I
p
),
2. Compute the matrix Y = XR,
3. Orthonormalize Y to obtain Q of size N × p,
4. Set G (of size d × k) as the top k right singular
vectors of Q
T
X.
Then G can be used as a projection matrix.
ICPRAM 2017 - 6th International Conference on Pattern Recognition Applications and Methods
360

3 THE PROPOSED APPROACH
The proposed approach proceeds in two steps. Firstly,
we perform a feature selection by applying the fast
approximate SVD described in the previous section.
k-dimensional space obtained in the first step. The
proposed approach allows to perform the linear dis-
criminant analysis with very large matrix. The algo-
rithm 1 gives the main steps of our method.
Algorithm 1: appSVD+LDA algorithm.
INPUTS : X, Y, p, k, and µ
OUTPUT :
e
W
1. Compute G = Fast-AppSVD(X, p, k),
2. Project X using G to obtain
˜
X = XG,
3. Calculate
e
S
w
and
e
S
b
from
˜
X,
4. Find
e
W as the eigenvectors of (
e
S
w
)
−1
e
S
b
if
e
S
w
is not
singular and of (
e
S
w
+ µI
p
)
−1
e
S
b
else,
5. Return
e
W.
If the scatter matrix
e
S
w
is singular, we perform a
regularized process to solve the singularity problem,
i.e, we compute (
e
S
w
+ µI
p
)
−1
e
S
b
where µ is a regular-
ized term. Note that (
e
S
w
+ µI)
−1
involves to add a di-
agonal term to
e
S
w
to make sure that very small eigen-
values are bounded away from zero, which ensures
the numerical stability when computing the inverse of
e
S
w
.
It can be demonstrated that the projection matrix
e
W is a good approximation ofW. The data covariance
matrix in the d- original space is given by
S =
1
N
(X − m)
T
(X − m).
The Fast-AppSVD algorithm provides G such that
XGG
T
is a low rank approximation of X. The ma-
trix
˜
X = XG is a new representation of the original
data matrix in the reduced feature space. In the new
space, the covariance matrix
˜
S can be written as
˜
S =
1
N
(
e
X − em)
T
(
e
X − em)
=
1
N
(XG− mG)
T
(XG− mG)
=
1
N
G
T
(X − m)
T
(X − m)G = G
T
SG (5)
Similarly we get :
e
S
w
= G
T
S
w
G and
e
S
b
= G
T
S
b
G (6)
Then
e
W
T
e
S
b
e
W =
e
W
T
G
T
S
b
G
e
W = W
T
S
b
W
with W = G
e
W. The new LDA objective function can
be rewritten as follows:
J(
e
W) =
det(
e
W
T
e
S
b
e
W)
det(
e
W
T
e
S
w
e
W)
=
det(W
T
S
b
W)
det(W
T
S
w
W)
. (7)
The optimal projection matrix
e
W (for simplicity we
do not use
e
W
∗
for the optimal value) is formed by the
largest eigenvalues of
e
S
−1
w
e
S
b
.
Then the obtained projection matrix
e
W should be
a good approximation of W as far as
e
X is a good ap-
proximation of X.
4 EXPERIMENTAL RESULTS
In this section, the performancesof the proposed algo-
rithm appSVD+LDA are given. The experiments are
based on real data sets including face recognition and
text classification which can be download at http://
www.cad.zju.edu.cn/home/dengcai/Data/data.html.
All the experiments have been performed on P4
2.7GHz Windows7 machine with 16GB memory. We
have used Matlab routine for programming.
4.1 Data Sets
Two images data sets ORL, COIL20 and two texts
data sets TDT2, Reuters21578 have been used in our
experiments. The image data have been normalized
to have L2-norm equal to 1. For text data, each docu-
ment have been represented as a term-frequency vec-
tor and have been normalized to have L2-norm equal
to 1. The statistics of these data sets are listed in Ta-
ble 1.
COIL20. This data set contains 1440 sample images
of 20 different subjects. The size of each image is
(32× 32) pixels.
ORL. This data set contains 10 different poses of 40
distinct subjects with 4096-dimension (64× 64 pix-
els). The images were taken at different times, ranged
from full right profile to full left profile.
TDT2. (Nist Topic Detection and Tracking corpus)
This subset is about 9394 documents in 30 categories
with 36771 features.
Reuters21578. These data were originally collected
and labeled by Carnegie Group, Inc. and Reuters,
Ltd. The corpus contains 8293 documents in 65 cate-
gories with 18933 distinct terms.
4.2 Experiments
For COIL20, TDT2 and Reuters21578 data sets, a
subset TN = [10%, 30%, 50%] of samples per class
Linear Discriminant Analysis based on Fast Approximate SVD
361
Table 1: Statistics of data sets and value of the chosen parameter p.
Statistics of data sets size of
data sets samples (N) dim (d) # of classes dim-Red (p)
COIL20 1440 1024 20 20
ORL 400 4096 40 50
Reuters21578 8293 18933 65 80
TDT2 9394 36771 30 80
with labels was selected at random to form the train-
ing set. For ORL data, we randomly selected TN =
[2, 4, 6] samples per class for training. The rest of
samples were used for testing.
We set the regularized parameter µ = 0.5 and k =
p for fast approximate SVD on the assumption that
K − 1 6 k 6 p ≪ d. Table 1 shows for each data set
the dimension p that we chose for the intermediate
space. Since K − 1 directions can be generated by
LDA, we finally retain K − 1 vectors of W and then
classify the transformed data in the new space of di-
mension K − 1.
In order to access the relevance of the proposed
method appSVD+LDA, we have compared its perfor-
mance with three other methods which are listed be-
low :
• Direct LDA (DLDA) (Friedman, 1989) which
solves the LDA problem in the original space.
• LDA/QR (Ye and Li, 2004) which is a variant of
LDA that needs to solve the QR decomposition of
a small size matrix.
• NovRP (Liu and Chen, 2009) which is an ap-
proach that uses sparse random projection as di-
mension reduction before performing LDA. The
parameters µ and p have been set in the same way
as our approach.
4.3 Performance
The experimental results are given from Table 2 to 9
for all data sets highlight above. In these tables the
results are averaged over 20 random splits for each
TN(%) and report the mean as well as the standard
deviation. As the running time is nearly constant we
just report the mean value.
Tables 2 and 3 show the performance results on
COIL20 data. DLDA achieves the best accuracy in
this case whereas its running time is significantly the
highest. appSVD+LDA presents a quite good accu-
racy performance and its running time is nearly 100
times smaller than that of DLDA. The running time
of NovRP is the most efficient in this case whereas
its accuracy is the lowest one. For ORL data, exper-
imental results are displayed on Tables 4 and 5. As
can be seen, appSVD+LDA presents the best accu-
racy (for 4 and 6 samples) and a low running time.
As the dimension in this case is relatively large, the
computation time for DLDA is very large (see Table
5).
Reuters21578 and TDT2 are very large data sets.
As DLDA needs memory to store the centered and
scatter matrices in the original features space, it is
infeasible to apply DLDA in these cases. Tables 6
to 9 display only the performance results for NovRP,
LDA/QR and appSVD+LDA. The NovRP method
gives the most efficient time (see Tables 7 and 9)
whereas its accuracy is by far the lowest. It can be
seen that the chosen value of p is widely sufficient
for appSVD+LDA to recover nearly 86% of accuracy
for Reuters21578 and 95% for TDT2 and the compu-
tational time is quite small (see Tables 7 and 9). In
the whole results appSVD+LDA significantly outper-
forms LDA in running time and its accuracy perfor-
mance let believe in its effectiveness and efficiency
compared to other methods.
4.4 Parameter Tunning
There are three essential parameters in the proposed
method which are µ, p and k. µ is used for the reg-
ularization process of the scatter matrix. k is the
dimension of the new feature space where LDA is
performed. p is the dimension size of the interme-
diate subspace where the original features are ran-
domly mapped. A sensitive way of the proposed
appSVD+LDA is the choice of p. This parameter
should guarantee a minimum distortion between data
points after random map. In the final dimensional
space each point is represented as a k feature vector
that leads to a faster classification process. In our ex-
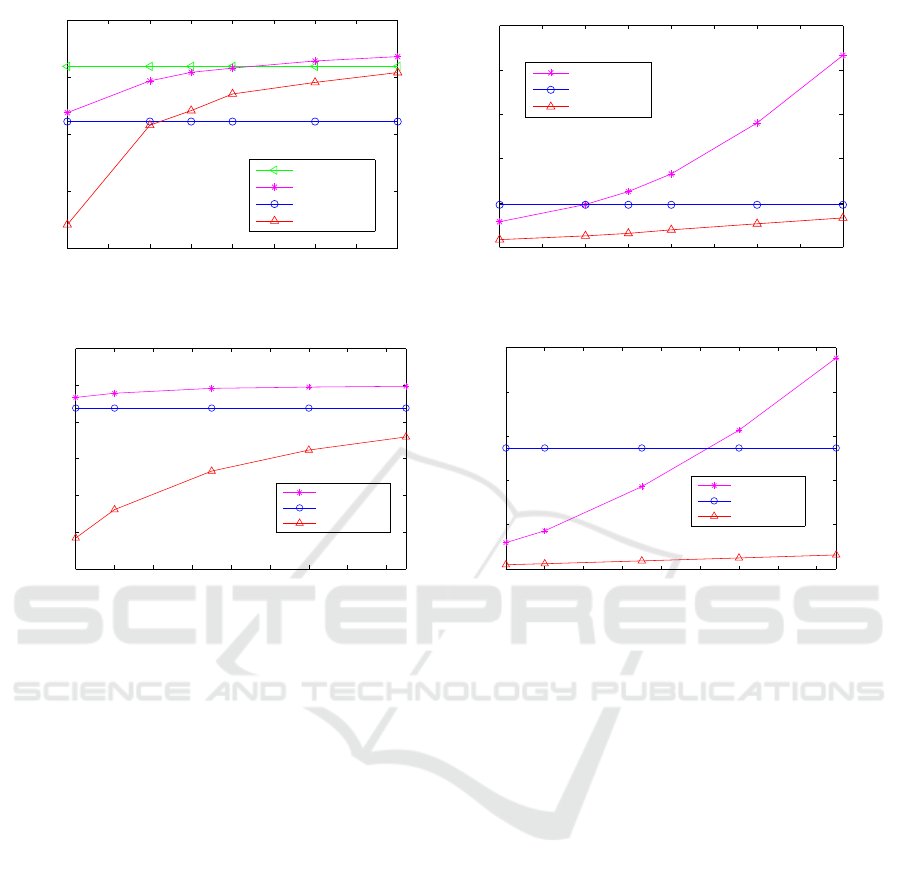
periments, we chose k = p. To illustrate the impact
of this parameter, we take various values of p. The
accuracy and the training time as a function of p av-
eraged over 20 random splits are plotted on figures
1 and 2. The methods DLDA and LDA/QR do not
depend on p contrary to appSVD+LDA and NovRP.
In figure 1 (right), as the training time of DLDA is
widely high, we have not plotted it. It can be seen that
the accuracyof the proposed method is good for small
values of p (p = 80) and it increases slowly with p
ICPRAM 2017 - 6th International Conference on Pattern Recognition Applications and Methods
362
Table 2: Accuracy on COIL20 (Mean ± Std-Dev %).
TN DLDA NovRP LDA/QR appSVD+LDA
10% 85.88± 1.78 73.05 ± 2.55 80.88±1.83 84.37 ± 2.22
30% 94.14± 1.02 79.65 ± 2.59 88.28 ± 2.45 90.43 ±0.97
50% 95.42 ± 0.89 81.42 ± 2.04 90.37± 1.84 91.89 ± 1.25
Table 3: Computational time on COIL20 (s).
TN DLDA NovRP LDA/QR appSVD+LDA
10% 2.152 0.006 0.009 0.017
30% 2.189 0.007 0.030 0.019
50% 2.242 0.008 0.050 0.022
Table 4: Accuracy on ORL (Mean ± Std-Dev %).
TN DLDA NovRP LDA/QR appSVD+LDA
2× 40 69.70±3.45 46.52± 3.07 74.50± 2.11 67.41±2.79
4× 40 84.65±2.29 75.75±2.50 85.90±2.85 89.35± 1.88
6× 40 90.12±2.50 84.81±2.93 90.69±1.49 92.94± 1.87
Table 5: Computational time on ORL (s).
TN DLDA NovRP LDA/QR appSVD+LDA
2×40 93.223 0.041 0.065 0.225
4× 40 93.340 0.042 0.104 0.228
6× 40 93.584 0.045 0.145 0.235
Table 6: Accuracy on Reuters21578 (Mean ± Std-Dev %).
TN DLDA NovRP LDA/QR appSVD+LDA
10% − 48.77±1.55 75.57±0.73 83.27±0.76
30% − 48.75±1.99 83.17± 0.62 86.72±0.58
50% − 46.81±1.81 86.52±0.44 86.53±0.55
Table 7: Computational time on Reuters21578 (s).
TN DLDA NovRP LDA/QR appSVD+LDA
10% − 0.271 3.038 1.873
30% − 0.282 10.190 2.286
50% − 0.296 19.101 2.494
Table 8: Accuracy on TDT2 (Mean ± Std-Dev %).
TN DLDA NovRP LDA/QR appSVD+LDA
10% − 58.92± 1.40 92.45± 0.70 94.07± 0.91
30% − 62.68±1.28 95.29± 0.23 95.11±0.66
50% − 63.33±1.22 95.74±0.28 95.23±0.77
Table 9: Computational time on TDT2 (s).
TN DLDA NovRP LDA/QR appSVD+LDA
10% − 0.539 4.066 3.891
30% − 0.574 11.618 4.552
50% − 0.582 18.591 4.627
while the computation time increases quickly with p.
For NovRP, the context is opposite, i.e, the accuracy
increases quickly with p whereas the time increases
slowly. For Reuters21578, the best accuracy is ob-
tained with appSVD+LDA for any value of p in the
considered range between 80 and 250.
Linear Discriminant Analysis based on Fast Approximate SVD
363
20 30 40 50 60 70 80 90 100
0.8
0.85
0.9
0.95
1
Dimension p
Accuracy
Accuracy vs Dimension p
DLDA
appSVD+LDA
LDA/QR
NovRP
20 30 40 50 60 70 80 90 100
0
0.05
0.1
0.15
0.2
0.25
Dimension p
Time (s)
Time vs Dimension p
appSVD+LDA
LDA/QR
NovRP
Figure 1: Accuracy vs Dimension p (left) and Time vs Dimension p (right) on COIL20 data set for TN=50%.
80 100 120 140 160 180 200 220 240
0.4
0.5
0.6
0.7
0.8
0.9
1
Dimension p
Accuracy
Accuracy vs Dimension p
appSVD+LDA
LDA/QR
NovRP
80 100 120 140 160 180 200 220 240
0
5
10
15
20
25
Dimension p
Time (s)
Time vs Dimension p
appSVD+LDA
LDA/QR
NovRP
Figure 2: Accuracy vs Dimension p (left) and Time vs Dimension p (right) on Reuters21578 data set for TN=30%.
5 CONCLUSION
This work provides a novel approach to tackle the
problem encountered when performing LDA with
large scale data sets. It consists of looking for an ap-
proximation of the original space in a lower rank. It
combines the fast approximate singular value decom-
position and LDA. We show by experiments on real
world data sets the effectiveness and the efficiency of
the proposed method appSVD+LDA. As can be seen,
appSVD+LDA outperforms direct LDA in terms of
computational time and achieves significant perfor-
mance in comparison to other state-of-the-art meth-
ods. appSVD+LDA allows to classify large scale data
by just holding a small features size (k). For example,
on Reuters21578 data set where the original feature
space is d = 18933, it achieves more than 86% ac-
curacy in nearly two seconds whereas it is infeasible
to perform direct LDA in this case. The performance
results displayed by appSVD+LDA are very encour-
aging for learning LDA both in small and high dimen-
sional spaces.
ACKNOWLEDGEMENTS
This work is supported by the region of Cham-
pagne Ardenne, France for APERUL project (Ma-
chine Learning).
REFERENCES
Achlioptas, D. (2003). Database-friendly random projec-
tions: Johnson-lindenstrauss with binary coins. Jour-
nal of computer and System Sciences, 66(4):671–687.
Boutsidis, C., Zouzias, A., Mahoney, M. W., and Drineas,
P. (2015). Randomized dimensionality reduction for-
means clustering. IEEE Transactions on Information
Theory, 61(2):1045–1062.
Cardoso, Â. and Wichert, A. (2012). Iterative random pro-
jections for high-dimensional data clustering. Pattern
Recognition Letters, 33(13):1749–1755.
Chen, L., Man, H., and Nefian, A. V. (2005). Face recog-
nition based on multi-class mapping of fisher scores.
Pattern Recognition, 38(6):799–811.
Duda, R. O., Hart, P. E., and Stork, D. G. (2012). Pattern
classification. John Wiley & Sons.
ICPRAM 2017 - 6th International Conference on Pattern Recognition Applications and Methods
364

Friedman, J. H. (1989). Regularized discriminant analy-
sis. Journal of the American statistical association,
84(405):165–175.
Hastie, T., Tibshirani, R., and Friedman, J. (2001). The
Elements of Statistical Learning. Springer Series in
Statistics. Springer New York Inc., New York, NY,
USA.
Lee, Y. K., Lee, E. R., and Park, B. U. (2012). Principal
component analysis in very high-dimensional spaces.
Statistica Sinica, pages 933–956.
Liu, H. and Chen, W.-S. (2009). A novel random pro-
jection model for linear discriminant analysis based
face recognition. In 2009 International Conference
on Wavelet Analysis and Pattern Recognition, pages
112–117. IEEE.
Menon, A. K. and Elkan, C. (2011). Fast algorithms
for approximating the singular value decomposition.
ACM Transactions on Knowledge Discovery from
Data (TKDD), 5(2):13.
Moulin, C., Largeron, C., Ducottet, C., Géry, M., and Barat,
C. (2014). Fisher linear discriminant analysis for
text-image combination in multimedia information re-
trieval. Pattern Recognition, 47(1):260–269.
Welling, M. (2005). Fisher linear discriminant analysis. De-
partment of Computer Science, University of Toronto,
3:1–4.
Ye, J. and Li, Q. (2004). Lda/qr: an efficient and effec-
tive dimension reduction algorithm and its theoretical
foundation. Pattern recognition, 37(4):851–854.
Ye, J., Li, Q., Xiong, H., Park, H., Janardan, R., and Kumar,
V. (2005). Idr/qr: an incremental dimension reduction
algorithm via qr decomposition. IEEE Transactions
on Knowledge and Data Engineering, 17(9):1208–
1222.
Yu, H. and Yang, J. (2001). A direct lda algorithm for high-
dimensional data with application to face recognition.
Pattern recognition, 34(10):2067–2070.
Linear Discriminant Analysis based on Fast Approximate SVD
365
