
Technological Approach for Behavior Change Detection toward Better
Adaptation of Services for Elderly People
Firas Kaddachi
1
, Hamdi Aloulou
1
, Bessam Abdulrazak
1,2
, Joaquim Bellmunt
3
, Romain Endelin
1
,
Mounir Mokhtari
3,4
and Philippe Fraisse
1
1
Montpellier Laboratory of Informatics, Robotics and Microelectronics (LIRMM), Montpellier, France
2
University of Sherbrooke, Sherbrooke, Canada
3
Image and Pervasive Access Lab (IPAL), Singapore, Singapore
4
Institut Mines-Telecom (IMT), Paris, France
Keywords:
Behavior, Behavior Change Detection, Elderly People, Sensors.
Abstract:
Aging process is associated with behavior change and continuous decline in physical and cognitive abilities.
Therefore, early detection of behavior change is major enabler for providing adapted services to elderly people.
Today, different psychogeriatric methods target behavior change detection. However, these methods require
presence of caregivers and manual analysis. In this paper, we present our technological approach for early be-
havior change detection. It consists in monitoring and analyzing individual activities using pervasive sensors,
as well as detecting possible changes in early stages of their evolution. We also present a first validation of the
approach with real data from nursing home deployment.
1 INTRODUCTION
Early detection of behavior change is keystone for ser-
vice providers to better adapt their services for elderly
people. Existing psychogeriatric methods for behav-
ior change detection are inconvenient, as they are
time-consuming and require manual analysis work
from caregivers.
According to existing definitions (Cao, 2010), be-
havior change is defined as any continuous modifica-
tion or transformation in way and manner of behav-
ior execution. Behavior change characterizes possi-
ble instabilities, variations, impairments, declines, in-
creases or improvements in behavior performance.
Behavior change has significant impact on quality
of life. For example, emergence of orientation prob-
lems (Cockrell and Folstein, 2002), eating difficulties
(Vellas et al., 1999) and mood impairments (Parmelee
and Katz, 1990) leads to serious decline in quality of
life. On the other hand, any improvement in manag-
ing personal finances (Barberger-Gateau et al., 1992),
managing household (Lafont et al., 1999) and mobil-
ity (Mathias et al., 1986) has positive influence on
quality of life.
Early detection of behavior change is major en-
abler for more efficient intervention, by taking neces-
sary actions in early stages of behavior change. Au-
tonomy of elderly people is consequently improved,
by reducing symptoms and evolution of sensor, motor
and cognitive diseases.
In this paper, we propose a technological approach
for behavior change detection. Changes are detected
at temporal scale; i.e., compared to past habits of one
particular person.
Our employed technologies (e.g., movement and
contact sensors) do not interfere with monitored be-
havior. These technologies are ubiquitous. They dis-
appear in the environment, without generating un-
wanted behavior change, and without affecting indi-
vidual privacy.
Our approach conducts long-term analysis of be-
havior for detection of continuous changes. We do not
study snapshots of behavior, but we analyze overall
behavior over long periods. This enables to differen-
tiate between transient and continuous deviations.
Following, section 2 discusses state of the art of
behavior definitions and change detection methods.
Sections 3 and 4 present our methodology for be-
havior change detection and our implementation ap-
proach. Section 5 introduces a first validation of the
proposed approach through real results from nursing
home deployment. Section 6 concludes this paper.
96
Kaddachi F., Aloulou H., Abdulrazak B., Bellmunt J., Endelin R., Mokhtari M. and Fraisse P.
Technological Approach for Behavior Change Detection toward Better Adaptation of Services for Elderly People.
DOI: 10.5220/0006145100960105
In Proceedings of the 10th International Joint Conference on Biomedical Engineering Systems and Technologies (BIOSTEC 2017), pages 96-105
ISBN: 978-989-758-213-4
Copyright
c
2017 by SCITEPRESS – Science and Technology Publications, Lda. All rights reserved

2 RELATED WORK
Researchers study behavior change from two different
perspectives: initiation and maintenance of behavior
change, and detection of behavior change.
2.1 Behavior Definitions
Cao defines behavior as actions or reactions made by
individuals (Cao, 2010). Behavior is a response to
internal or external stimuli or inputs.
From sociological point of view, Wilson consid-
ers behavior as interactions between individuals (Wil-
son, 2000). It can be influenced by family structure,
work or school environment relationships, health con-
ditions and psychiatric issues.
Economists recognize behavior as processes con-
sumers go through or reactions they have toward pur-
chasing or consuming products or services (Perner,
2008; Szwacka-Mokrzycka, 2015). It is influenced by
internal factors, such as attitudes, needs, motives and
preferences. External factors have also significant in-
fluence, such as marketing activities, social, econom-
ical and cultural aspects.
In the medical field, behavior refers to persons’
beliefs and actions regarding their health (Miller et al.,
2007; Lavikainen et al., 2009). While positive behav-
iors promote healthy life (e.g, maintain moderate al-
cohol intake, not smoke and avoid snacks), negative
behaviors present health risks.
These definitions consider behavior as a response
to internal or external factors, such as intentions,
desires, social interactions and marketing activities.
However, individuals respond differently to these fac-
tors; e.g., being hungry stimulates individuals to pre-
pare meals with different duration, frequency and dif-
ficulty. Therefore, we define behavior as the way and
manner individuals perform actions, inactions and be-
liefs.
2.2 Behavior Change Initiation and
Maintenance Models
Numerous models have been proposed to predict
the amount of effort individuals require for behavior
change initiation and maintenance (Ormrod, 2013).
In fact, initiating and maintaining behavior changes
are related to individuals’ perception of their own
ability to perform demanding or challenging tasks.
This perception is influenced by individuals’ prior
success in those tasks or related tasks, their psycho-
logical state and outside sources of persuasion.
In the medical field, behavior change refers
to abandoning health-compromising behaviors and
maintaining health-improving behaviors. Rosenstock
suggests that individuals’ belief about health prob-
lems and perceived benefits of actions plays important
role in adopting health-promoting behaviors (Rosen-
stock, 1974).
Schwarzer considers behavior change as two con-
tinuous processes: goal setting and goal pursuit
(Schwarzer, 2008). While goal setting is related to
factors that motivate behavior change, goal pursuit
consists in planning and performing intended change.
Prochaska et al. propose a five-step model of
behavior change (Prochaska and DiClemente, 2005).
In the first step, individuals have not thought about
changing their behaviors. Then, individuals begin
thinking about changing particular behaviors. After-
wards, they prepare their plans for behavior change.
In the fourth step, individuals adopt and perform new
behaviors. Finally, they consistently conserve their
new behaviors.
While these models target behavior change initi-
ation and maintenance, detection of behavior change
enables better fulfillment of both objectives. In deed,
methods for behavior change detection allow to make
better decisions of when to initiate new behavior
changes, and which services to select for behavior
change initiation and maintenance.
2.3 Behavior Change Detection
Methods
In the literature, we distinguish psychogeriatric and
technological methods for behavior change detection.
While psychogeriatric methods use formal tests and
questionnaires, technological solutions are developed
to automate detection of anomalies.
2.3.1 Psychogeriatric Methods
Psychologists and geriatricians propose several inter-
nationally validated methods for behavior change de-
tection (Table 1). Using formal scales and question-
naires, trained clinicians and caregivers request that
seniors reply to specific questions and perform spe-
cific tasks, such as ”How many falls did you have in
the last six months?” (Tardieu et al., 2016) and ”Could
you please get up and walk three meters away!”
(Mathias et al., 1986).
Following, we present the psychogeriatric tests of
Table 1:
• Short Emergency Geriatric Assessment
(SEGA) allows to evaluate frailty of elderly
people (Tardieu et al., 2016). It considers mul-
tiple behavior changes, such as falls, nutrition
Technological Approach for Behavior Change Detection toward Better Adaptation of Services for Elderly People
97

Table 1: Examples of Psychogeriatric Tests for Behavior Change Detection.
SEGA MMSE 4Tests GDS IADL AGGIR GetUp MNA BEHA NPI
AndGo VEAD
ADL X X X X X
Mobility X X X
Cognition X X X X X X X X
Social Life X X X X X X
Nutritional Status X X X
Biological Status X X X X
Mood and Emotions X X X X
problems, mobility impairments and memory
troubles.
• Mini Mental State Examination (MMSE) tar-
gets detection of changes in cognitive abilities,
such as orientation problems, attention difficul-
ties and language troubles (Cockrell and Folstein,
2002).
• Benton, Five Word, Clock and Verbal Fluency
Tests (4Tests) target changes in cognitive func-
tions, such as learning problems, memory troubles
and construction difficulties (Neuropsy, 2016).
• Geriatric Depression Scale (GDS) investigates
changes in mood and emotions (Parmelee and
Katz, 1990); e.g., feeling sad and that one’s life
is empty is associated with possible depression.
• Instrumental Activities of Daily Living (IADL)
identifies changes in activities of daily living that
are associated with autonomy loss, such as us-
ing telephone, using means of transport, tak-
ing medicines and managing personal finances
(Barberger-Gateau et al., 1992).
• Autonomie Gerontologique et Groupes Iso-
Ressources (AGGIR) investigates changes in
autonomy of seniors, such as movement trou-
bles, household difficulties and orientation im-
pairments (Lafont et al., 1999).
• Get-Up and Go targets motor behavior changes
(Mathias et al., 1986). This test asks elderly peo-
ple to get up, walk and turn around, in order to
analyze task execution and identify possible mo-
bility impairments.
• Mini Nutritional Assessment (MNA) investi-
gates changes in nutritional status, such as eating
difficulties, weight loss and protein intake insuffi-
ciency (Vellas et al., 1999).
• Behavioral Pathology in Alzheimers Disease
(BEHAVE-AD) and Neuropsychiatric Inven-
tory (NPI) allow to detect possible behavioral im-
pairments for elderly people, such as presence of
hallucinations, aggressiveness and anxiety (Reis-
berg et al., 1997) (Cummings et al., 1994).
Using these tests, clinicians observe task execu-
tion and analyze senior behavior, in order to iden-
tify cognitive impairments, autonomy problems, rapid
mood changes, nutritional and behavioral anomalies.
Certain inconveniences limit the efficiency of psy-
chogeriatric tests. In fact, it is inconvenient for se-
niors to recall past events with full details at assess-
ment time. It is also often not convenient for elderly
people to move to assessment place.
Besides, requesting that individuals reply to given
questions and perform determined tasks has potential
negative impact on their future behaviors after assess-
ment. For example, anxiety of seniors can increase
in case they feel their inability to correctly reply to
orientation questions or perform mobility tasks. Fur-
thermore, subjective evaluation of assessment results
cause possible assessment inaccuracies.
2.3.2 Technological Methods
Different technological methods target behavior
change detection. They employ technologies de-
ployed in the environment (e.g., movement sensors,
bed sensors, cameras and microphones) or worn by
seniors (e.g., smart phone, smart watch and neurosen-
sors). These methods conduct advanced analysis of
acquired data, in order to detect changes in monitored
behaviors.
Allin et al. propose technological method for so-
cial behavior change detection (Allin et al., 2003).
This method detects emergence of physically and ver-
bally aggressive interactions. It employs cameras and
microphones for continuous collection of video and
audio recordings. Using hidden markov models, com-
plex analysis of these recordings allows to build typ-
ical movement patterns for anomaly detection. How-
ever, employed cameras and microphones affect pri-
vacy of individuals.
Avvenuti et al. target detection of wandering and
falls from bed during sleep (Avvenuti et al., 2010).
HEALTHINF 2017 - 10th International Conference on Health Informatics
98

They study correlation between brain activity and
body movement, in order to define rules and derive
threshold values for anomaly detection. This method
employs modern neurosensors placed on person’s
scalp to record brain activities. Yet, neurosensors
limit individual movements indoors and outdoors.
Another technological method studies mental
state changes that lead to possible depression (Mag-
ill and Blum, 2012). It provides objective feedback
to patients using body and environmental sensors, in
addition to subjective questionnaire-based records for
their health. Content and timing of questionnaires are
personalized for individuals and altered over time as
individual’s mental health changes. However, it has
been reported that technical trial of developed system
reveals acceptability issues from participants regard-
ing questionnaires.
Kaye et al. investigate changes in computer use
(Kaye et al., 2014). Based on statistical analysis of
mouse events, they compare frequency and duration
of computer use between two aging populations with
or without mild cognitive impairments (MCI). They
conclude that MCI patients use computers less than
regular persons.
Hayes et al. target detection of medication ad-
herence changes (Hayes et al., 2009). Using elec-
tronic pillbox, subjects take medicines twice per day
at specific times. This method monitors number of
days when subjects take both medicines, and verifies
whether volunteers adhere to given times. It compares
two senior groups with low or high performance in
given cognitive tests, and concludes that lower per-
forming group has risk of non-adherence.
Another technological study investigates motor
behavior changes (Hayes et al., 2008). Careful in-
series placement of wireless infrared sensors at home
identifies how quickly and frequently seniors pass
through sensor lines per day. Comparing two aging
populations with or without MCI, MCI patients show
a coefficient of variation in median walking speed as
twice as high compared to regular subjects.
Petersen et al. propose further solution to detect
changes in telephone use (Petersen et al., 2014). Em-
ployed land-line phone monitors record phone events,
such as dialed numbers and ring rate. These record-
ings allow to have a picture on size and contact fre-
quency of friend, family and acquaintance network.
Results show that seniors with high cognitive abilities
receive significantly more phone calls.
These last four studies detect behavior changes be-
tween different individuals. However, they do not tar-
get detection of behavior changes that affect one par-
ticular individual.
3 BEHAVIOR CHANGE
DETECTION METHODOLOGY
We target behavior change detection at temporal
scale. Over long periods, we analyze behavior of el-
derly people, in order to identify changes compared
to past habits. Our technologies do not interfere with
monitored behavior and do not affect individual pri-
vacy.
Our behavior analysis identifies indicators of be-
havior change, such as activities of daily living, mo-
bility and social life (Figure 1). These indicators
are associated with changes in physical and cognitive
abilities of elderly people.
Activities of Daily Living
(Prepare Meals)
Nutritional Status (Eating) Mood and Emotions
Health and Biological Status
(Take Medicines)
Social Life (Shopping)
Mobility (Get Up)
Cognition (Learn)
Figure 1: Examples of Behavior Change Indicators.
We also analyze these indicators considering dif-
ferent dimensions, such as quantity, duration, time
and location. These dimensions are metrics that quan-
tify collected data and allow to apply algorithms on
these data for change detection.
Furthermore, we correlate identified changes with
global context, such as weather conditions, family sta-
tus and house architecture. Considering these factors
provides better understanding of detected changes;
e.g., senior stays at home for seven days due to heavy
snow and not due to eventual social isolation.
3.1 Behavior Change Indicators
We have considered different validated psychogeri-
atric scales (e.g., SEGA, AGGIR, MNA and NPI)
to identify indicators of behavior change. That can
be captured via ambient technologies (Table 2). An-
alyzing these indicators allows to detect significant
changes in physical and cognitive abilities. Figure 1
shows following examples of indicators:
Technological Approach for Behavior Change Detection toward Better Adaptation of Services for Elderly People
99

• Activities of Daily Living are essential complex
tasks of daily living that demand important physi-
cal and cognitive capacities, such as performing
household, preparing meals, dressing, hygiene,
and urinary and fecal elimination.
• Mobility refers to motor behaviors, such as mov-
ing indoors and outdoors, getting up, turning
around and walking.
• Cognition includes essential cognitive tasks such
as learning, language and managing financial sit-
uation. These complex tasks are associated with
temporal orientation, spatial orientation, atten-
tion, calculation and construction.
• Social Life refers to social behaviors, such as
communicating with others, using means of trans-
port, shopping and participating in collective free
time activities.
• Nutritional Status is related to serving oneself
and eating.
• Health and Biological Status targets health be-
haviors that indicate vision, audition and vital
sign impairments, such as irregularities in taking
medicines and increased hospitalization number.
• Mood and Emotions correlate with physical and
cognitive functions and are significant depression
and stress indicators.
Table 2: Examples of Ambient Technologies for Behavior
Change Indicator Monitoring.
Environment Technologies
Indoor Movement, contact, proximity,
vibration and pressure sensors
Outdoor Smart phone and smart watch
with beacons
3.2 Metrics
We analyze selected behavior change indicators re-
garding different dimensions. These dimensions are
metrics that quantify way and manner of performing
these indicators, and allow to apply algorithms on col-
lected data for change detection. Following, we dis-
cuss four significant metrics:
• Quantity refers to number and amount of behav-
ior execution; e.g., number of friend visits de-
creases due to social isolation, number of move-
ments decreases due to walk impairments, number
of sport center visits increases thanks to raised in-
terest in physical exercise and number of hospital-
izations decreases thanks to health status improve-
ment.
• Duration is related to length of behavior execu-
tion; e.g., duration of preparing meals increases
due to cognitive impairments, duration of stair
climbing increases due to walk impairments, time
spent out of home increases thanks to raised in-
terest in social interactions and time spent in free
time activities considerably increases thanks to
raised interest in active aging.
• Time refers to start and end times of behavior
execution; e.g., sleep hours are irregular due to
sleep troubles, eating meal hours are inappropri-
ate due to nutritional problems, going out hours
are changing thanks to raised interest in social
activities and taking medicine hours are adhered
thanks to cognitive status improvement.
• Place describes where behavior is executed; e.g.,
detected falls outdoors become more frequent due
to fear of going outside, visiting senior activ-
ity center becomes less usual due to social isola-
tion and visiting city park becomes more frequent
thanks to raised interest in physical exercise.
3.3 Global Context
Analyzing behavior in correlation with global con-
text enables better understanding of behavior change.
Following, we discuss influence of general personal
information, general context information and specific
temporary information on behavior change.
General personal information are general descrip-
tors of persons; e.g., age over 85, health care his-
tory including more than three physical and mental
diseases, and inconvenient family status increase the
probability of behavior changes (Tardieu et al., 2016).
General context information describe the envi-
ronment of behavior execution; e.g., changing one’s
house affects activities of daily living, moving televi-
sion in room not easily accessible by elderly people
reduces watching television frequency, opening smart
city subways adapted for elderly people has positive
influence on outdoor activities and building senior ac-
tivity centers raises interest in social interactions.
Specific temporary information refer to short-term
events, such as several consecutive days of heavy
snow that obligate senior to stay at home, recent hos-
pitalization of husband that raises wife’s anxiety, and
recent friend visits that improve emotional state.
HEALTHINF 2017 - 10th International Conference on Health Informatics
100

4 IMPLEMENTATION
APPROACH
We perform a first implementation of our behavior
change detection methodology in our ambient as-
sisted living platform UbiSMART (Aloulou, 2013;
Aloulou et al., 2013). This platform uses environ-
mental sensor data for activity recognition, detection
of abnormal activity change and provision of person-
alized services for elderly people (Figure 2).
HOME
UbiSMART
Deployed Sensors at Home
Database
Data
Analysis
Change
Detection
Sensor Data
Services for
Elderly People
Figure 2: Overview on our Ambient Assisted Living Plat-
form.
Our implementation approach considers following
stages:
• Deployment consists in installing our hardware
infrastructure. This includes environmental sen-
sors (e.g., movement and contact sensors), gate-
ways, receivers and internet access points.
• Data Acquisition is essential to build our data-
base. Via internet, data are transmitted to our ded-
icated server for permanent storage.
• Data Pre-processing allows to discard inaccurate
and erroneous data for better analysis quality.
• Data Analysis quantifies data by considering dif-
ferent metrics, such as daily number and duration
of shopping activity. Afterwards, we apply algo-
rithms on these data to detect possible changes at
temporal scale; e.g., these algorithms identify de-
crease in shopping activity periods.
4.1 Algorithms
We select statistical algorithms for our data analysis,
as they differentiate between transient and continuous
deviations; e.g., these statistical algorithms ignore oc-
casional decreases in going out frequency, and con-
sider only continuous decreases as significant changes
in going out frequency.
We can distinguish offline and online algorithms
for change detection in the literature (Basseville et al.,
1993; Liu et al., 2013). Offline algorithms require
fully available data as input, such as full history of
free time activity number and duration. However, on-
line algorithms iteratively operate on data one by one,
such as number and duration of free time activity day
by day.
Existing online algorithms use probabilistic mod-
els (Takeuchi and Yamanishi, 2006), singular spec-
trum analysis (Moskvina and Zhigljavsky, 2003) and
cumulative sum control charts (Mesnil and Petitgas,
2009). Existing offline algorithms apply relative
density-ratio estimation (Liu et al., 2013) and cumula-
tive sum control charts with binary segmentation (An-
dersson, 2014; Cho, 2015) or bootstrapping (Taylor,
2000).
In order to detect changes as early as possible, we
select online algorithms. Following, we discuss two
algorithms investigated in our research; i.e., cusum-
based (Page, 1954) and window-based (Bland and
Altman, 1995) algorithms. These algorithms apply
different filters on detected deviations and identify
changes with different granularity.
4.1.1 CUSUM-based Algorithm
Page proposes Cumulative Sum Control Chart
(CUSUM) algorithm for change detection in time
series (Page, 1954). This algorithm considers two
phases: reference phase and analysis phase.
In reference phase, initial data allow to compute
parameters that will condition change detection:
• M refers to mean of reference data.
• SD is standard deviation of reference data.
• SHIFT is related to shift of interest, that de-
termines smallest deviation we target to detect.
Ledolter et al. set SHIFT to 1x SD (Ledolter and
Kardon, 2013).
• K refers to allowance parameter, that is related to
shift of interest. Mesnil et al. set K to 0,5x SHIFT
(Mesnil and Petitgas, 2009).
• H is decision parameter that determines whether
change occurs or not. In the literature, researchers
define H with published tables, specific software
or set it to 5x SD (Mesnil and Petitgas, 2009; Kib-
ria, 2016).
In the analysis phase, mean and standard devia-
tion parameters allow to standardize data by applying
formula 1:
data[i] = (data[i] − M)/SD (1)
For each datum, cumulative sums recursively ac-
cumulate positive and negative deviations, using for-
mula 2 and 3:
Technological Approach for Behavior Change Detection toward Better Adaptation of Services for Elderly People
101

S
HIGH
[i] = max(0, S
HIGH
[i − 1] + data[i] − K) (2)
S
LOW
[i] = min(0,S
LOW
[i − 1] + data[i] + K) (3)
In case S
HIGH
is higher then +H or S
LOW
is lower
than -H, positive or negative change occurs.
4.1.2 Window-based Algorithm
Based on Bland-Altman analysis, window-based al-
gorithm applies moving window on input data to dis-
tinguish between transient deviations and continuous
change (Bland and Altman, 1995). Only in case
selected number of deviations are consecutively de-
tected without interruption, change occurs.
Positive or negative deviations are data values that
are higher or lower than M ± SD, where M and SD
correspond respectively to mean and standard devi-
ation of all previously observed data including cur-
rently observed datum.
Window length (N) depends on analyzed behav-
ior; e.g., seven consecutive days of staying at home
correspond to change in going out frequency or three
consecutive months of loosing weight indicate change
in nutritional status. Positive or negative changes are
detected in case N consecutive positive or negative de-
viations occur.
5 VALIDATION
Following, we present a first validation of our ap-
proach through real data from nursing home deploy-
ment. Considering mobility as indicator of behavior
change, collected data allow to analyze movements of
patients inside their individual rooms.
5.1 Data Collection
Table 3: Patient Gender, Age and Monitoring Period.
Patient Gender Age Period(months)
A M 90 6
B M 89 5
C M 81 2
D F 84 11
E F 95 2
F F 85 13
G F 87 13
H F 92 9
I F 92 4
Over one year, we deploy movement sensors in
bedrooms and bathrooms of 9 patients in a french
nursing home in Occagnes (Table 3). Average age of
patients is 88 years.
5.2 Data Analysis
We use movement sensor data to analyze physical ac-
tivity periods (PAP) of persons. We simply define a
PAP as period of consecutive movements, that are de-
tected with time difference less than 3 minutes.
We do not consider days of inactivity, that cor-
respond to hospitalizations or holidays outside indi-
vidual rooms. In our analysis, we quantify collected
movement sensor data using following metrics:
• Number refers to quantity of detected movements
and PAPs.
• Duration is total length of detected PAPs.
• Intensity measures mean number of detected
movements per PAP. This corresponds to number
of detected movements divided by number of de-
tected PAPs.
5.3 Results
Figure 3 shows our analysis results for patient F over
13 months. For each month, we compute average of
daily number of movements, PAPs, their duration and
intensity. We also study influence of mean ambient
temperature on physical activities.
We observe decrease in movement and PAP num-
ber in case ambient temperature increases. However,
PAP duration grows and PAP intensity is quite stable.
This is also observed for other patients. Higher tem-
perature stimulate them to perform less activities with
longer total duration inside individual rooms.
For early change detection, we apply cusum-based
and window-based algorithms on collected data after
each day. In order to validate their results, we also
apply an offline algorithm on full months of data.
In the literature, offline algorithms provide more
robust results than online algorithms, as they retro-
spectively analyze longer periods of data (Basseville
et al., 1993; Liu et al., 2013).
We select offline algorithm of Change Point Ana-
lyzer (CPA) tool (Taylor, 2000). This algorithm im-
plements an iterative combination of cumulative sum
control charts and bootstrapping to detect changes.
Table 4 shows dates and values of identified changes
in movement number data of patient F.
Results of cusum-based and window-based algo-
rithms are compared to those obtained with CPA tool
in Figure 4, considering true positive rate (TPR), pre-
cision (P), true negative rate (TNR) and accuracy (A).
Cusum-based and window-based (N=5 and N=4)
algorithms show true positive rate of 28%, 40% and
45% respectively, as they do not detect all changes.
Their precision is 64%, 56% and 33% respectively,
HEALTHINF 2017 - 10th International Conference on Health Informatics
102
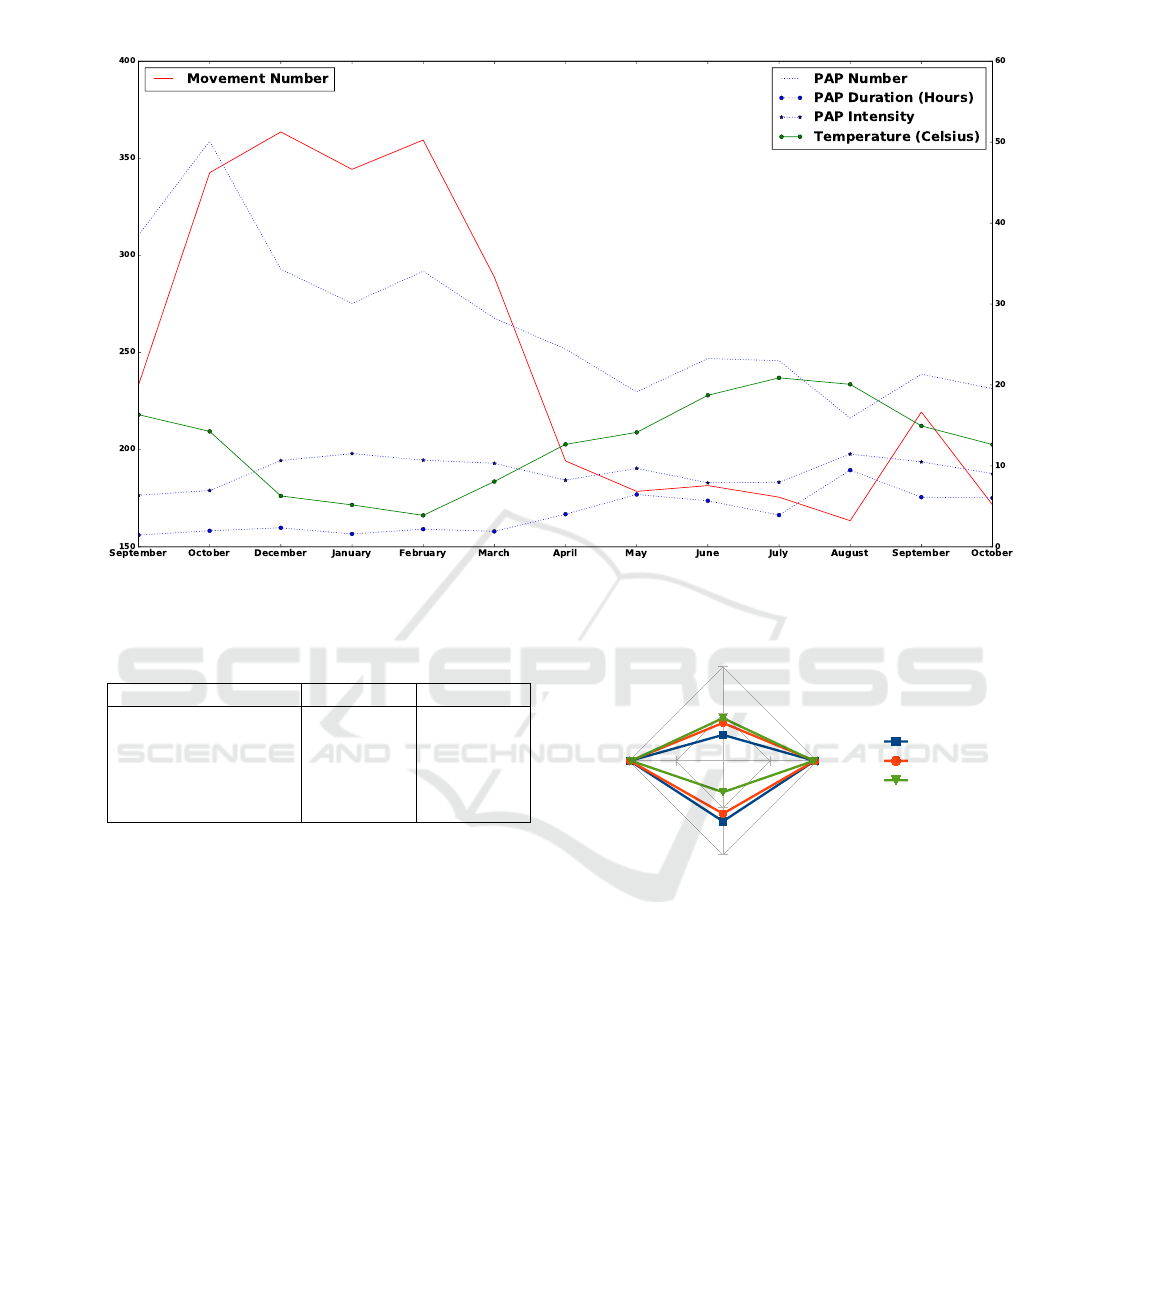
Figure 3: Monthly Average of Movement Number, PAP Number, Duration and Intensity for Patient F.
Table 4: Change Dates and Values of Movement Number
for Patient F.
Change Date From To
2014, October 3 239 354
2015, March 15 354 253
2015, April 3 253 180
2015, September 13 180 282
2015, September 18 282 176
which indicates that not all identified changes are rel-
evant.
However, true negative rate is 99%, 99% and 98%
respectively, as they correctly identify almost all nor-
mal data. Their accuracy is 97%, 98% and 97% re-
spectively, which corresponds to good overall results.
6 CONCLUSION
We propose a technological approach for behavior
change detection at temporal scale. We analyze over-
all behavior to identify changes compared to past
habits over long periods. Our technologies disappear
in the environment, in order to avoid generation of
unwanted changes and protect individual privacy.
We also present a first validation of our methodol-
ogy through real data from nursing home deployment.
Over months, employed movement sensors allow to
TPR
TNR
P
A0%
50%
100%
Cusum
Window (N=5)
Window (N=4)
Figure 4: Comparison of Cusum-based and Window-based
Algorithms to CPA Tool.
monitor physical activities of patients. Collected data
are quantified considering different metrics, such as
number and duration. Our selected statistical change
detection algorithms provide good overall results.
We are working on improving our behavior
change detection in the context of the European
project City4Age (City4Age, 2016). The City4Age
project target using data generated by technologies
deployed in urban areas, in order to provide new
adaptable services for elderly people. These services
target capturing frailty of elderly people, and provi-
sioning subsequent individualized interventions.
Further technologies are investigated for more di-
versified analysis of behavior; e.g., bed sensors can be
Technological Approach for Behavior Change Detection toward Better Adaptation of Services for Elderly People
103

used for sleep period and vital sign recognition, kinect
sensors enable more accurate monitoring of walking
activity, and beacon sensors with smart phones allow
more precise understanding of outdoor activities.
New reasoning techniques are studied to corre-
late identified statistical changes with overall changes
in behavior toward better adaptation of provided ser-
vices; e.g., decrease in weight indicates negative nu-
tritional change and triggers sending of personalized
notifications to improve nutritional status.
ACKNOWLEDGEMENT
We give our special thanks to Saint Vincent de Paul
nursing home in Occagnes, France. Our deployment
in this nursing home is also supported by VHP in-
ter@ctive project and the Quality Of Life chair.
Our work is part of the European project City4Age
that received funding from the Horizon 2020 research
and innovation program under grant agreement num-
ber 689731.
REFERENCES
Allin, S., Bharucha, A., Zimmerman, J., Wilson, D., Robin-
son, M., Stevens, S., Wactlar, H., and Atkeson, C.
(2003). Toward the automatic assessment of behav-
ioral distrubances of dementia.
Aloulou, H. (2013). Framework for ambient assistive liv-
ing: handling dynamism and uncertainty in real time
semantic services provisioning. PhD thesis, Evry, In-
stitut national des t
´
el
´
ecommunications.
Aloulou, H., Mokhtari, M., Tiberghien, T., Biswas, J., Phua,
C., Lin, J. H. K., and Yap, P. (2013). Deployment of
assistive living technology in a nursing home environ-
ment: methods and lessons learned. BMC medical
informatics and decision making, 13(1):1.
Andersson, J. (2014). Locating multiple change-points us-
ing a combination of methods.
Avvenuti, M., Baker, C., Light, J., Tulpan, D., and Vec-
chio, A. (2010). Non-intrusive patient monitoring of
alzheimers disease subjects using wireless sensor net-
works. In 2009 World Congress on Privacy, Security,
Trust and the Management of e-Business.
Barberger-Gateau, P., Commenges, D., Gagnon, M., Leten-
neur, L., Sauvel, C., and Dartigues, J.-F. (1992). In-
strumental activities of daily living as a screening
tool for cognitive impairment and dementia in elderly
community dwellers. Journal of the American Geri-
atrics Society, 40(11):1129–1134.
Basseville, M., Nikiforov, I. V., et al. (1993). Detection of
abrupt changes: theory and application, volume 104.
Prentice Hall Englewood Cliffs.
Bland, J. M. and Altman, D. G. (1995). Comparing
methods of measurement: why plotting difference
against standard method is misleading. The lancet,
346(8982):1085–1087.
Cao, L. (2010). In-depth behavior understanding and use:
the behavior informatics approach. Information Sci-
ences, 180(17):3067–3085.
Cho, H. (2015). Change-point detection in panel data via
double cusum statistic.
City4Age (2016). Elderly-friendly city services
for active and healthy aging. available as
http://www.city4ageproject.eu/.
Cockrell, J. R. and Folstein, M. F. (2002). Mini-mental state
examination. Principles and practice of geriatric psy-
chiatry, pages 140–141.
Cummings, J. L., Mega, M., Gray, K., Rosenberg-
Thompson, S., Carusi, D. A., and Gornbein, J. (1994).
The neuropsychiatric inventory comprehensive as-
sessment of psychopathology in dementia. Neurology,
44(12):2308–2308.
Hayes, T. L., Abendroth, F., Adami, A., Pavel, M., Zitzel-
berger, T. A., and Kaye, J. A. (2008). Unobtru-
sive assessment of activity patterns associated with
mild cognitive impairment. Alzheimer’s & Dementia,
4(6):395–405.
Hayes, T. L., Larimer, N., Adami, A., and Kaye, J. A.
(2009). Medication adherence in healthy elders: small
cognitive changes make a big difference. Journal of
aging and health.
Kaye, J., Mattek, N., Dodge, H. H., Campbell, I., Hayes,
T., Austin, D., Hatt, W., Wild, K., Jimison, H., and
Pavel, M. (2014). Unobtrusive measurement of daily
computer use to detect mild cognitive impairment.
Alzheimer’s & Dementia, 10(1):10–17.
Kibria, G. (2016). Cumulative sum and exponen-
tially weighted moving average control charts.
preprint, available as http://www2.fiu.edu/ kibriag
/Stat5666/Handout/Chapter99.pdf.
Lafont, S., Barberger-Gateau, P., Sourgen, C., and Dar-
tigues, J. (1999). Relation entre performances cog-
nitives globales et d
´
ependance
´
evalu
´
ee par la grille
aggir. Revue d’
´
epid
´
emiologie et de sant
´
e publique,
47(1):7–17.
Lavikainen, H. M., Lintonen, T., and Kosunen, E. (2009).
Sexual behavior and drinking style among teenagers:
a population-based study in finland. Health promotion
international, 24(2):108–119.
Ledolter, J. and Kardon, R. (2013). Detecting the pro-
gression of eye disease: Cusum charts for assessing
the visual field and retinal nerve fiber layer thickness.
Translational vision science & technology, 2(6):2–2.
Liu, S., Yamada, M., Collier, N., and Sugiyama, M. (2013).
Change-point detection in time-series data by relative
density-ratio estimation. Neural Networks, 43:72–83.
Magill, E. and Blum, J. M. (2012). Personalised ambi-
ent monitoring: supporting mental health at home.
Advances in home care technologies: Results of the
Match project, pages 67–85.
Mathias, S., Nayak, U., and Isaacs, B. (1986). Balance in
elderly patients: the” get-up and go” test. Archives of
physical medicine and rehabilitation, 67(6):387–389.
Mesnil, B. and Petitgas, P. (2009). Detection of changes in
HEALTHINF 2017 - 10th International Conference on Health Informatics
104

time-series of indicators using cusum control charts.
Aquatic Living Resources, 22(2):187–192.
Miller, J. W., Naimi, T. S., Brewer, R. D., and Jones, S. E.
(2007). Binge drinking and associated health risk
behaviors among high school students. Pediatrics,
119(1):76–85.
Moskvina, V. and Zhigljavsky, A. (2003). An algorithm
based on singular spectrum analysis for change-point
detection. Communications in Statistics-Simulation
and Computation, 32(2):319–352.
Neuropsy, R. (2016). Four
Tests. http://fmc31200.free.fr/MG-
liens/Neurologie/quatre tests.pdf. [Online; accessed
September-2016].
Ormrod, J. E. (2013). Educational Psychology: Pear-
son New International Edition: Developing Learners.
Pearson Higher Ed.
Page, E. (1954). Continuous inspection schemes.
Biometrika, 41(1/2):100–115.
Parmelee, P. A. and Katz, I. R. (1990). Geriatric depression
scale. Journal of the American Geriatrics Society.
Perner, L. (2008). Consumer behaviour and marketing strat-
egy.
Petersen, J., Austin, D., Yeargers, J., and Kaye, J. (2014).
Unobtrusive phone monitoring as a novel measure of
cognitive function. Alzheimer’s & Dementia: The
Journal of the Alzheimer’s Association, 10(4):P366–
P367.
Prochaska, J. O. and DiClemente, C. C. (2005). The trans-
theoretical approach. Handbook of psychotherapy in-
tegration, 2:147–171.
Reisberg, B., Auer, S. R., and Monteiro, I. M. (1997).
Behavioral pathology in alzheimer’s disease (behave-
ad) rating scale. International Psychogeriatrics,
8(S3):301–308.
Rosenstock, I. M. (1974). Historical origins of the
health belief model. Health Education & Behavior,
2(4):328–335.
Schwarzer, R. (2008). Modeling health behavior change:
How to predict and modify the adoption and main-
tenance of health behaviors. Applied Psychology,
57(1):1–29.
Szwacka-Mokrzycka, J. (2015). Trends in consumer be-
haviour changes. overview of concepts. Acta Scien-
tiarum Polonorum. Oeconomia, 14(3).
Takeuchi, J.-i. and Yamanishi, K. (2006). A unifying frame-
work for detecting outliers and change points from
time series. IEEE transactions on Knowledge and
Data Engineering, 18(4):482–492.
Tardieu,
´
E., Mahmoudi, R., Novella, J.-L., Oubaya, N.,
Blanchard, F., Jolly, D., and Drame, M. (2016). Ex-
ternal validation of the short emergency geriatric as-
sessment (sega) instrument on the safes cohort. Geri-
atrie et psychologie neuropsychiatrie du vieillisse-
ment, 14(1):49–55.
Taylor, W. A. (2000). Change-point analysis: a powerful
new tool for detecting changes. preprint, available
as http://www. variation. com/cpa/tech/changepoint.
html.
Vellas, B., Guigoz, Y., Garry, P. J., Nourhashemi, F., Ben-
nahum, D., Lauque, S., and Albarede, J.-L. (1999).
The mini nutritional assessment (mna) and its use in
grading the nutritional state of elderly patients. Nutri-
tion, 15(2):116–122.
Wilson, E. O. (2000). Sociobiology. Harvard University
Press.
Technological Approach for Behavior Change Detection toward Better Adaptation of Services for Elderly People
105
