
Photoplethysmogram Fits Finger Blood Pressure Waveform for
non-Invasive and minimally-Intrusive Technologies
Evaluation of Derivative Approaches
Gonzalo Tapia
1
, Mat
´
ıas Salinas
1
, Jaime Plaza
1
, Diego Mellado
1
, Rodrigo Salas
1
, Carolina Saavedra
1
,
Alejandro Veloz
1
, Alexis Arriola
1
, Juan Idiaquez
2
and Antonio Glar
´
ıa
1
1
Escuela de Ingenier
´
ıa Civil Biom
´
edica, U. de Valpara
´
ıso, General Cruz 222, Valpara
´
ıso, Chile
2
Escuela de Medicina, U. de Valpara
´
ıso, Campus de la Salud, Angamos 655, Re
˜
naca, Vi
˜
na del Mar, Chile
Keywords:
VPG, nImI, Arterial Hypertension, Fractional Derivatives, Finapres, Photoplethysmography Derivatives.
Abstract:
The purpose of this work is to fit Photoplethysmography (PPG) to finger Arterial Pressure (fiAP) waveform
using derivative approaches. Derivative approaches consider using Linear Combination of Derivatives (LCD)
and Fractional Derivatives (FDP
α
). Four informed healthy subjects, aging 35.8 ± 11.0 years old, agreed to
perform Handgrip maneuvers. Signals are recorded continually; a Finapres NOVA device is used for fiAP,
while a BIOPAC System is used for PPG and ECG. PPG is smoothed and segmented by heartbeat; recording
sections interfered with spiky blocking noise, are eliminated. Finally, PPG is processed using LCD and FDP
α
and their results are enriched using Lasso technique. Twenty records per subject at rest and twenty at raised
BP are analyzed. Results show PPG to fiAP fitting errors 5.38% ± 0.91 at resting fiAP and 5.86% ± 1.21 at
raised fiAP, being always lower than 15%, suggesting that derivative approaches could be suitable for medical
applications.
1 INTRODUCTION
Invasive methods are used for Blood Pressure (BP)
monitoring in critically ill patients, because measure-
ment is more accurate introducing a cannula in the
arterial system. Non-invasive procedures to mea-
sure Blood Pressure (BP) are perceived by patients
as intrusive, the procedure is frequently abandoned,
and the detection, monitoring and control of Ar-
teria Hypertension (AHT) remains elusive (Kaplan,
2004). The acronym nImI stands for non-Invasive and
minimally- Intrusive and it is proposed to summarize
a concept that could be applied to medical devices
(Tapia and Glar
´
ıa, 2015).
In the literature, (Payne et al., 2006) established
an empiric relation between Systolic Blood Pressure
(SBP) and Pulse Transit Time (PTT) when an im-
planted BP sensor was used. (Wong et al., 2009)
found new empirical relations between BP and PTT
before and after subjects performed controlled run-
ning routine. (Gesche et al., 2012) has proposed a
mathematical model relating the Pulse Wave Velocity
and PTT according with two anthropometric param-
eters. (Liu et al., 2014) measured Pulse Waves with
which produced PPT hysteresis. The Pulse Wave Ve-
locity (PWV) was found in the work of (Galli et al.,
2004) for vascular evaluations in patients.
In a review of Photoplethysmography (PPG) clin-
ical applications, (Allen, 2007) alerts on artifacts that
interfere its normal use, nevertheless they envisions
new clinical applications supported by computational
solutions (Zheng et al., 2008). (Tapia and Glar
´
ıa,
2015) tried to reduce intrusiveness in detecting phys-
ical stress caused by exercise associated with ris-
ing BP, they have used an Artificial Neural Network
to analyze the phase plane of two PPGs. (Baruch
et al., 2011) and (Salinas, 2016) developed method-
ologies to decompose finger PPG components that
reflect cardio-vascular characteristics. Finally, previ-
ous derivative approaches using PPG first derivative,
named VPG and PPG second derivative, named APG,
are reported (see (Zahedi et al., 2007) and (Elgendi,
2012)).
In this paper we propose the development of a
methodology to fit PPG to the fiAP, using either a lin-
ear combination of two subsequent derivatives or us-
ing fractional derivatives (Loverro, 2004; Herrmann,
2014).
Tapia G., Salinas M., Plaza J., Mellado D., Salas R., Saavedra C., Veloz A., Arriola A., Idiaquez J. and Glarà a A.
Photoplethysmogram Fits Finger Blood Pressure Waveform for non-Invasive and minimally-Intrusive Technologies - Evaluation of Derivative Approaches.
DOI: 10.5220/0006143901550162
In Proceedings of the 10th International Joint Conference on Biomedical Engineering Systems and Technologies (BIOSTEC 2017), pages 155-162
ISBN: 978-989-758-212-7
Copyright
c
2017 by SCITEPRESS – Science and Technology Publications, Lda. All rights reserved
155
2 MATERIALS AND METHODS
The required cardiovascular signal acquisition is per-
formed in four healthy subjects (see Table 1), they
were asked to answer a questionnaire, adapted from
Arterial Hypertension Clinical Guide of the Chilean
Ministry of Health. Twenty records per subject at rest
(before Handgrip maneuver) and twenty at raised BP
are analyzed (Handgrip maneuver).
Table 1: Characteristics of the subjects (S) participating in
the essay. It shows their Age, Sex, Body Mass Index (BMI)
and Level of Physical Activity (LPA)(Ser
´
on et al., 2010).
Subjects Characteristics
S AGE SEX BMI LPA
1 26.2 M 18.5 Moderate
2 28.8 M 22.7 High
3 49.6 M 22.2 High
4 39.6 F 21.6 Moderate
2.1 Data Acquisition
Three non-invasive cardiovascular signals are
recorded per subject at a rate of 200 Hz. For the
non-deft hand, it was measured the Arterial Pressure
waveform at the middle phalanx of the middle finger
(fiAP) and the PPG at the tip of index finger. The
electrocardiogram (ECG) is recorded in Einthoven
Lead I. The fiAP signal is recorded continuously and
non-invasively using the “volume-clamp” method
developed by (Pe
ˇ
naz, 1973). This work is the base
for (Finapres, 2015) and is currently implemented
and improved in the Finapres new NOVA model.
Directly from fiAP, the finger Systolic (fiSYS),
Diastolic (fiDIA) and Mean Arterial Pressure
(fiMAP) together with Heart Rate (HR AP), and
Inter-beat interval (IBI) are evaluated. After brachial
oscillometric calibration, the Brachial Arterial
Pressure waveform is reconstructed (reBAP) from
fiAP, and brachial Systolic BP (reSYS) Diastolic BP
(reDIA) and Mean BP (reMAP) are estimated from it.
Oscillometric BP device Model BM 35s from Beurer
is used to calibrate reSYS and reDIA. This calibration
method may be inaccurate, however our proposal
should also work if we use the sphygmomanometer
or a cannula in a further clinical validation.
PPG and ECG are detected using a BIOPAC Sys-
tem configured with a MP-150 Unit and three Biono-
madix Dual Biopotential Pairs. Two pairs are BN-
PPGED which are connected to PPG sensors BN-
PULSE-XCDR which is connected to ECG electrodes
BN-EL30-Lead. PPG and ECG signals are in the
bandwidths from DC to 10 Hz and from 0.3 to 35
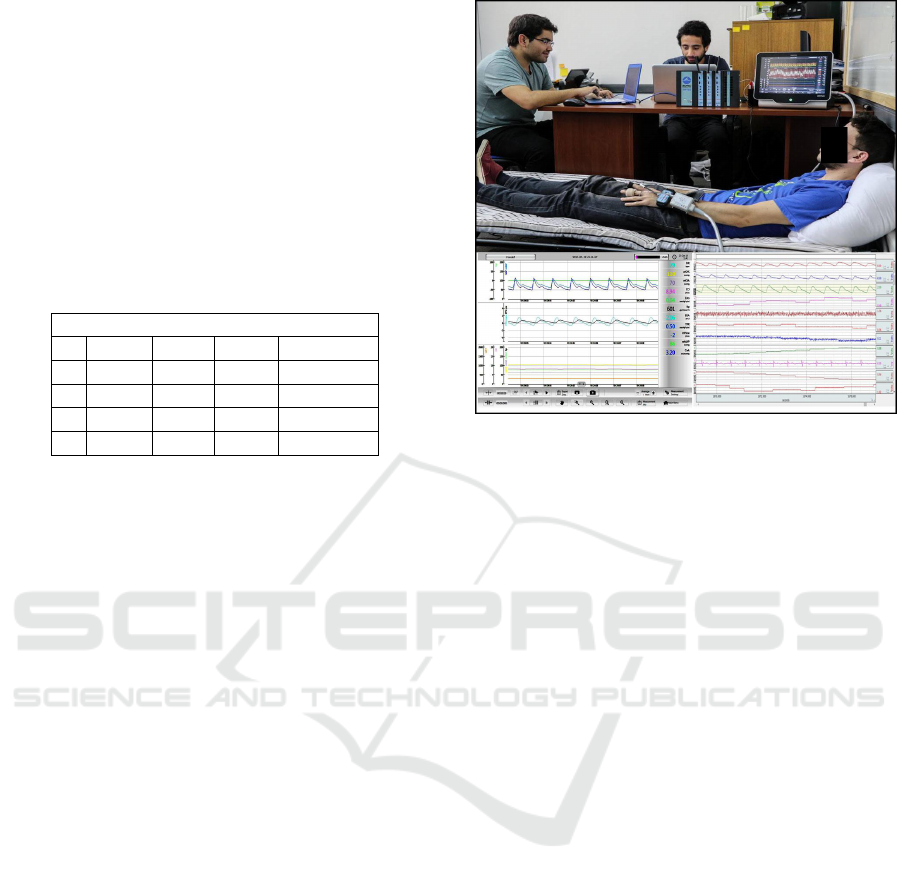
Figure 1: Data acquisition set-up.
Hz, respectively. The MP-150 unit concentrates these
signal together with selected NOVA waveforms and
cardiovascular trends, which are transferred to a note-
book via an Ethernet cable. BIOPAC System uses
proprietary signal acquisition and processing Acq-
Knowledge software which is installed in the note-
book.
The data acquisition set-up is shown in Figure 1.
The subject of the illustrated session has, in his left
hand, a PPG BN-PULSE-XCDR sensor at the tip of
the index finger, and the cuff to measure fiAP from
NOVA device, at the middle phalanx of the main fin-
ger. In his wrist, he has the transmitter of the Biono-
madix pair. Behind the transmitter, in his forearm, he
has the Finapres actuator/sensor for the cuff.
The receivers of Bionomadix pairs are at the
Biopac System. The central unit of Finapres NOVA
device, on one hand, sends a selected set of cardio-
vascular signals to Biopac MP-150 Unit; on the other
hand it sends pneumatic commands to the cuff and
receives the fiAP sensor signals from the Finapres ac-
tuator/sensor. Below the photograph, in the left side,
it is shown the negative image of Nova device display;
and in the right side, it is the display produced by the
software AcqKnowledge.
A clinical essay on this work consists on a vol-
unteer that had to lie down and stay at rest during
10 minutes after connecting all the sensors, mean-
while the NOVA is calibrated with two consecutive
BP measures with the oscillometric BP device. After
the complete resting time, the subject must perform
two Handgrip isometric maneuvers, where he/she
must press a device in a sustained manner during a
standardized time (Chatterjee, 1999). The maneu-
BIOSIGNALS 2017 - 10th International Conference on Bio-inspired Systems and Signal Processing
156
ver is used to induce a controlled rise of the blood
pressure. Both maneuvers are separated by a ten
minute resting period. During the maneuver, the sub-
ject grips steadily, with his deft hand, a cuff during
three minutes; the pressing is performed with one
third of subjects maximal strength. Once the Hand-
grip is finished, the volunteer had to stay at rest dur-
ing, at least, three additional minutes, and the second
Handgrip, the essay is over. Essays were conducted
at the School of Biomedical Engineering (EICB),
Faculty of Engineering, Universidad de Valpara
´
ıso
(Chile). The data set is available in Physionet Works
https://physionet.org/ as a part of the project called
”Non invasive and minimally intrusive blood pressure
estimates.
2.2 PPG Signal Processing
Because PPG is sensitive to thermal changes, move-
ments or respiration (Allen, 2007), and due to quanti-
zation errors, the raw PPG is processed with two FIR
filters. Later, PPG first derivative, known as VPG,
and second derivative, known as the APG, are evalu-
ated using Five Point Stencils (FPS) algorithms. Then
PPG is segmented by heartbeat. Finally and the PPG
is processed to extract sections interfered with spiky
blocking.
2.2.1 Pre-processing of the PPG
The derivative approaches used in this paper requires
differentiating PPG once or twice. Considering that
derivatives are increasingly sensitive to quantization
noise as the differentiation order increases, two off-
line cascade preprocessing are used. First, symmetric
Finite Impulse Response (FIR) filters, with Transition
Bands order 19 and 399 are applied to the PPG. Low
order FIR smooths the PPG by decreasing energy in
quantization error frequency band. High order FIR
stabilizes the DC component of the PPG.
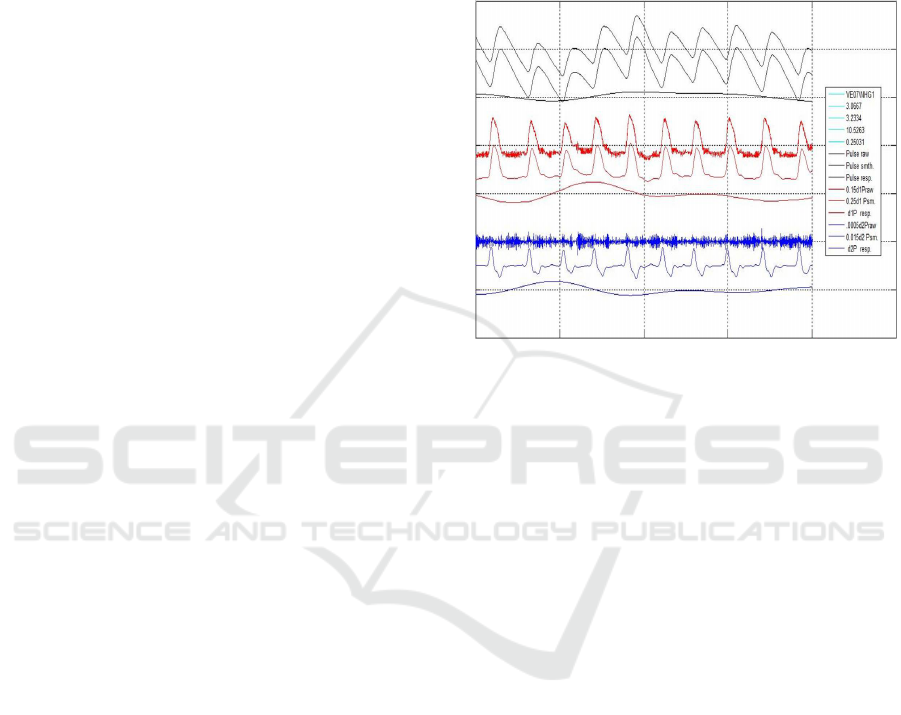
Figure 2 illustrates the effects of smoothing the
PPG and getting its baseline, differentiating the
smoothed PPG using, both conventional L’H
ˆ
opital
rule and Five Point Stencil (FPS) algorithm, getting
VPG estimation, and differentiate the FPS processed
VPG using, both conventional L’H
ˆ
opital rule and FPS
algorithm, getting the APG and its baseline. The sen-
sitivity of L’H
ˆ
opital rule to quantification error can be
observed.
In the figure, the first three black signals are as-
sociated with the PPG; from top to bottom, the raw
PPG, the smoothed PPG and its baseline. Next three
red signals are the scaled, VPG*0.15 evaluated us-
ing both, the L’H
ˆ
opital rule, VPG*0.025, and the FPS
algorithm and VPG baseline. Finally, the next three
blue signals are the scaled APG*.001 using L’H
ˆ
opital
rule, and FPS, APG*0.002, and its APG baseline. The
illustrated signals are from a subject recorded during
minute 3.07 to 3.23 of a Handgrip maneuver. PPG is
FIR Low Pass filtered at 10.5 Hz and FIR High Pass
Filtered at 0.25 Hz.
Figure 2: It is shown, from top to bottom. Black
Traces: PPG raw, smoothed and PPG Baseline. Red
Traces: VPG*0.15 (L’H
ˆ
opital rule), VPG*0.25 (FPS) and
VPG Baseline. Blue Traces: APG*0.001 (L’H
ˆ
opital rule),
APG*0.002 (FPS) and APG Baseline. Subject VE01.
Recording between minutes 3.07 and 3.23. FIR: Low pass
filter at 10.5 Hz; High pass filter at 0.25 Hz.
2.2.2 PPG Signal Segmentation
In order to obtain fiAP and PPG during each heart-
beat, the continuous records must be segmented. A
modified Pan-Tompkins (PTA) algorithm (Pan and
Tompkins, 1985) is used to detect ECG R wave to
segment PPG in the cardiac cycle, which is the unit
of study in this work. PTA processing begins with
a Band-Bass Filter, formed by a cascade of a low-
pass filter (LPF), which attenuates high frequencies
noises, and a High-Pass Filter (HPF), which atten-
uates the ECG waves P and T. The filtered signal
is then derived to sharp the QRS waves with pro-
nounced slopes. In this stage, PTA is modified, intro-
ducing Continuous Wavelet Transform (CWT) using
a Mexican- Hat wavelet to detect R waves.
A threshold function is used to detect QRS com-
plexes. For this reason the ECG is separated in 10
seconds windows to eliminate large amplitude arti-
facts over the whole signal. CWT is applied using
a scale of 3, that is fixed during the process after an
exploratory analysis finding QRS complexes. From
the coefficients obtained on the 10 seconds windows,
the one that have the higher amplitude is chosen to
establish a searching threshold for the rest of the win-
Photoplethysmogram Fits Finger Blood Pressure Waveform for non-Invasive and minimally-Intrusive Technologies - Evaluation of
Derivative Approaches
157

dow. Threshold is established at the 30% of this max-
imum amplitude. Furthermore, a refractory time of
0.3 seconds is established (Guyton and Hall, 2011),
representing the minimal period before the next QRS
complex.
After R wave detection, a searching for possible
missing waves is made differentiating twice the time
interval from two consecutive complexes. After the
detection of windows with missing R waves, a new
threshold is calculated from the two QRS complexes
that contain this window. The searching process is
repeated until the missing R is founded, or a number
of iterations is completed.
Finally, to compensate for the phase change with
respect to the original ECG that the filtering process
produces, a searching of a local maximum on the orig-
inal signal is made to 20 ms rearwards from the po-
sitions already founded. This local maximum corre-
sponds to the R wave on the original ECG signal.
2.2.3 Noisy PPG Extraction
While PPG is transmitted from sensor module to
Biopac system, spiky communication interruption oc-
curs and the signal is blocked. An algorithm is imple-
mented to detect and remove the PPG segments inter-
fered by blocking noise. The unaffected segments are
isolated and saved. Furthermore, it is considered that
unaffected PPG sections with less than ten segments
are useless, the reasons are given below.
The local minimum of PPG wave within the 500
ms after an R wave is considered as the PPG wave be-
ginning. To improve PPG wave discrimination from
interruption artifacts, the first derivative of the seg-
mented PPG named the VPG- is calculated using FPS
algorithm. Maximum VPG is normally near the first
third of cardiac cycle, while interruption artifact is not
synchronized, happening at any instant within the seg-
ment.
To detect artifacts in the first third of the heart-
beat, a Mexican Hat Wavelet Transform is used at
scale of 15 which correlates better with artifacts than
with VPG. Nevertheless, higher correlation is at arti-
facts minimum values, while VPG higher correlation
is at its maximum values. The interruption artifacts
are well detected when both parts of the algorithm are
combined.
2.3 Derivative Approaches
VPG and APG have been extensively used in PPG
analysis. See for example (Zahedi et al., 2007), where
the effect of aging on its velocity rising edge is stud-
ied, and (Elgendi, 2012) proposes standardizing PPG
terminology.
Figure 3: Temporal diagram of fiAP, PPG, VPG and APG.
During a private visit to Paul Bourgine in Paris,
last February, and while talking about complex adap-
tive systems and large interactive networks, conver-
sation suddently switched towards the textbook on
Fractional Calculus (Herrmann, 2014). By that time,
fruitless initial efforts, trying to fit PPG with fiAP,
were tested in Valpara
´
ıso. Both events triggered the
idea that Fractional Derivatives (FD) would deserve
a chance. During last June, Mat
´
ıas Salinas got sur-
prising preliminary results, in Valpara
´
ıso, using Frac-
tional Derivative (FD) to fit PPG to fiAP. In addition,
while, trying to find an intuitive meaning of FD, Gon-
zalo Tapia tested with a Linear Combination of the
PPG with its first Derivative (LCD). Results of fitting
PPG to fiAP with LCD were again as surprising as
those of Mat
´
ıas, although it is clearer that FD is not
equivalent to LCD. The results obtained by Mat
´
ıas
and Gonzalo are at the center of this paper.
A non explicit hypothesis, can now be formulated
after these results, it could be phrased: ”the blood flow
through the digital artery of the index finger can be
modeled using both derivative approaches.
Subsequently, LCD and FD are enriched using
Lasso method for linear regression that combines
multiple values of parameter α, either LCD and FD.
The Lasso technique (Tibshirani, 1996), which con-
sists in a penalized least squares method imposing a
L
1
penalty on the regression coefficients. Let (x
i
, y
i
),
i = 1, 2, ..., N be some data, where x
i
= (x
i1
, ..., x
ip
)
T
are the predictor variables and y
i
are the responses.
As in the usual regression set-up, it is assumed either
that the observations are independent or that the y
i
are
conditionally independent given the x
i j
. It is assumed
that the x
i j
are standardized so that:
∑
i
x
i j
N
= 0 and
BIOSIGNALS 2017 - 10th International Conference on Bio-inspired Systems and Signal Processing
158
∑
i
x
2
i j
N
= 1. Let
ˆ
β = (
ˆ
β
1
, ...,
ˆ
β
p
)
T
, then the parameters
(
ˆ
β
0
,
ˆ
β) are obtained with the Lasso technique :
(
ˆ
β
0
,
ˆ
β) = argmin(
N
∑
i=1
(y
i
− β
0
−
∑
j
β
j
x
i j
)
2
+ λ
∑
j
|β
j
|)
where N is the number of observations, y
i
is the re-
sponse at observation i, x
i
is data at observation i and
λ is a positive regularization parameter. The parame-
ters β
0
and β are scalar parameter. As λ increases, the
number of nonzero components of β decreases.
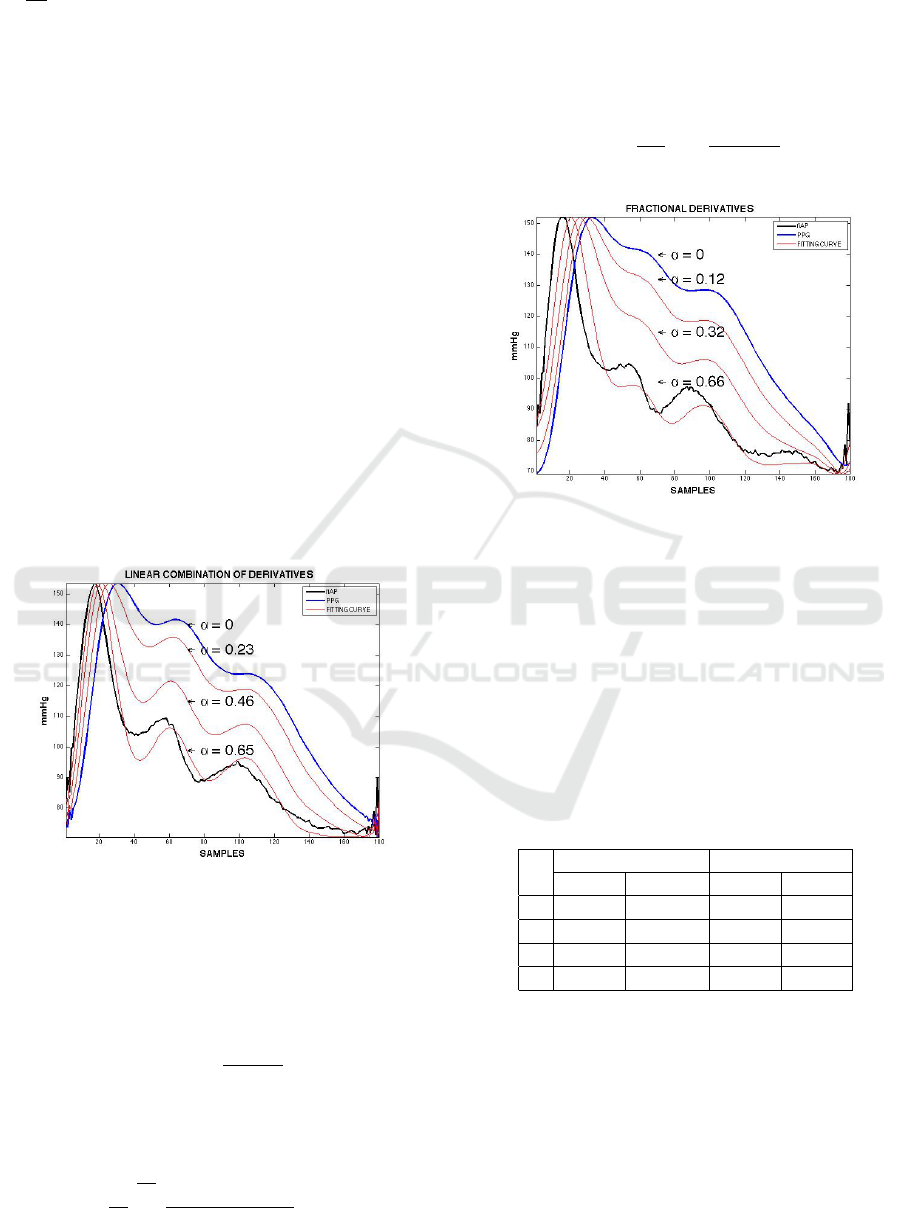
2.3.1 Linear Combination of Derivatives
For a first approach, let LCD
(i)
, be define as:
LCD
(i)
= (1 − α)PPG
(i)
+ αPPG
(i+1)
(1)
where PPG
(k)
is the k
th
order temporal derivative of
the PPG, and α is a single parameter to fit PPG to
fiBP. Notice that, if LCD=LCD
(0)
, given (1), then:
LCD = (1 − α)PPG + αV PG (2)
Figure 4: LCD PPG to fiAP before Handgrip maneuver.
2.3.2 Fractional Derivatives
For the second approach, Fractional Derivatives is
used. The α
th
FD of PPG (FDP
α
) is given by:
FDP
α
=
dPPG
α
dt
α
(3)
According to (Loverro, 2004), if f (t) = PPG and
f
α
(t)=FDP
α
dt
α
, then :
f
α
= lim
h→0
1
h
n
t−a
h
∑
m=0
(−1)
m
Γ(∝ +1)
m!Γ(∝ −m + 1)
f (x − mh) (4)
In FD, two possible criteria are given to evaluate
the derivative of a constant; Riemann-Liouville and
Caputo criterium. It is decided to use the first criteria
because of “physiological plausibility” (Glar
´
ıa et al.,
2010). In such a case, α
th
FD of DC component of
PPG, DCP
α
, is given by
DCP
α
=
d
α
dt
α
t
0
=
1
Γ(1 − α)
t
−α
(5)
Figure 5: FD PPG to fiAP before Handgrip maneuver.
3 RESULTS
Table 2 shows the mean of fiSYS and fiDIA mea-
sured in the fiAP on each subject, at resting fiAP
and at raised fiAP. There is a consistent increase
in the average over the four cases, and in rest and
raised fiAP; fiSYS raised, 32.5±5.9 mmHg and fiDIA
raised, 26±3.1 mmHg.
Table 2: Mean fiSYS and fiDIA from fiAP before and at the
end of Handgrip maneuver.
S RESTING fiAP RAISED fiAP
fiSYS fiDIA fiSYS fiDIA
1 122 82 162 109
2 109 59 143 89
3 127 73 153 96
4 104 64 134 88
Table 3 is a summary for each subject comparing
Root Mean Square Distance (RMSD) and the Relative
Distance (R DIST) between raw PPG and fiAP.
The average over the four subjects of RMSD is
26.8±7.6 mmHg and of R DIST is 30±8.4%. On
the contrary, at raised fiAP, the average of RMSD is
31.6±5.6 mmHg and the R DIST is 27.1±5.7%.
Table 4 shows the mean and standard deviation of
optimal α values from the twenty resting fiAP and the
Photoplethysmogram Fits Finger Blood Pressure Waveform for non-Invasive and minimally-Intrusive Technologies - Evaluation of
Derivative Approaches
159
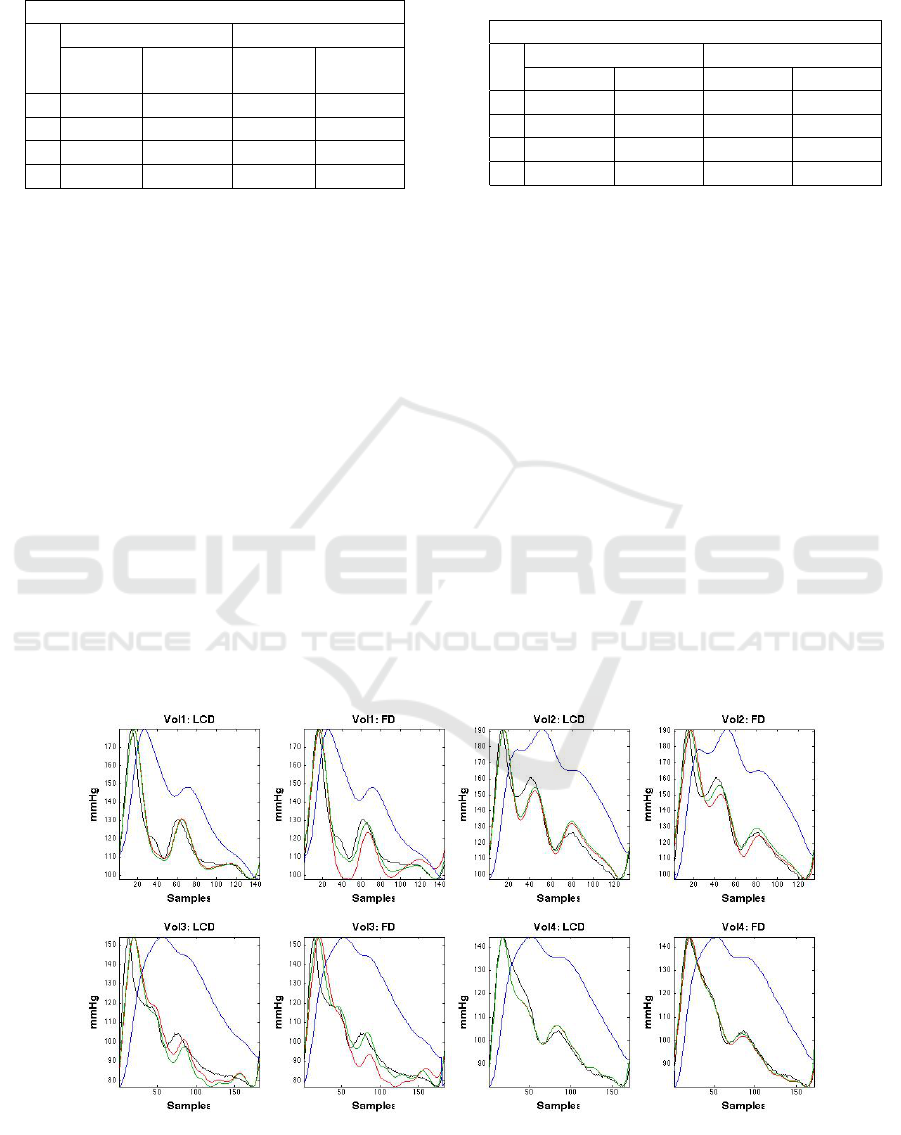
Table 3: Fitting distances: from raw PPG to fiAP wave-
forms before and at the end of Handgrip.
PPG EVALUATION
RESTING fiAP RAISED fiAP
S RMSD R DIST RMSD R DIST
(%) (%)
1 18.6 18.8 27.3 21.1
2 34.3 37.5 36.1 39.1
3 32.3 35.6 36.9 34.2
4 22.3 28.2 26.1 24.0
twenty raised fiAP, in the four subjects, using both
LCD and FD. The average of α over four subjects, for
both at resting fiAP, LCD is 0.74 and for FD is 0.73.
In raised fiAP for LCD is 0.70 and for FD it is 0.76,
suggesting that VPG clearly outweighs the PPG when
fitting PPG to fiAP.
Table 5 summarize, for each subject, the Root
Mean Square Error (RMSE) and the relative error (R
ERR) between LCD, FD, LCD + Lasso and FD +
Lasso processing with PPG. At resting fiAP, RMSE
average over the four subjects, for LCD is 5.2 mmHg
and R ERR is 5.4%; for FD is 6.0 mmHg and R ERR
is 6.0%; for LCD + Lasso is 5.7 mmHg and R ERR is
6.1%; and, finally, for FD + Lasso is 3.9 mmHg and
R ERR is 4,1%. At raised fiAP, RMSE average, over
the four subjects, for LCD is 7.6 mmHg and R ERR
is 6.0%; for FD is 8.3 mmHg and R ERR is 6.4%; for
LCD + Lasso is 8.4 mmHg and R ERR is 6.9%; and,
finally, for FD + Lasso is 5.2 mmHg and R ERR is
Table 4: Comparison of the mean of α and its standard de-
viation on each subject estimated with the two methods on
20 waves before and 20 waves at the end of Handgrip.
α EVALUATION
RESTING fiAP RAISED fiAP
S LCD FD LCD FD
1 .71±.14 .74±.04 .53±.07 .67±.06
2 .72±.06 .62±.07 .74±.04 .72±.09
3 .80±.08 .84±.09 .81±.09 .90±.06
4 .71±.04 .71±.08 .72±.03 .73±.05
4,1%.
Figure 6 illustrates a comparison between the two
derivative approaches, with and without Lasso, in
each subject at resting fiAP.
Figure 7 shows a comparison of fitting errors rel-
ative to the initial raw PPG to fiAP distance (Blue
bars), when using LCD (red bars), without and with
Lasso, and FD (green bars), without and with Lasso.
Errors are Evaluated using average of Relative errors
plus or minus the standard deviation. It can be ap-
preciate that the FD with Lasso outperforms with sta-
tistical significance the other models and reduce the
distance between the raw PPG and fiAP from approx-
imately 30% to 5%.
Finally, we have extended the results for a total of
15 subjects with 250 heartbeats for each subject. Due
to the limit space available, we summarize the results
in the total adjusting error of 5.7% ± 1.8. Moreover
the α is subject dependent and the value obtained was
Figure 6: Four subjects, single heartbeat, before Handgrip; fitting PPG to fiAP. Top row, left to right: subject 1 fit using LCD
and FD; subject 2 fit using LCD and FD. Bottom row, left to right: subject 3 fit using LCD and FD; subject 4 fit using LCD
and FD. Color codes: fiAP (Black), PPG (Blue), Derivative approaches (Red), and Derivative approaches with Lasso (Green).
BIOSIGNALS 2017 - 10th International Conference on Bio-inspired Systems and Signal Processing
160
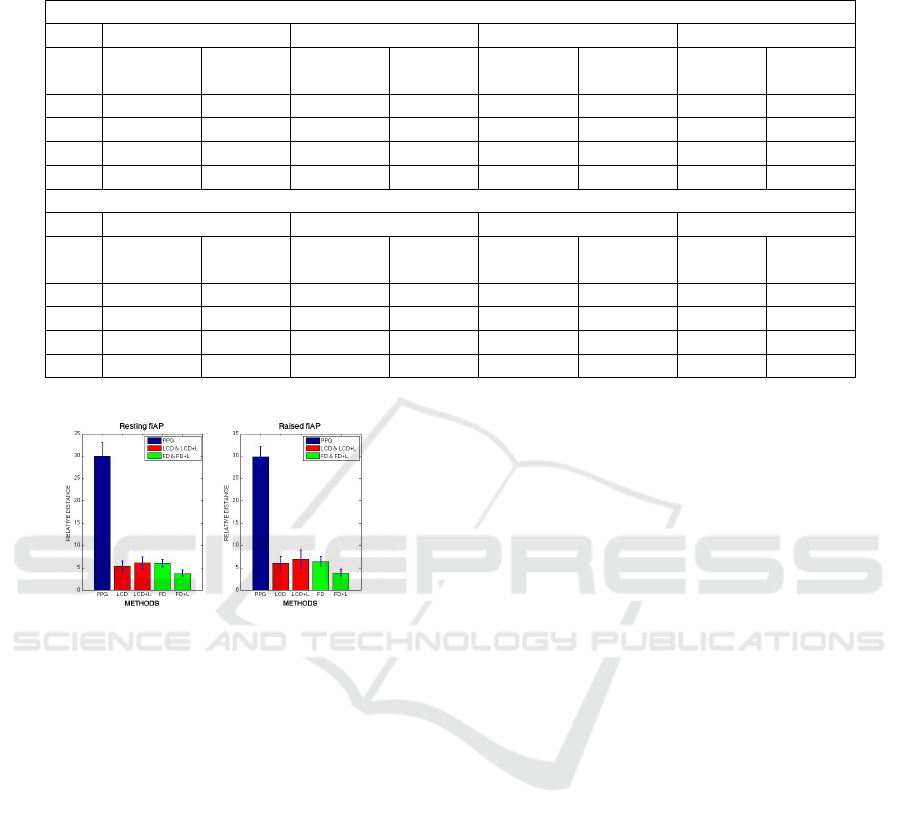
Table 5: Fitting errors. Top: at resting fiAP and Bottom: at Raised fiAP. From left to right: LCD fitting, FD fitting, LCD +
Lasso Fitting and FD + Lasso Fitting.
FITTING ERRORS: RESTING fiAP
LCD FD LCD + Lasso FD + Lasso
S RMSE R ERR RMSE R ERR RMSE R ERR RMSE R ERR
(%) (%) (%) (%)
1 6.3±1.4 6.8±1.7 5.2±0.5 5.4±0.5 7.5±1.7 8.2±1.9 3.5±0.5 3.7±0.6
2 3.5±0.8 3.7±0.8 5.9±1.2 5.4±1.0 3.7±1.1 4.0±1.2 3.5±0.7 3.7±0.6
3 9.1±0.8 8.5±1.2 10.1±0.7 9.9±0.9 9.5±0.9 9.3±1.2 6.7±2.2 6.5±2.0
4 1.9±0.8 2.4±1.0 2.8±0.7 3.3±0.8 2.0±0.8 2.7±1.1 2.0±0.5 2.5±0.6
FITTING ERRORS: RAISED fiAP
LCD FD LCD + Lasso FD + Lasso
Sub RMSE R ERR RMSE R ERR RMSE R ERR RMSE R ERR
(%) (%) (%) (%)
1 10.5±4.0 8.6±3.4 9.3±1.0 7.0±0.9 12.9±5.4 11.1±4.8 5.0±0.5 3.8±0.5
2 6.2±1.1 4.6±0.7 8.1±1.1 5.7±0.9 6.4±1.2 4.8±0.8 4.9±0.7 3.6±0.5
3 9.8±2.1 7.6±1.8 10.9±1.6 8.6±1.3 10.1±2.2 8.0±2.0 7.7±1.9 6.2±1.5
4 3.7±0.5 3.1±0.4 5.0±1.5 4.4±1.3 4.2±0.7 3.7±0.6 3.1±0.8 2.9±0.8
Figure 7: Relative Distances between raw PPG (Blue); LCD
/ LCD + Lasso (Red); and FD / FD + Lasso (Green) with
the fiAP waveform.
0.73 ± 0.1.
4 CONCLUSIONS
The analysis of the results, considering that the to-
tal average fitting error is 5.7% for 15 subjects, al-
lows to conclude that it is possible to reconstruct fiAP
waveforms from the PPG using LCD and FDP
α
ap-
proaches. Due to the high variability of the fitting
errors per subject at resting and raised fiAP, these re-
sults suggest that the method should be customized
for each subject.
Although not shown, the worst fitting error is
15%. In all cases, the fitted waveform keeps the pat-
tern. This result suggests that derivative approaches
could be suitable for medical applications. However
further work must be done in order to be used for es-
timation purposes. On the other hand, the Fitting pre-
cision on each subject has relative low variability be-
cause it is performed in every segmented PPG wave.
When the total average of mean fitting errors, over
the four subjects is ordered by performance, at rest
and raised fiAP, results are, for FD + Lasso process-
ing, 4.1 and 4.2%, for LCD processing, 5.4 and 6.0%,
for FD, 6.0 and 6.4% and for LCD + Lasso, 6.1 and
6.9%. In addition, the Variation Coefficient, at rest
and raised fiAP results are, for FD 15.3% and 18.3%,
for LCD 25.6% and 23.4%, for LCD + Lasso, 26.7%
and 24.3% and FD + Lasso 24.8% and 19.7%. Fitting
PPG to fiAP at rest is always more precise (error =
5.38%±0, 91) than during raised fiAP (5.86%±1.21)
Finally, it should be noted that although FD algo-
rithm requires much more complex algorithms than
LCD, both approaches produce similar results. How-
ever, it is surprising that results obtained using LCD
are better than those obtained with LCD + Lasso. A
possible explication would be that LCD + Lasso could
be penalizing twice the weights.
COMPLIANCE WITH ETHICAL
REQUIREMENTS
The authors declare that they have no conflict of in-
terest. In addition, Informed Consents were obtained
and discussed with the subjects for the acquisition of
fiAP, PPG and ECG from 2015 up to date. Clini-
cal Essays have been approved by the Universidad de
Valpara
´
ıso, Bioethics Institutional Committee for Hu-
man Beings Research (CIBI-SH UV for its acronym).
Photoplethysmogram Fits Finger Blood Pressure Waveform for non-Invasive and minimally-Intrusive Technologies - Evaluation of
Derivative Approaches
161

ACKNOWLEDGEMENTS
The authors acknowledge the support by Chilean
Grants FONDEF IT13I20060 from Conicyt, CONI-
CYT + PAI/CONCURSO NACIONAL INSERCI
´
ON
EN LA ACADEMIA, CONVOCATORIA 2014 + Fo-
lio (79140057) and PMI UV1402 from the Ministry
of Education. Thanks to anonymous subjects, ei-
ther healthy volunteers or patients, who participate in
Clinical Essays.
REFERENCES
Allen, J. (2007). Photoplethysmography and its application
in clinical physiological measurement. Physiological
measurement, 28(3):R1–R39.
Baruch, M. C., Warburton, D. E., Bredin, S. S., Cote, A.,
Gerdt, D. W., and Adkins, C. M. (2011). Pulse de-
composition analysis of the digital arterial pulse dur-
ing hemorrhage simulation. Nonlinear biomedical
physics, 5(1):1.
Chatterjee, K. (1999). Physiologic and pharmacologic ma-
neuvers in the differential diagnosis of heart murmurs
and sounds. Technical report.
Elgendi, M. (2012). Standard terminologies for photo-
plethysmogram signals. Current cardiology reviews,
8(3):215–219.
Finapres (2015). Finapres medical systems (2015).
http://www.finapres.com/products/finapres-nova. Ac-
cessed: 2015-04-18.
Galli, C., Camus, J. M., Fischer, E., Cabrera, I., and Risk,
M. R. (2004). La velocidad de la onda del pulso en
la evaluaci
´
on vascular de pacientes con insuficiencia
renal. Rev Fed Arg Cardiol, 33:212–217.
Gesche, H., Grosskurth, D., K
¨
uchler, G., and Patzak, A.
(2012). Continuous blood pressure measurement by
using the pulse transit time: comparison to a cuff-
based method. European journal of applied physiol-
ogy, 112(1):309–315.
Glar
´
ıa, A., Taramasco, C., and J., D. (2010). Method-
ological proposal to estimate a tailored to the problem
specificity mathematical transformation: Use of com-
puter intelligence to optimize algorithm complexity
and application to auditory brainstem responses mod-
eling. In Advanced Information Networking and Ap-
plications Workshops (WAINA), 2010 IEEE 24th In-
ternational Conference on, pages 775–781.
Guyton, A. C. and Hall, J. E. (2011). Tratado de fisiolog
´
ıa
m
´
edica. Elsevier,, Barcelona, 12 edition.
Herrmann, R. (2014). Fractional calculus: An introduction
for physicists. World Scientific, Singapore.
Kaplan, N. (2004). Hipertensi
´
on arterial sist
´
emica: mecan-
ismos y diagn
´
ostico, in Braunwald (Ed) Tratado de
cardiolog
´
ıa. Madrid: Marban Libros.Edition 6.
Liu, Q., Yan, B. P., Yu, C.-M., Zhang, Y.-T., and Poon, C. C.
(2014). Attenuation of systolic blood pressure and
pulse transit time hysteresis during exercise and re-
covery in cardiovascular patients. IEEE Transactions
on Biomedical Engineering, 61(2):346–352.
Loverro, A. (2004). Fractional calculus: history, definitions
and applications for the engineer. Rapport technique,
University of Notre Dame: Department of Aerospace
and Mechanical Engineering.
Pan, J. and Tompkins, W. J. (1985). A real-time QRS de-
tection algorithm. IEEE transactions on biomedical
engineering, (3):230–236.
Payne, R., Symeonides, C., Webb, D., and Maxwell, S.
(2006). Pulse transit time measured from the ecg:
an unreliable marker of beat-to-beat blood pressure.
Journal of Applied Physiology, 100(1):136–141.
Pe
ˇ
naz, J. (1973). Photoelectric measurement of blood pres-
sure, volume and flow in the finger. In Digest of 10th
International Conference on Medical Biological En-
gineering, Dresden, East Germany, page 104.
Salinas, M. (2016). Hacia una tps wk para la estimaci
´
on
de la presi
´
on arterial. Unpublished Degree Work to
obtain the Title of Ingeniero Civil Biom
´
edico. U. de
Valpara
´
ıso, Chile.
Ser
´
on, P., Mu
˜
noz, S., and Lanas, F. (2010). Nivel de ac-
tividad f
´
ısica medida a trav
´
es del cuestionario interna-
cional de actividad f
´
ısica en poblaci
´
on chilena. Re-
vista m
´
edica de Chile, 138(10):1232–1239.
Tapia, G. and Glar
´
ıa, A. (2015). Artificial neural network
detects physical stress from arterial pulse wave. Re-
vista Ingenier
´
ıa Biom
´
edica, 9(17):21–34.
Tibshirani, R. (1996). Regression shrinkage and selection
via the lasso. Journal of the Royal Statistical Society.
Series B (Methodological), pages 267–288.
Wong, M. Y.-M., Poon, C. C.-Y., and Zhang, Y.-T. (2009).
An evaluation of the cuffless blood pressure estima-
tion based on pulse transit time technique: a half year
study on normotensive subjects. Cardiovascular En-
gineering, 9(1):32–38.
Zahedi, E., Chellappan, K., Ali, M. A. M., and Singh, H.
(2007). Analysis of the effect of ageing on rising
edge characteristics of the photoplethysmogram using
a modified windkessel model. Cardiovascular Engi-
neering, 7(4):172–181.
Zheng, D., Allen, J., and Murray, A. (2008). Determination
of aortic valve opening time and left ventricular peak
filling rate from the peripheral pulse amplitude in pa-
tients with ectopic beats. Physiological measurement,
29(12):1411.
BIOSIGNALS 2017 - 10th International Conference on Bio-inspired Systems and Signal Processing
162
