
A Low-cost Life Sign Detection Method based on Time Series
Analysis of Facial Feature Points
Timon Marius Bloecher
1
, Leyre Garralda Iriarte
2
, Johannes Schneider
1
,
Christoph Zimmermann
1
and Wilhelm Stork
1
1
FZI Forschungszentrum Informatik, Haid-und-Neu-Straße 10-14, 76131 Karlsruhe, Germany
2
Public University of Navarre, Campus de Arrosadia, 31006 Pamplona, Navarra, Spain
Keywords: Anti-spoofing, Biometrics, Presentation Attack Detection, Blinking Rate, Face Detection, Face Tracking,
Face Liveness Detection, Life Signs, Time Series Analysis, Photoplethysmography Imaging (PPGI).
Abstract: The use of image based presentation attack detection (PAD) systems has experienced an enormous growth of
interest in recent years. The most accurate techniques in literature addressing this topic rely on the verification
of the actual three-dimensionality of the face, which increases complexity and costs of the system. In this
work, we propose an effective and low-cost face spoofing detector system to supplement a PPGI-based vital
signal monitoring application. Starting from a set of automatically located facial feature points, the movement
information of this set of points was obtained. Based on a time series analysis of the landmark position
distances using peak descriptors and cross-correlation coefficients as classifiers in a sliding window, life signs
have been exploited to develop a system being able to recognize false detections and biometric spoofs. To
verify the performance, experiments on three different benchmark datasets (CASIA face anti-spoofing, MSU
and IDIAP Replay-Attack databases) were made. The evaluation of the proposed low-cost approach showed
good results (accuracy of ~85-95%) compared to more resource-intensive state-of-the-art methods.
1 INTRODUCTION
Automatic face recognition and tracking systems are
nowadays widely used in many different applications,
such as de-duplication of identity, authentication of
mobile payment or people analytics and people flow
management. Particularly, in our case, human faces
are detected and tracked to perform camera based
heart rate estimation based on the
Photoplethysmography Imaging (PPGI) method.
Using an off the shelf camera under ambient light the
systems allows an online beat-to-beat heart rate
estimation from a person’s forehead (Bloecher et al.,
2014). However, such face recognition based systems
are vulnerable to spoof attacks made by non-real
faces, for instance facial pictures such as portrait
photographs. In our case, this may lead to the
unwelcome effect that the system tries to extract vital
signs of non-real persons. Therefore, face recognition
based systems need presentation attack detection
(PAD) in order to guard against spoofing or false
detections. In the literature many approaches utilize
Face Liveness Detection for PAD (Kähm and Damer,
2011), (Parveen, 2015), (Garud and Agrawal, 2016).
Some of the most interesting methods include:
Life sign. Exploit inherent characteristics of a
live face, e.g. eye blinking (Pan et al., 2007)
or demand real time responses from the user,
e.g. smile detection (Deniz et al., 2008)
Frequency and texture. Differentiate between
real and fake in terms of shape and
detailedness, using feature extraction and
classifiers. Examples include algorithms
based on frequency analysis of face images
(Kim et al., 2012) or the extraction of micro
textures (Maatta et al., 2011).
Motion. Approaches based on foreground and
background motion correlation using optical
flow (Anjos et al, 2014).
For our purpose, an effective and low-cost
detection method was favoured, in order to save
computational resources needed for other parts of our
heart rate extraction algorithm. Especially since we
aim for a vital sign extraction solution for embedded
and mobile devices in the future.
Bloecher T., Garralda Iriarte L., Schneider J., Zimmermann C. and Stork W.
A Low-cost Life Sign Detection Method based on Time Series Analysis of Facial Feature Points.
DOI: 10.5220/0006141601470154
In Proceedings of the 10th International Joint Conference on Biomedical Engineering Systems and Technologies (BIOSTEC 2017), pages 147-154
ISBN: 978-989-758-212-7
Copyright
c
2017 by SCITEPRESS – Science and Technology Publications, Lda. All rights reserved
147
Regarding the three mentioned methods, the life
sign based face liveness detection for PAD is known
for being highly secure against 2D image or 3D
sculpture spoof attacks (Chakraborty and Das, 2014),
while it does not require the use of highly complicated
and expensive devices. While other approaches show
better resistance to video replay attacks, this was not
focused in our system, due to the fact that the user
could be interested on vital sign detection in videos.
Furthermore the combination of life sign and vital
sign detection may unclose further interesting
applications. These facts made life sign based PAD a
promising solution for our system.
2 METHODS
In the present work, a new presentation attack method
is proposed which is based on detection and tracking
of a set of facial points and subsequent analysis and
processing of the aforementioned data in order to
detect life sign patterns.
2.1 Facial Feature Detection
The set of facial landmarks are automatically detected
and tracked using the IntraFace software (Xiong and
De la Torre, 2013), which is a free research software
for facial image analysis. Facial feature detection and
tracking are performed based on the supervised
decent method (SDM). It can be used to track a total
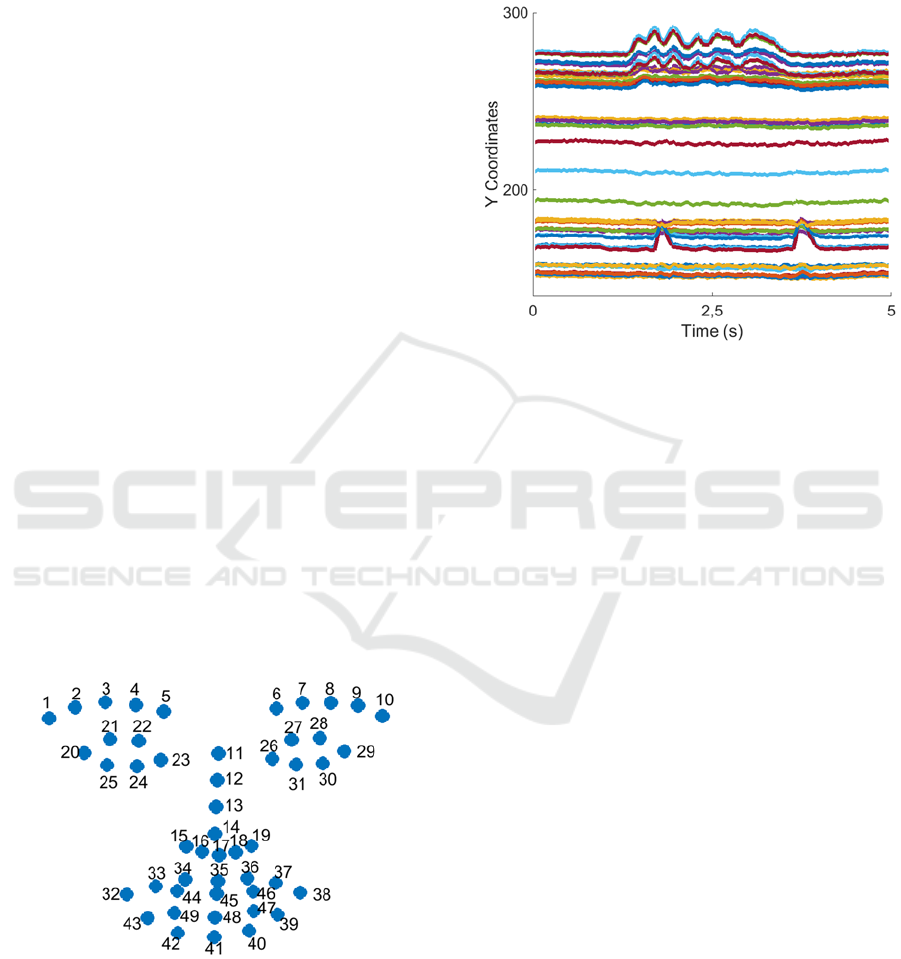
of 49 facial points, providing the current landmark
locations in the image: 10 for the eyebrows, 12 for the
eyes, 9 for the nose and 18 for the lips (see Figure 1).
Figure 1: Set of 49 facial landmarks of the IntraFace tracker.
2.2 Analysis of the Feature Points
A time series analysis of the position of the facial
feature points showed clear differences in the change
of landmark positions depending on a facial gesture.
Those relative distance changes between the
landmarks were not found during measurements of
moving portrait pictures. As it can be seen in
Figure 2, there were several peaks and patterns that
could be used to build a PAD program.
Figure 2: Y coordinates of all 49 points during a time
interval of 5 seconds in a face video taken with 30 fps.
3 PROPOSED ALGORITHM
Analysing the time series of the relative distance
changes of the feature locations, different facial
expression dynamics were detected. Specifically, the
selected life signs were blinking, speaking, smiling,
mouth movements and eye movements. As it is
observed in Figure 6, the life signs have a varying
time series dynamic, so different techniques were
used to detect each of them. The resulting algorithms
were implemented in MATLAB.
3.1 Blinking
Blinking is a semi-autonomic rapid closing of the
eyelid. Generally, between each blink, there is an
interval of 2–10 seconds; actually rates vary by
individual averaging around 10 blinks per minute in a
laboratory setting (Bentivoglio et al, 1997).
Therefore, it was considered reasonable choosing a
time interval of 5 seconds for the time series analysis.
During this interval, the distances between the
feature points of the upper and downer-eye are
analysed for both eyes (see Figure 3). If the eye
closes, the distance between the upper and downer-
eye points decreases. The result is a signal peak (as
seen in Figure 8a). Before classification, the eye
distance signals are normalized using the nose
distances (features 11 and 14). As classifier we use a
peak descriptor, combining height and width of the
BIOSIGNALS 2017 - 10th International Conference on Bio-inspired Systems and Signal Processing
148
peak. As a blink lasts for about 0.1 to 0.2 seconds
(Bentivoglio et al, 1997), the peak width needs to be
less than 8 frames (~0.25s) and the normalized peak
height smaller than a threshold value of ‘0.3’.
Secondary a peak has to be detected for all four eye-
distances.
In addition to its substantial contribution for PAD,
blinking rate detection can provide important
information towards the measure of a person’s
tiredness as a further parameter for psycho-
physiological state estimation. For this reason the
performance will be separately considered in chapter
5.
Figure 3: The four eye distances used for the blinking
detection algorithm.
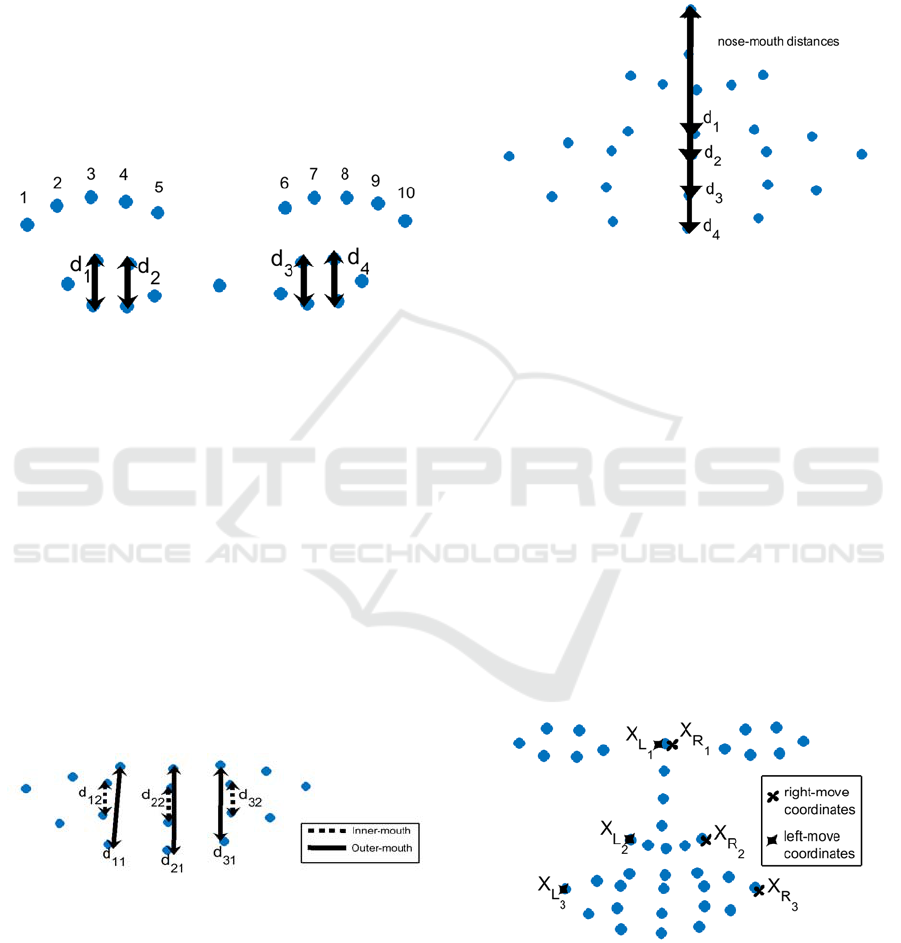
3.2 Speaking and Smiling
In order to detect whether the user speaks or smiles,
the cross-correlation of the mouth feature distance
signals was used as classifier (see Figure 8 b-c). Two
different signals were considered: Inner-outer mouth
distances and nose-mouth distances.
The distance between the three inner-mouth and
outer-mouth points is computed for each frame. The
resulting signal is analysed using cross-correlation.
The coefficients R
d11
d12
, R
d12
d22,
R
d31
d32
(see Figure
4) are computed for a sliding time window of 5
seconds. If a person speaks or smiles, the inner and
outer signals will show similarity whereby the cross-
correlation coefficient will have high values.
Figure 4: The three pair mouth distances used for the
speaking and smiling detection algorithm.
Secondly, the cross-correlation between the nose-
mouth distances was also computed for all four
central mouth features. In the event of speaking or
smiling, d
1
& d
2
will decrease and d
3
& d
4
will
increase. Thus, the correlations coefficients of the
distance signals <d
1
,d
3
>, <d
1
,d
4
>, <d
2
,d
3
> and <d
2
-
d
4
> are supposed to have small values. Empirical tests
proved a cross-correlation coefficient of the inner-
outer mouth distances higher than ‘0.8’ and a cross-
correlation of the nose-mouth distances smaller than
‘0.85’ to be proper values for the speak and smile
detection.
Figure 5: The four nose-mouth distances used for the speak
and smile detection algorithm.
3.3 Mouth Movements
In addition to speaking or smiling, buccal motions can
occur while the mouth is closed. In this case, the outer
lower-nose part will move analogous to the mouth,
while the upper-nose part is likely to remain still.
Exploiting this idea, the x coordinates of three
features were tracked in each side of the face. Based
on that the cross-correlations coefficients R
XR3 XR1
,
R
XR3 XR2
, R
XL3 XL1
and R
XL3 XL2
were computed as
further classifiers (Figure 6). Empirical analysis
showed, that feature position changes in the mouth
area can be considered as life sign ‘mouth-
movement’, when the cross-correlation coefficient of
the upper-nose-mouth signals is lower than ‘0.7’ and
the coefficient of the lower-nose-mouth signals is
above ‘0.9’.
Figure 6: Three pairs of facial feature points used for the
mouth movement detection algorithm.
3.4 Eye Movements
Similar to the mouth movements, eye movements
A Low-cost Life Sign Detection Method based on Time Series Analysis of Facial Feature Points
149
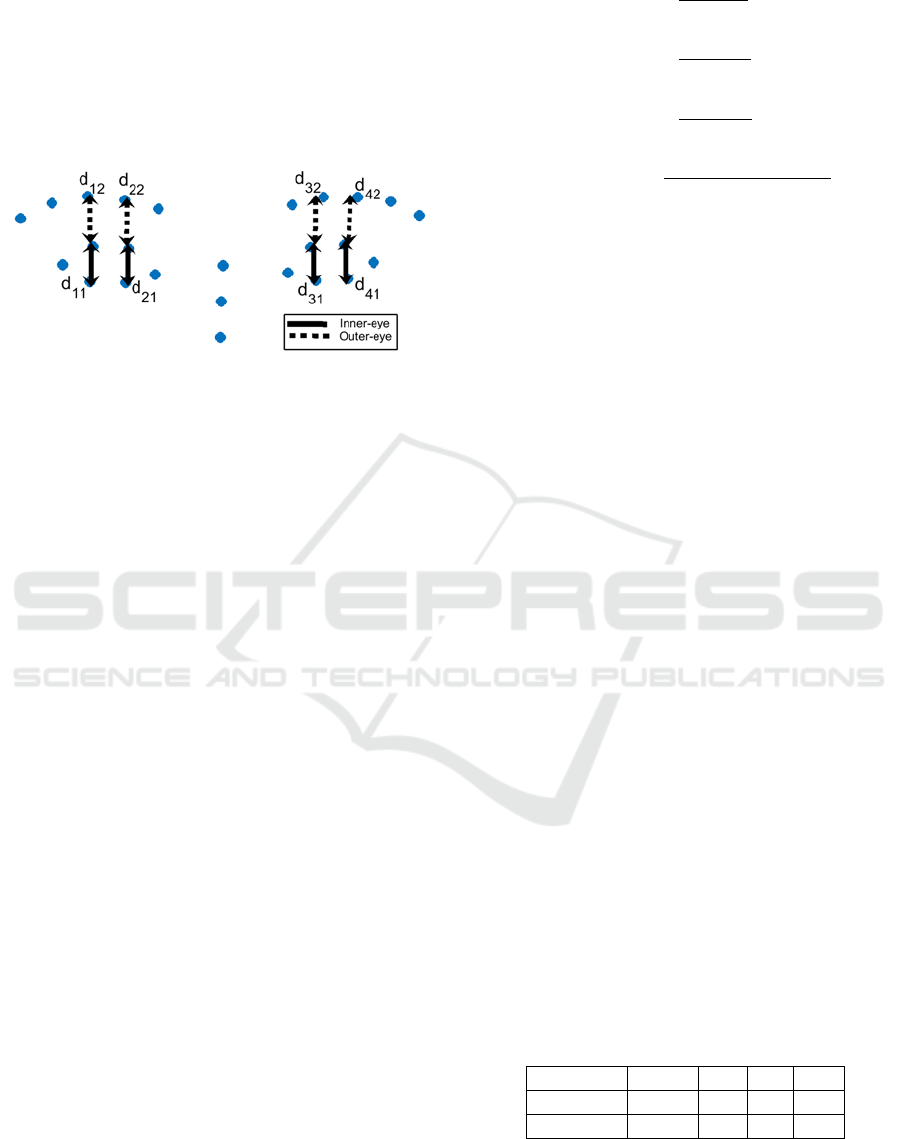
may occur even if the user does not blink, e.g. due to
a change in the eye direction. To take this into
account, the outer eye distances were determined as
the distances between the upper inner-eye and the
central eyebrow features. Based on that, the cross-
correlation coefficients between the inner-eye and the
inverse of the outer-eye distances were computed to
detect ‘eye movement’ life signs (see Figure 7).
Figure 7: The four eye pair distances used for the eye
movement detection algorithm.
3.5 Classification
The classifiers, including the peak descriptor and the
cross-correlation coefficients, were analysed using a
sliding time window of 5 seconds. If one classifier
met the realness criteria, e.g. in form of exceeding the
correlation coefficient threshold, the face in the image
was classified as real.
4 PERFORMANCE EVALUATION
The performance of the proposed liveness detection
scheme was validated on two different phases:
Firstly, a particular test was performed to measure the
accuracy of the eye blink detection scheme as already
mentioned in section 3.1. Secondly, the general
performance of the life sign based anti-spoofing
system was tested.
4.1 Evaluating Performance of the
Blink Detector
4.1.1 Evaluation Tools
To measure the eye blink detector’s accuracy,
predicted blinks are compared to the ground-truth
blinks. The correctly detected eye-blinks are denoted
as True Positives (TP), the correctly detected non-
blinks are denoted as True Negatives (TN), false
detections are denoted as False Positives (FP), and
missed eye-blinks are denoted as False Negatives
(FN). Based on these parameters four common
measures of the system performance were used:
Precision =
TP
TP + FP
(1)
Recall =
TP
TP + FN
(2)
FP Rate =
FP
TN + FN
(3)
Mean Accurac
y
=
TP + TN
TP + TN + FP + FN
(4)
4.1.2 Databases
The performance of the proposed blink detection
scheme was validated on two different databases:
Talking Face Video and ZJU.
The Talking Face video dataset consists of 5000
frames taken from a video of a person engaged in
conversation (PRIMA; 2000). This corresponds to
about 200 seconds of recording with a total of 61 eye
blinks. The sequence was taken as part of an
experiment designed to model the behaviour of the
face in natural conversation. Ground truth
information for all eye blinks in the Talking Face
Video was obtained as part of the PRE-WORK
project (Divjak and Bischof, 2009) at the Graz
University of Technology, Austria. For each blink the
type (full or partial), start index, peak index and stop
index were annotated. An eye blink is considered as
detected, if there is a match between the detected
blink frame and the annotation blink frame indexes.
The results are presented in Table 1 and 2.
The ZJU dataset consists of 80 short videos
(10876 frames) of 20 individuals with and without
glasses captured with 30fps and size of 320 × 240
(Pan et al, 2007). The videos are collected from
frontal and upward views. In sum the ZJU contains
255 eye blinks. The ground truth information was
again obtained from the project of (Divjak and
Bischof, 2009). The results are shown in Table 1 and
2. It should be mentioned that some of them are
voluntary longer eye blinks. Therefore the FN
increases slightly compared to the Talking Face
dataset, since our algorithm only detects blinks with
a maximum duration of 0.6 seconds.
Table 1: Confusion matrix results of the blink detector.
Database TN
FN
FP
TP
Talking 4943 3 1 58
ZJU 11604 6 17 260
BIOSIGNALS 2017 - 10th International Conference on Bio-inspired Systems and Signal Processing
150
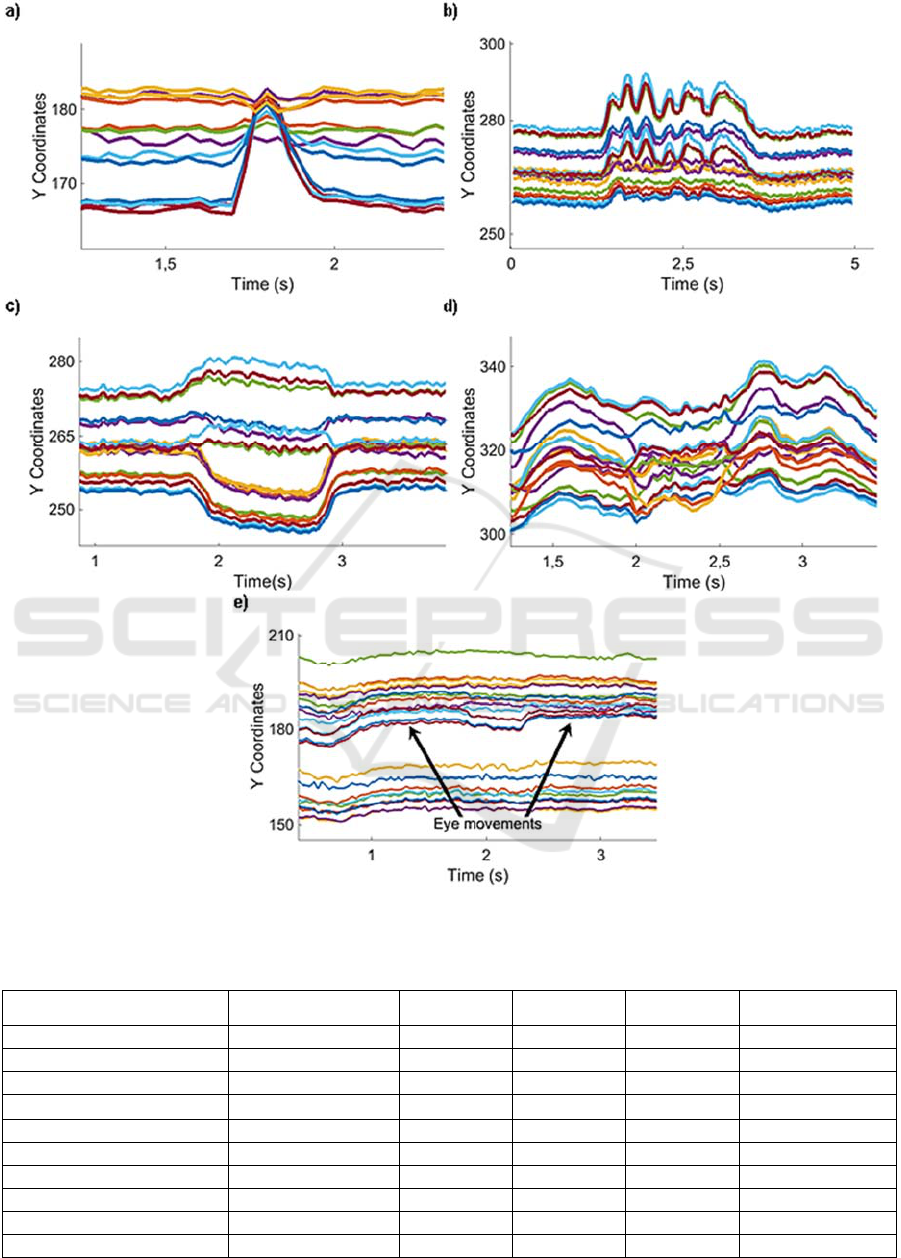
Figure 8: Time series analysis of the Y coordinates of the tracked facial feature points showing the following life signs: a)
Blink; b) Speak; c) Smile; d) Mouth movements; e) Eye movements.
Table 2: Performance comparison of the blinking detection method.
Method Database
Precision Recall FP Rate
Mean Accurac
y
Div
j
ak & Bischof Talkin
g
- 95,0% 19,00% 88,0%
Divjak & Bischof 2 Talking - 92,0% 6,00% 93,0%
Lee et al. Talkin
g
83,3% 91,2% - -
Drutarovsky & Fogelton Talking 92,2% 96,7% 0,10% 99,8%
Our method Talkin
g
98,3% 95,1% 0,02% 99,9%
Divjak & Bischof ZJU - 95,0% 2,00% 97,0%
Div
j
ak & Bischof 2 ZJU 94,4% 91,7% - -
Lee et al. ZJU 90,7% 71,4% 1,00% 94,8%
Drutarovsky & Fogelton ZJU 91,0% 73,1% 0,17% 99,8%
Our method ZJU 93,9% 97,7% 0,15% 99,8%
A Low-cost Life Sign Detection Method based on Time Series Analysis of Facial Feature Points
151
4.1.3 Comparison of Our Method
After testing the accuracy of our blink detector
system, the proposed algorithm’s performance was
compared to other methods in the literature. As it can
be seen in Table 2, the proposed algorithm achieves
good results and shows comparable or even better
results than the state-of-the-art methods regarding the
two standard datasets. For instance, the precision
obtained with our approach is higher (around 6-7%)
for the Talking a dataset. Moreover, the mean
accuracy is comparable or slightly higher for both
datasets.
4.2 Evaluating Performance of
Liveness Detector
4.2.1 Evaluation Tools
Similar to the evaluation of the blink detection, the
classical approach regards a PAD system as a binary
classification system, but the metrics are ambiguous
and not unified in several publications. Apart from the
parameters already used for the blinking
classification, the following new evaluating
methodologies were included:
Half Total Error Rate (HTER). A possible
way to measure the detection performance is
to use the HTER, which combines the FP
Rate, also known as the False Rejection Rate
(FRR), which is the ratio of incorrectly
rejected genuine users, and FN Rate, also
known as the False Acceptance Rate (FAR),
implying the ratio of incorrectly accepted
impostors and is defined in the formula 5:
HTER(%) =
+
2
(5)
Detection-Error Trade-off (DET). DET
curves are score distributions utilized to
evaluate the anti-spoofing accuracy
graphically. The DET plotting code was
downloaded from (NIST, 2007).
4.2.2 Databases
The performance of the proposed liveness detection
scheme was validated on three different databases:
CASIA, MSU and IDIAP.
A) CASIA
This database mainly focuses on variation of the
collected data, trying to provide a comprehensive
collection (Zhang, 2012). Specifically, the database
contains 50 genuine subjects (30 test and 20 training
subjects). Three imaging qualities are considered
(low, normal and high quality). Fake faces are
generated from high quality records of genuine faces.
Three fake face attacks are implemented: warped
photo attacks, in which face images are printed on
paper and warped to simulate motion; Cut photo
attacks, in which the printed face photo has also eye
cuts to simulate blinking; Video attacks, in which face
images are displayed using a mobile device. Each
subject contains 12 videos (3 genuine and 9 fake), and
the final database contains 600 video clips.
For our evaluation purpose and the different focus
of our system (see chapter 1), the cut photo attack has
been eliminated and the video attack has been
considered to be real. Thus, each subject contains 9
videos (6 genuine and 3 fake) and the final database
contains test videos from 30 subjects (270 video
clips). The results are represented in Table 3+4 and
visualized in Figure 9. A Precision of ~95%, a Mean
Accuracy of ~99% and a HTER of ~6% were
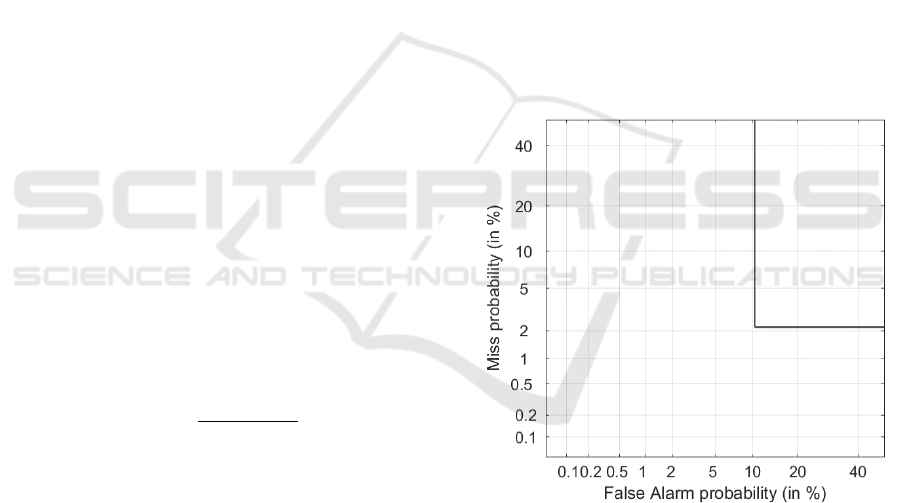
achieved. From the DET curve in Fig. 8, as a result of
the warped motion, one may note that the FAR (10%)
is higher than the FRR (2%).
Figure 9: DET curve plotting for the CASIA database.
B) MSU
The MSU face spoof attack database consists of 280
video clips including photo and video attack attempts
to 35 clients (Wen et al, 2015). Altogether, there are
280 real-accesses and attack videos captured in one
scenario. For our evaluation purpose, as done with the
previous database, the video attacks have been
considered to be genuine users. Thus, only the printed
photo attacks are considered to be fake users.
Moreover, 12 videos were removed from the dataset,
due to the fact, that the faces were upside down and
therefore not relevant for us. In sum 268 (198
BIOSIGNALS 2017 - 10th International Conference on Bio-inspired Systems and Signal Processing
152
genuine, 70 fake) video clips were used in total.
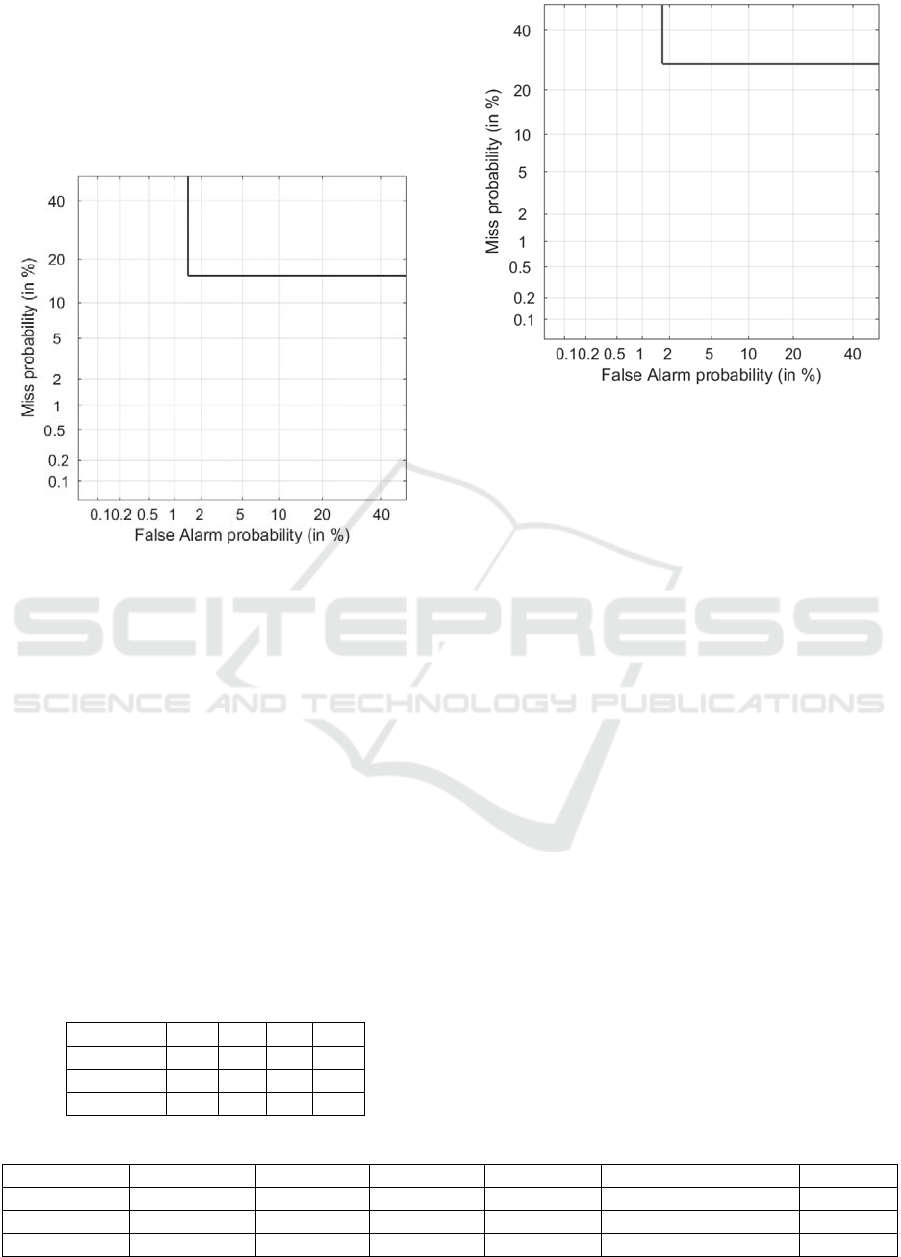
The results are shown in Table 3+4 and
graphically represented in Figure 10. As it can be
seen, the FN rises compared to the CASIA database
(~18%). This effect can be explained by short videos
without the presence of life signs (no blinking,
smiling, speaking) being part of the database.
Figure 10: DET curve plotting for the MSU database.
C) IDIAP
The IDIAP face spoofing replay-attack database
consists of 1300 video clips of photo and video attack
attempts to 50 clients, under different lighting
conditions (Chingovska et al, 2012). All videos are
generated by either having a real client trying to
access a laptop through a built-in webcam or by
displaying a photo or a video recording of the client.
For our evaluation purpose, only the test set of
video clips, that contains 80 real-accesses and 400
video and photo attacks under different lighting
conditions, was used. Results are presented both
numerically and graphically in Table 3+4 and Figure
11. Analogical to the MSU database, the FN rate is
increased (~28%), due to the nonexistence of life
signs in many of the video clips.
Table 3: Confusion matrix results of the PAD method.
Database TN FN FP
TP
CASIA 78 4 9 179
MSU 69 31 1 167
IDIAP 172 67 4 234
Figure 11: DET curve plotting for the IDIAP database.
D) Comparison of our method
In contrast to the blinking rate, a direct comparison
with other PAD techniques in numbers is not as
meaningful, due to the non-unified and ambiguous
metrics, as well as the fact that our evaluating tests
were performed with a slightly different focus, since
our aim was to supplement a PPGI monitoring
system. Thus, requirements of our aim system slightly
varied compared to other projects. For this reason the
IDIAP database, for instance, turned out to be more
challenging due to the lack of life sign motion.
Although not comparing results in numbers at this
point, some qualitative statements can be made. The
evaluation results prove the approach to be well
suited for our application scenarios. The method was
integrated in our online PPGI algorithm as PAD
system to prevent false detections. With an average
computation time of 0.0037s in Matlab on a standard
Windows PC (i5) the method meets the low-cost
criteria. Therefore our approach shows its practical
importance for face tracking based applications, since
it is built on an efficient and resource-saving method.
In general, performances below 10% (HTER) were
achieved, so these good results, compared to state of
the art (Wen et al, 2015), prove that the approach is
also suitable for other types of applications.
Table 4: Performance percentage results of the PAD method for the databases CASIA, MSU, IDIAP.
Database Precision Recall FP Rate FN Rate Mean Accuracy HTER
CASIA 95,21% 97,81% 10,34% 2,13% 99,81% 6,27%
MSU 99,40% 84,34% 1,43% 18,45% 88,06% 8,54%
IDIAP 97,73% 71,97% 1,68% 28,15% 85,12% 14,85%
A Low-cost Life Sign Detection Method based on Time Series Analysis of Facial Feature Points
153

5 CONCLUSIONS
Face detection and tracking are crucial technologies
for applications in the fields of security, health care
and others. However, such systems are vulnerable to
false detections or spoof attacks made by non-real
faces using photograph, video or mask attacks.
Therefore, PAD strategies are needed to close this gap
for systems in face recognition contexts.
In this paper, we introduced a new, effective and
low-cost PAD addressing the problem of face anti-
spoofing and false detection errors with life sign
detection techniques as supplement for a camera-
based vital sign monitoring system. Thus, inherent
characteristics of a live face like blinking, speaking
and smiling were exploited using peak descriptors
and cross-correlation coefficients as classifiers for
time series analysis. For the classification a sliding
time windows of 5 seconds was used.
The presented method has the advantage of being
highly secure against 2D image or 3D sculpture spoof
attacks, though at a much lower computational cost
than traditional techniques (average runtime of
0.0037s in Matlab on a standard Windows PC). This
enables the integration of the anti-spoofing method in
our PPGI algorithm and possible future porting on
embedded systems that use simple, energy-efficient
and inexpensive CPU. This would provide a resource-
saving biometric method for cars, TV sets and other
devices.
Experimental results on three challenging
spoofing databases, (CASIA, MSU and IDIAP
Replay-Attack) proof, that the proposed PAD
algorithm is able to detect spoofing attacks with good
accuracy (~85-95%). Moreover, the blinking
detector’s performance evaluation showed very
promising results. We achieved results comparable to
the state-of-the-art (99,8% of Mean Accuracy) on
ZJU datasets and even better results (99,9% of Mean
Accuracy) on the Talking dataset.
Thus, these results prove the effectiveness of the
distinction between genuine and fake faces in
scenarios derived from everyday life situations. In
particular, the proposed face liveness detection
method is well suited to detect the realness of persons
in camera based systems aiming to derive signals
from a person’s face, like vital signs or facial
expressions.
REFERENCES
Anjos, A. et al., 2014. Motion-based countermeasures to
photo attacks in face recognition. IET Biometrics Vol.
3, no. 3, pp. 147–158.
Bentivoglio, A.R. et al., 1997, Analysis of blink rate
patterns in normal subjects. Movement Disorders, Vol.
12 (6), pp. 1028-34.
Blöcher, T. et al., 2014, Towards camera based extraction
of physiological signals for automotive applications.
BMT Hannover.
Chakraborty, S. and Das, D., 2014, An overview of face
liveness detection. International Journal on Information
Theory (IJIT), Vol.3, No.2.
Chingovska, I., et al., 2012, On the Effectiveness of Local
Binary Patterns in Face Anti-spoofing. IEEE
Biometrics Special Interest Group (BioSIG).
Deniz, O. et al., 2008, Smile Detection for User Interfaces,
Advances in Visual Computing. Vol. 5359, pp. 602-
611, Lecture Notes in Computer Science, Springer.
Divjak, M. and Bischof, H., 2009, Vision-based prevention
of work-related disorders in computer users (PRE-
WORK). Institute for Computer Graphics and Vision,
Graz University of Technology.
Drutarovsky, T. and Fogelton, A., 2014, Eye Blink
Detection using Variance of Motion Vectors. Computer
Vision - ECCV Workshops.
Garud, D. and Agrawal, S.S., 2016, A Review: Face
Liveness Detection. International Journal of Advanced
Research in Computer and Communication
Engineering, Vol. 5, Issue 1.
Kähm, O. and Damer, N., 2011, 2D Face Liveness
Detection: an Overview. Fraunhofer Institute for
Computer Graphics Research (IGD).
Kim. G. et al., 2012, Face Liveness Detection Based on
Texture and Frequency Analyses. IEEE 5th IAPR
International Conference on Biometrics (ICB).
Maatta, J. et al., 2011, Face Spoofing Detection From
Single images Using MicroTexture Analysis. Proc. Intn
Joint Conference on Biometrics.
Pan G. et al., 2007, Eyeblink-based anti-spoofing in face
recognition from a generic webcamera. IEEE 11th
International Conference on Computer Vision (ICCV).
Parveen S. et al, 2015, Face anti-spoofing methods, Current
Science Review Articles, Vol. 108, No. 8.
Wen, D. et al., 2015, Face Spoof Detection with Image
Distortion Analysis. IEEE Transactions on Information
Forensics and Security.
Xiong, X. and De la Torre, F., 2013, Supervised Descent
Method and its Application to Face Alignment. IEEE
Conference on Computer Vision and Pattern
Recognition (CVPR).
Zhang, Z. et al., 2012, A face antispoofing database with
diverse attacks, 5th IAPR International Conference on
Biometrics (ICB).
PRIMA, 2000, Talking Face Video. Face&Gesture
Recognition Working group, http://www-
prima.inrialpes.fr/FGnet/data/01-
TalkingFace/talking_face.html.
National Institute of Standards and Technology (NIST),
2007, DETware, http://www.itl.nist.gov/iad/mig/tools/
BIOSIGNALS 2017 - 10th International Conference on Bio-inspired Systems and Signal Processing
154
