
Modeling of Cardiac Component of Subarachnoid Space Changes in
Apnoea Resulting as a Function of Blood Pressure and Blood Flow
Parameters
Two Mechanizm of Regulation
Kamila Mazur
1
, Renata Kalicka
1
, Andrzej F. Frydrychowski
2
and Pawel J. Winklewski
2
1
Department of Biomedical Engineering, Faculty of Electronics, Telecommunications and Informatics,
Gdańsk University of Technology, Narutowicza 11/12, Gdańsk, Poland
2
Institute of Human Physiology, Medical University of Gdansk, Gdansk, Poland
Keywords: Subarachnoid Space Width, Pial Artery, Brain Haemodynamics, Apnea, NIR-T/BSS.
Abstract: Experiments were performed in a group of 19 healthy, non-smoking volunteers. The experiment consisted
of three apnoeas, sequentially: 30 s apnoea, 60 s apnoea and maximal, that could be done, apnoea. The
breath-hold was separated for 5 minutes rest. The following parameters were measured and obtained for
further analysis: blood parameters, artery diameter of the internal carotid artery, end-tidal CO
2
in expired
air, the cardiac (from 0.5 to 5.0 Hz) and slow (< 0.5 Hz) components of subarachnoid space width signal. As
a result of the experiment, we observed two different reactions, using the same experimental procedure. It
seemed to indicate two different operating modes and two separate models. As a consequence, there are two
subsets of slow subarachnoid space width responses to breath-hold in humans. A positive subarachnoid
space width changes (slow) component depends on changes in heart rate, pulsatility index and cerebral
blood flow velocity. A negative subarachnoid space width changes component is driven by heart rate
changes and pulsatility index changes. The different heart-generated arterial pulsation response to
experimental breath-hold provides new insights into our understanding of the complex mechanisms
governing the adaptation to apnoea in humans. We propose a mathematical methodology that can be used in
further clinical research.
1 INTRODUCTION
In medicine, there is an unmet need for continuous
monitoring of subarachnoid space (SAS) width
changes. The subarachnoid space (subarachnoid
cavity) is a part of the central nervous system. It is
small region on the surface of the hemispheres of the
brain (the anatomic space between the arachnoid
mater and the pia mater). It is filled by the
cerebrospinal fluid (the same is in the spinal cord).
The subarachnoid space is the location of the
interface between the vascular tissue and the
cerebrospinal fluid and is active in the blood brain
barrier (Drake et al., 2009), (Winklewski et al.,
2013), (Winklewski, 2015), (Wszedybyl-
Winklewska et al., 2015).
Some efforts are undertaken to link changes in
SAS width with changes in pressure and speed of
blood. Showing signs of future success, is direction
of research using results obtained by near-infrared
transillumination/backscattering sounding, i.e. NIR-
T/BSS. This is new, non-invasive method, which
allows to assessment of pial artery pulsation (it is
based on infrared radiation IR). In contrast to near-
infrared spectroscopy (NIRS), which relies on the
absorption of IR by haemoglobin, NIR-T/BSS uses
the subarachnoid space (SAS), which is filled with
translucent cerebrospinal fluid, as a propagation duct
for IR. Thus, NIR-T/BSS allows continuous
observation of SAS width changes (Winklewski et
al., 2015c).
The whole NIR-T/BSS signal (TQ) was
expressed in form of two components: a fast - the
cardiac component (ccTQ) and a slow - the
subarachnoid space component (sasTQ)
(Frydrychowski et al., 2002), (Frydrychowski and
Plucinski, 2007).
140
Mazur K., Kalicka R., Frydrychowski A. and Winklewski P.
Modeling of Cardiac Component of Subarachnoid Space Changes in Apnoea Resulting as a Function of Blood Pressure and Blood Flow Parameters - Two Mechanizm of Regulation.
DOI: 10.5220/0006139901400147
In Proceedings of the 10th International Joint Conference on Biomedical Engineering Systems and Technologies (BIOSTEC 2017), pages 140-147
ISBN: 978-989-758-214-1
Copyright
c
2017 by SCITEPRESS – Science and Technology Publications, Lda. All rights reserved

The subject of interest in the paper is a
dependence between the cardiac component (ccTQ),
subarachnoid space component (sasTQ) and blood
parameters observed in apnoea experiment. This
dependence allowed to model ccTQ or sasTQ as a
function of cardiac parameters.
2 MATERIALS AND METHODS
The experimental protocol and the study were
approved by the Ethics Committee of the Medical
University of Gdansk (NKEBN/48/2011).
Experiments were performed in a group of 20
healthy, nonsmoking volunteers. One of the
volunteers was rejected on formal grounds and the
results from 19 volunteers have been analyzed. All
individuals gave written informed consent to
participate in the study. Nicotine, coffee, tea, cocoa
and methylxanthine- containing food and beverages
were not permitted for 8 h before the tests. In
addition, prior to each test, the volunteers were
asked to rest comfortably for 30 min in the supine
position. To avoid any air leakage during the
experiment, individuals were equipped with a nose
clip and were instructed to hold their lips closed.
Each apnea was initiated at the end-phase of a
normal inspiration, and a special emphasis was put
on avoiding enhanced inspiration. In addition,
individuals were asked not to hyperventilate before
each apnea testing.
Experiment consist of 3 following apnoeas: 30s
breath-hold, 60s breath-hold and maximal breath-
hold. Apneas were separated by 5 min rest intervals.
The following signals were measured:
ccTQ - changes in the cardiac component of
SAS oscillations, resulting from heart-
generated arterial pulsation (from 0.5 to 5.0
Hz) by NIR-T/BSS with a headmounted SAS
100 Monitor (NIRTI SA; Wierzbice, Poland);
sasTQ - changes in slow component (< 0.5
Hz) of SAS oscillations by NIR-T/BSS with a
headmounted SAS 100 Monitor (NIRTI SA;
Wierzbice, Poland);
SP and DP - systolic and diastolic blood
pressure by Finometer; Finapres Medical
Systems, Arnhem, the Netherlands;
HR - heart rate by Finometer; Finapres
Medical Systems, Arnhem, the Netherlands;
CBFV - mean cerebral blood flow velocity in
the internal carotid artery by Doppler
ultrasound (Vivid 7; GE Healthcare; Little
Chalfont, UK);
RI - resistivity index of the internal carotid
artery by Doppler ultrasound (Vivid 7; GE
Healthcare; Little Chalfont, UK)
PI - pulsatility index of the internal carotid
artery by Doppler ultrasound (Vivid 7; GE
Healthcare; Little Chalfont, UK);
d - artery diameter of the internal carotid
artery by Doppler ultrasound (Vivid 7; GE
Healthcare; Little Chalfont, UK);
SaO
2
- blood oxygen saturation by ear-clip
sensor Massimo Oximeter; Massimo, Milano,
Italy;
EtCO
2
- the end-tidal CO
2
in expired air by a
mouthpiece gas analyzer (PNT Digital M.E.C.
Group, Brussels, Belgium.
The measurements were used to calculate mean
arterial pressure (MAP) defined as weighted mean of
the systolic (SP) and diastolic (DP) blood pressure
during a single cardiac cycle (Kaźmierski, 2011):
3
DP2SP
MAP
(1)
During the experiment, the measurements were
taken in 4 time points (except of EtCO
2
and d, which
were measured only twice): t1 - baseline
measurement, t2 - start of apnoea measurement, t3 -
end of apnoea measurement and t4 - recovery
measurement. The time points form the vector t:
4321j,tjt4t3,t2,t1, ,,,
t
(2)
All parameters, measured and calculated, were
arranged in the form of parameter vector w:
12,...,2,1i,w
]w,w,w,w
,w,w,w,w,w,w,w,w[
] EtCO,SaO d, PI,
RI,CBFV, HR, MAP, DP,SP, sasTQ, ccTQ,[
i
1211109
87654321
22
w
w
(3)
The parameters were obtained for 19 patients in
3 different apnoeas, so we analyzed 57 different
cases.
To observe the dynamics of w
i
change, the
differences between parameters value measured in
two time points of experiment, i.e. w
i
tj
and w
i
tξ
,
were analysed. To choose the most significant
change the Δ
jξ
w
i
, it was required to determine the
pair of experiment time points, which is the most
informative. Due to, the null hypothesis H
0
was
developed:
Modeling of Cardiac Component of Subarachnoid Space Changes in Apnoea Resulting as a Function of Blood Pressure and Blood Flow
Parameters - Two Mechanizm of Regulation
141

j 2,3,4 1,2,3,4j
,ww:H
mean
t
i
mean
tj
i0
(4)
for normally distributed w
i
(the t-test was used),
and:
j 2,3,4 1,2,3,4j
,ww:H
median
t
i
median
tj
i0
(5)
for not normally distributed w
i
(the Wilcoxon
test was used). The normal distribution of data was
tested by Shapiro-Wilk test (Kalicka, 2014).
The testing results are presented in Table 1. The
Table 1 shows that differences between the baseline
measurement and the end of apnoea measurement
are the most informative. So, we analysed new data
set: Δ
13
w
i
= w
i
3
- w
i
1
. Spearman’s rank correlation
analysis proved that it is possible to create a model
for Δ
13
ccTQ in form of mathematical, monotonic
relationship. The coefficient of determination R
2
ranges from 0.4 to 0.6. The functional dependence
was a moderately good. Still we were looking for a
better functional relationship.
Next step was clustering. Cluster analysis is the
task of grouping a set of objects in such way that
objects in the same group (cluster) are more similar
(in some sense or another) to each other than to
those in other groups (clusters) (Everitt et al., 2001).
One of agglomerative hierarchical clustering
method is complete linkage clustering. At the
beginning of this method, each element is in a
cluster of its own. The clusters are then sequentially
combined into larger clusters until all elements end
up being in the same cluster. At each step, the two
clusters separated by the shortest distance are
combined. The definition of 'shortest distance' is
what differentiates between the different
agglomerative clustering methods (for example
Chebyshev distance). In complete-linkage
clustering, the link between two clusters contains all
element pairs, and the distance between clusters
equals the distance between those two elements (one
in each cluster) that are farthest away from each
other. The shortest of these links that remains at any
step causes the fusion of the two clusters whose
elements are involved. The method is also known as
farthest neighbour clustering. The result of the
clustering can be visualized as a dendrogram (see
Figure 1), which shows the sequence of cluster
fusion and the distance at which each fusion took
place (Everitt et al., 2001), (Stanisz, 2007).
For separation data in data set was used complete
linkage with Chebyshev distance. Based on this
agglomerative hierarchical clustering method (see
Figure 1), Δ
13
ccTQ was divided into two groups:
left cluster: all situated on the left side on
cluster analysis tree diagram, further referred
to as Δ
13
ccTQ
left cluster
;
right cluster: all situated on the right side on
cluster analysis tree diagram, further referred
to as Δ
13
ccTQ
right cluster
.
We took a guess that the groups should be
considered separately. Two different reactions for
the same course of experiment seem to indicate two
different operating modes and two different models.
Two different models were designed (to validate
the coefficient of determination was used): for left
cluster Δ
13
ccTQ
left cluster
and for right cluster
Δ
13
ccTQ
right cluster
.
When R
2
>0.7 the functional dependence is said
to be very good (Kalicka, 2013).
3 RESULTS
The results of the Wilcoxon test (for not normally
distributed w
i
) and t-test (for normally distributed
w
i
) are presented in Table 1. Pairs of w
i
which are
statistically significant are in shaded cells.
The Table 1 shows that differences between the
baseline measurement and the end of apnoea
measurement are the most informative. So, we
analysed new data set: Δ
13
w
i
= w
i
3
- w
i
1
.
Based on the cluster analysis (complete linkage,
Chebyshev distance, see Figure 1), Δ
13
ccTQ was
divided into two groups:
left cluster Δ
13
ccTQ
left cluster
, where
Δ
13
sasTQ<0, contained 29 cases under test
right cluster Δ
13
ccTQ
right
cluster
, where
Δ
13
sasTQ>0, contained 22 cases under test.
Six cases were rejected as impossible to classify.
Two different models were designed and two
coefficients of determination were obtained:
R
2
=0.7579 for Δ
13
ccTQ
left cluster
,
R
2
=0.7007 for Δ
13
ccTQ
right cluster
.
Coefficient of determination was R
2
>0.7, so the
models were satisfactory.
BIOINFORMATICS 2017 - 8th International Conference on Bioinformatics Models, Methods and Algorithms
142
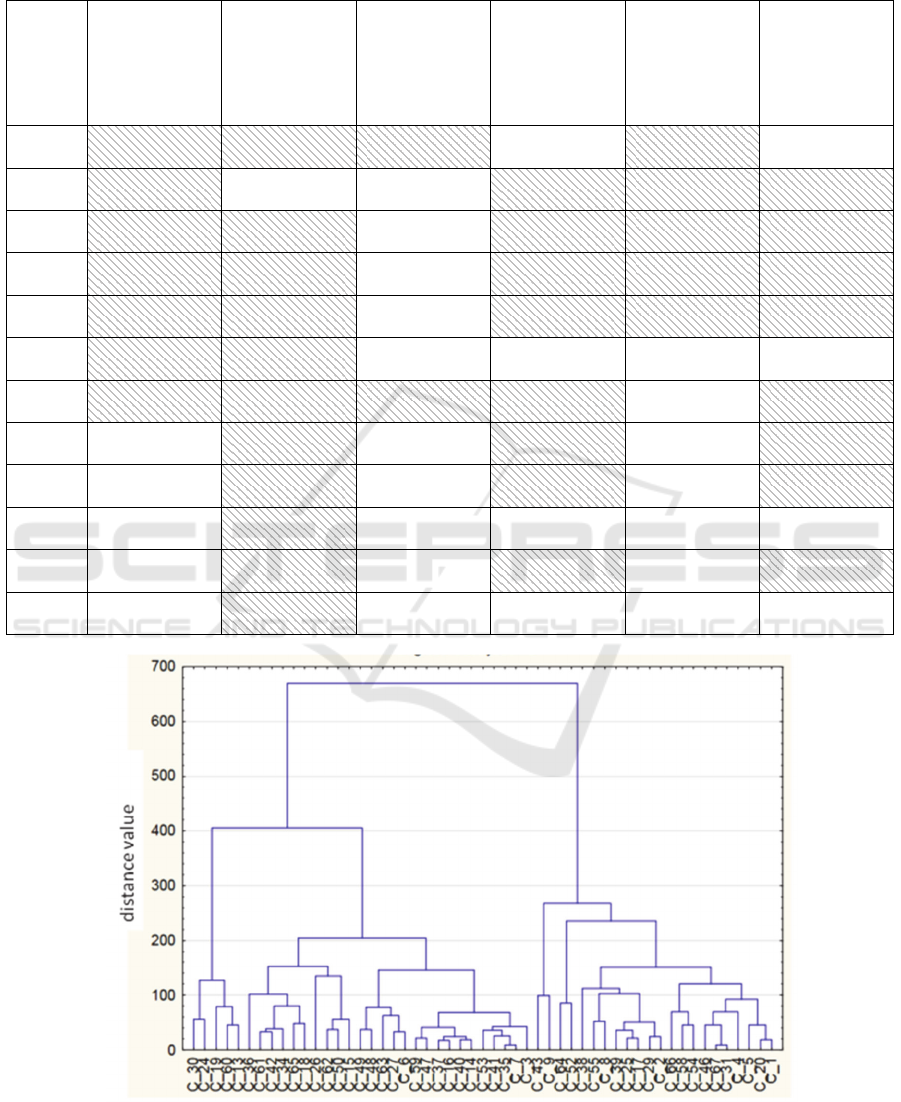
Table 1: Statistical significance level p between w
i
tj
and w
i
tξ
. For normally distributed measurements t-test was applied,
otherwise when normal distribution condition was not satisfied, the Wilcoxon test was used (W test). Pairs of w
i
which are
statistically significant are in shaded cells.
baseline
measurement
→ start of
apnea
measurement
t1→t2
baseline
measurement
→ end of
apnea
measurement
t1→t3
baseline
measurement
→ recovery
measurement
t1→t4
start of
apnea
measurement
→ end apnea
measurement
t2→t3
start of
apnea
measurement
→ recovery
measurement
t2→t4
end of
apnea
measurement
→ recovery
measurement
t3→t4
w
1
(ccTQ)
W test
p<0.01
W test
p<0.01
W test
p<0.01
W test
p>0.01
W test
p<0.01
W test
p>0.01
w
2
(sasTQ)
W test
p<0.01
W test
p>0.01
W test
p>0.01
W test
p<0.01
W test
p<0.01
W test
p<0.01
w
3
(SP)
t-test
p<0.01
t-test
p<0.01
t-test
p>0.01
t-test
p<0.01
t-test
p<0.01
t-test
p<0.01
w
4
(DP)
t-test
p<0.01
t-test
p<0.01
t-test
p>0.01
t-test
p<0.01
t-test
p<0.01
t-test
p<0.01
w
5
(MAP)
W test
p<0.01
W test
p<0.01
W test
p>0.01
W test
p<0.01
W test
p<0.01
W test
p<0.01
w
6
(HR)
W test
p<0.01
W test
p<0.05
W test
p>0.01
W test:
p>0.01
W test
p>0.01
W test
p>0.01
w
7
(CBFV)
t-test
p<0.01
W test
p<0.01
W test
p<0.01
W test
p<0.01
W test
p>0.01
W test
p<0.01
w
8
(RI)
t-test
p>0.01
t-test
p<0.01
t-test
p>0.01
t-test
p<0.01
t-test
p>0.01
t-test
p<0.01
w
9
(PI)
t-test
p>0.01
W test
p<0.01
W test
p>0.01
W test
p<0.01
W test
p>0.01
W test
p<0.01
w
10
(d)
W test
p<0.01
w
11
(SaO
2
)
W test
p>0.01
W test
p<0.01
W test
p>0.01
W test
p<0.01
W test
p>0.01
W test
p<0.01
w
12
(EtCO
2
)
t-test
p<0.01
Figure 1: Data selection using a tree diagram (complete linkage, Chebyshev distance) on the left and right cluster. Symbols
from C_1 to C_67 are consecutive numbers of data measurements. Symbols C_10, C_11, C_21, C_22, C_32, C_33, C_44,
C_45, C_56 and C_57 are empty and do not take part in the analysis. There are results of data pre-processing.
Modeling of Cardiac Component of Subarachnoid Space Changes in Apnoea Resulting as a Function of Blood Pressure and Blood Flow
Parameters - Two Mechanizm of Regulation
143

The analysis showed that Δ
13
ccTQ
left cluster
depends on heart rate and pulsatility index changes:
PIΔHR,ΔccTQΔ
1313left
clusterleft
13
f
(6)
The extract model function is as follows:
0PIΔ , RPIΔ
0,HRΔ , RHRΔ
0.1896HRΔ10184.2
HRΔ
012.67
HRΔ10080.1HRΔ10243.7
PIΔ858.59HRΔ374.1ccTQΔ
1313
1313
5
13
8
13
4
13
52
13
2
1313
clusterleft
13
(7)
Figure 2 shows model function Δ
13
ccTQ
left cluster
which presents significant variability with changes
of heart rate and pulsatility index. The control
process undoubtedly is sophisticated. There are
probably internal cross-couplings and cross-
dependences. In consequence the function
Δ
13
ccTQ
left cluster
shows a couple of maxima.
The Δ
13
ccTQ
right cluster
depends on heart rate,
pulsatility index and mean cerebral blood flow
velocity changes:
CBFVΔPI,ΔHR,Δ
ccTQΔ
131313right
clusterright
13
f
(8)
One can see that Δ
13
ccTQ
left cluster
and
Δ
13
ccTQ
right cluster
depend on partially overlapping
variable sets, which suggest a different working
principles. The obtained regression function and
Δ
13
ccTQ
right cluster
is as follows:
0PIΔ R,PIΔ
RCBFVΔ
0HRΔ R,HRΔ
43900.0CBFVΔ4531.0
CBFVΔ10975.5
CBFVΔ428.7HRΔ9281.0
PIΔ
107.1
HRΔ
386.51
ccTQΔ
1313
13
1313
2
13
3
13
3
1313
1313
clusterright
13
(9)
Drawing the Δ
13
ccTQ
right cluster
requires using the
4-dimensional space. Instead we choose one of the
variables (Δ
13
PI) as a parameter for the chart. Figure
3 shows a parametric graph of Δ
13
ccTQ
right cluster
changes for Δ
13
PI= -0.8.
Δ
13
ccTQ
right cluster
depends on heart rate changes
(Δ
13
HR), mean cerebral blood flow velocity changes
(Δ
13
CBFV) and pulsatility index changes (Δ
13
PI).
Measured values of Δ
13
ccTQ
right cluster
were from -
22.5 to 107.0 a.u.
Comparing Δ
13
ccTQ
left cluster
and Δ
13
ccTQ
right cluster
are observed two different modes of regulation: for
Δ
13
sasTQ>0 and Δ
13
sasTQ<0 (see Figure 4). The
sasTQ
0
is the initial value of sasTQ, before the
experiment starts. The scale is expressed in the
arbitrary units (a.u.).
Figure 2: Δ
13
ccTQ
left cluster
[a.u.] versus Δ
13
HR [beats/min] and Δ
13
PI [1] drawn for an experimental range of variables,
excluding Δ
13
HR=0.
BIOINFORMATICS 2017 - 8th International Conference on Bioinformatics Models, Methods and Algorithms
144
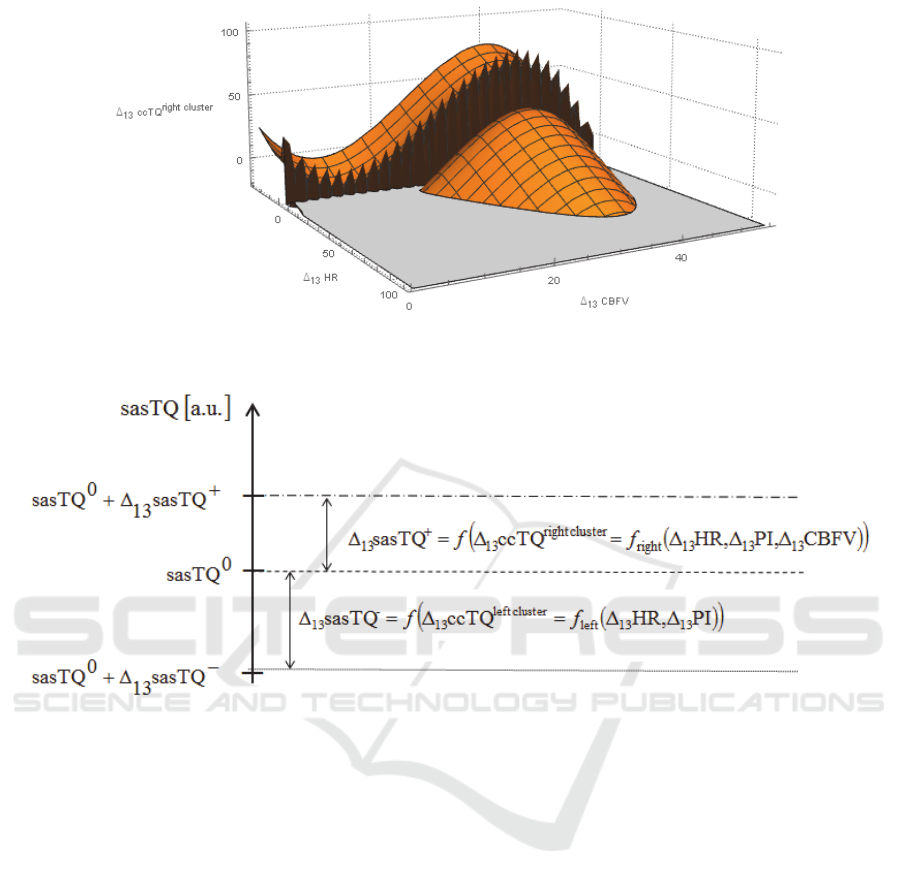
Figure 3: Parametric graph of Δ
13
ccTQ
right cluster
[a.u.] versus Δ
13
HR [beats/min] and Δ
13
CBFV [cm/s] drawn for
experimental range of the variables and Δ
13
PI= -0.8, excluding Δ
13
HR=0.
Figure 4: sasTQ response to apnoea. The initial value of sasTQ
0
, as a result of the experiment, increases or decreases in
dependence of ccTQ
right cluster
or ccTQ
left cluster
. The scale is expressed as arbitrary units (a.u.).
As a result of the experiment with apnea, the
initial value sasTQ
0
changes and reaches new level:
sasTQ
-
which depends on heart rate changes and
pulsatility index changes or sasTQ
+
which depends
on heart rate changes, pulsatility index changes and
mean cerebral blood flow velocity changes.
4 DISCUSSION
There are two main findings of this study: 1) the
fast-variable component of SAS oscillations (from
0.5 to 5.0 Hz) is predominantly related to heart rate
2) there are two different subsets of cardiac SAS
responses to breath-hold in humans.
The NIR-T/BSS model is based on the
assumption that ccTQ is a result of heart-generated
arterial pulsation (Frydrychowski et al., 2002),
(Frydrychowski and Plucinski, 2007). Although the
assumption is intuitive and in accordance with
existing physiological knowledge (Linninger et al.,
2005), (Wagshul et al., 2011), it has never been
confirmed mathematically. Therefore, this study is
the first to show that changes in ccTQ (plus and
minus) depend on changes in heart rate (HR) and
pulsatility index (PI).
During breath-hold, there is a powerful and
differentiated activation of the sympathetic and
parasympathetic nervous system (Foster and Sheel,
2005), (Paton et al., 2005), (Winklewski et al.,
2013). Increased sympathetic drive may actually
strengthen the myogenic response to elevated blood
pressure through the addition of a neurogenic
component (Cassaglia et al., 2008), (Cassaglia et al.,
2009) and further protect the pial artery from
vasodilation caused by apnoea-driven hypercapnia
and subsequent acidosis (Winklewski et al., 2015b).
Intense peripheral vasoconstriction, bradycardia,
increased blood pressure and cerebral perfusion
maintain adequate oxygenation of the heart and
Modeling of Cardiac Component of Subarachnoid Space Changes in Apnoea Resulting as a Function of Blood Pressure and Blood Flow
Parameters - Two Mechanizm of Regulation
145

brain at the expense of organs less sensitive to
hypoxia. This increase in cerebral perfusion is
partially independent of the partial pressure of CO
2
(Reis et al., 1997).
Differentiated heart-generated arterial pulsation
in response to experimental breath-hold may
partially explain the variability in tolerance to
apnoea, hypercapnia and hypoxia observed in
normal subjects.
The high within- and between-subject
reproducibility and repeatability of NIR-T/BSS
measurements have been demonstrated earlier
(Frydrychowski et al., 2002). NIR-T/BSS, like
NIRS, allows for direct within-subject comparisons
(Frydrychowski et al., 2002), (Wagner et al., 2003).
As long as changes from baseline values are
analysed, high between-subject reproducibility is
observed. However, measurements with the use of
infrared light do not allow for direct comparisons
between subjects due to differences in skull bone
parameters (Frydrychowski et al., 2002), (Wagner et
al., 2003).
5 CONCLUSION
The analysis showed that Δ
13
sasTQ>0 depends on
heart rate changes (Δ
13
HR), mean cerebral blood
flow velocity changes (Δ
13
CBFV) and pulsatility
index changes (Δ
13
PI) and Δ
13
sasTQ<0 depends on
heart rate changes (Δ
13
HR) and pulsatility index
changes (Δ
13
PI). This finding indicates two different
modes of regulation.
Using mathematical modeling, we verified the
assumption that ccTQ is predominantly heart-
determined. This is an important step in the further
development of NIR-T/BSS technology toward its
clinical application. Furthermore, the variable heart-
generated arterial pulsation response to experimental
breath-hold described in this study provides new
insights into our understanding of the complex
mechanisms governing adaptation to apnoea in
humans. Finally, we propose a mathematical
methodology that can be used in further clinical
research aimed at the development of personalized
markers that will enable better diagnosis.
REFERENCES
Cassaglia, P. A., Griffiths, R. I., Walker, A. M., 2008.
Sympathetic nerve activity in the superior cervical
ganglia increases in response to imposed increases in
arterial pressure. American Journal of Physiology.
Regulatory, Integrative and Comparative Physiology.
294: R1255–61.
Cassaglia, P. A., Griffiths, R. I., Walker, A. M., 2009.
Cerebral sympathetic nerve activity has a major
regulatory role in the cerebral circulation in REM
sleep. Journal of Applied Physiology. 106: 1050–6.
Drake, R., Vogl, A. W., Mitchell, A. W. M., 2009. Gray's
Anatomy for Students. Elsevier Health Sciences.
Everitt, B. S., Landau, S., Leese, M., 2001. Cluster
Analysis (Fourth ed.). Arnold, London.
Frydrychowski, A. F., Gumiński, W., Rojewski, M.,
Kaczmarek, J., Juzwa, W., 2002. Technical
foundations for noninvasive assessment of changes in
the width of the subarachnoid space with near-
infrared transillumination-backscattering sounding
(NIR-TBSS). IEEE Transactions on Biomedical
Engineering. 49, 887-904.
Frydrychowski, A. F., Pluciński, J., 2007. New aspects in
assessment of changes in width of subarachnoid space
with near-infrared transillumination-backscattering
sounding, part 2: clinical verification in the patient.
Journal of Biomedical Optics. 12, 044016.
Foster, G.E., Sheel, A.W., 2005. The human diving
response, its function, and its control. Scandinavian
Journal of Medical Science in Sports. 15, 3–12.
Jolly, T. A., Bateman, G. A., Levi, C. R., Parsons, M. W.,
Michie, P. T., Karayanidis, F., 2013. Early detection
of microstructural white matter changes associated
with arterial pulsatility. Frontiers in Human
Neuroscience. 7, 782.
Kalicka, R., 2014. Basics of data analysis, Gdańsk
University of Technology Publishing, Gdańsk.
Kalicka, R., 2013. Mathematical Modeling of Physio
logical Systems to Aid in Diagnosis and Therapy.
Academic Publishing House EXIT, Warsaw.
Kaźmierski, R., 2011. Podręczniki diagnostyki
ultrasonograficznej w neurologii. Czelej.
Li, Z., Zhang, M., Xin, Q., Li, J., Chen, G., Liu, F., Li, J.,
2011. Correlation analysis between prefrontal
oxygenation oscillations and cerebral artery
hemodynamics in humans. Microvascular Research.
82, 304-10.
Linninger, A. A., Tsakiris, C., Zhu, D. C., Xenos, M.,
Roycewicz, P., Danziger, Z., Penn, R., 2005. Pulsatile
cerebrospinal fluid dynamics in the human brain.
IEEE Transactions on Biomedical Engineering. 52,
557–565.
Mazur, K., Kalicka, R., 2014. Modeling of subarachnoid
space width changes caused by blood circulation in
brain vessels. Proceedings of the Twentieth National
Conference on Applications of Mathematics in
Biology and Medicine.
Paton, J. F., Boscan, P., Pickering, A.E., Nalivaiko, E.,
2005. The yin and yang of cardiac autonomic control:
vago-sympathetic interactions revisited. Brain
Research Reviews. 49, 555–565.
Reis, D. J., Golanov, E. V., Galea, E., Feinstein, D. L.,
1997. Central neurogenic neuroprotection: central
neural systems that protect the brain from hypoxia and
BIOINFORMATICS 2017 - 8th International Conference on Bioinformatics Models, Methods and Algorithms
146

ischemia. Annals of the New York Academy of
Sciences. 835, 168-86.
Stanisz, A., 2007. Comprehensible statistics course using
STATISTICA.PL - examples from medicine, vol. 1.
Basic Statistics, vol. 2. Linear and non-linear models,
vol. 3. Multidimensional Analyses. StatSoft, Krakow.
Wagner, B.P., Gertsch, S., Ammann, R.A., Pfenninger, J.,
2003. Reproducibility of the blood flow index as
noninvasive, bedside estimation of cerebral blood
flow. Intensive Care Medicine. 29, 196–200.
Wagshul, M. E., Eide, P. K., Madsen, J. R., 2011. The
pulsating brain: A review of experimental and clinical
studies of intracranial pulsatility. Fluids Barriers
CNS. 8, 5.
Winklewski, P. J., Kot, J., Frydrychowski, A. F.,
Nuckowska, M. K., Tkachenko, Y., 2013. Effects of
diving and oxygen on autonomic nervous system and
cerebral blood flow. Diving and Hyperbaric Medicine
Journal. 43, 148-56.
Winklewski, P. J., Gruszecki, M., Wolf, J., Swierblewska,
E., Kunicka, K., Wszedybyl-Winklewska, M.,
Guminski, W., Zabulewicz, J., Frydrychowski, A. F.,
Bieniaszewski, L., Narkiewicz, K.. 2015. Wavelet
transform analysis to assess oscillations in pial artery
pulsation at the human cardiac frequency.
Microvascular Research. 99, 86-91.
Winklewski, P. J., Barak, O., Madden, D., Gruszecka, A.,
Gruszecki, M., Guminski, W., Kot, J., Frydrychowski,
A. F., Drvis, I., Dujic, Z., 2015 Effect of Maximal
Apnoea Easy-Going and Struggle Phases on
Subarachnoid Width and Pial Artery Pulsation in Elite
Breath-Hold Divers. PLoS One. 10, e0135429.
Winklewski, P. J., Tkachenko, Y., Mazur, K., Kot, J.,
Gruszecki, M., Guminski, W., Czuszynski, K.,
Wtorek, J., Frydrychowski, A. F., 2015. Sympathetic
Activation Does Not Affect the Cardiac and
Respiratory Contribution to the Relationship between
Blood Pressure and Pial Artery Pulsation Oscillations
in Healthy Subjects. PLoS One. 10(8):e0135751.
Wszedybyl-Winklewska, M., Wolf, J., Swierblewska, E.,
Kunicka, K., Gruszecki, M., Guminski, W.,
Winklewski, P. J., Frydrychowski, A. F.,
Bieniaszewski, L., Narkiewicz, K., 2015. Pial artery
and subarachnoid width response to apnoea in normal
humans. Journal of Hypertension. 33, 1811-7;
discussion 1817-8.
SOURCES OF FUNDING
This work was partially supported by funds of
Faculty of Electronics, Telecommunications and
Informatics, Gdańsk University of Technology.
Modeling of Cardiac Component of Subarachnoid Space Changes in Apnoea Resulting as a Function of Blood Pressure and Blood Flow
Parameters - Two Mechanizm of Regulation
147
