Nuclei Segmentation using a Level Set Active Contour Method and
Spatial Fuzzy C-means Clustering
Ravali Edulapuram
1
, R. Joe Stanley
1
, Rodney Long
2
, Sameer Antani
2
, George Thoma
2
,
Rosemary Zuna
3
, William V. Stoecker
4
and Jason Hagerty
1,4
1
Missouri University of Science and
Technology,
Department of Electrical and Computer Engineering, Rolla, MO,
U.S.A.
2
Lister Hill Center for Biomedical Communications, National Library of Medicine,
National Institutes of Health, Bethesda, MD, U.S.A.
3
University of Oklahoma, University of Oklahoma Health Sciences Center, Oklahoma City, OK, U.S.A.
4
Stoecker & Associates, Rolla, MO,
U.S.A.
{re5yb,
stanleyj, wvs, jrh55c}@mst.edu, {long, antani}@nlm.nih.gov, gthoma@mail.nih.gov, rosemary-zuna@ouhsc.edu
Keywords: Nuclei Segmentation, Level Set Method, Active Contours, Fuzzy C-means Clustering, Cervical Cancer,
Epithelium, Image Processing.
Abstract: Digitized histology images are analyzed by expert pathologists in one of several approaches to assess pre-
cervical cancer conditions such as cervical intraepithelial neoplasia (CIN). Many image analysis studies
focus on detection of nuclei features to classify the epithelium into the CIN grades. The current study
focuses on nuclei segmentation based on level set active contour segmentation and fuzzy c-means clustering
methods. Logical operations applied to morphological post-processing operations are used to smooth the
image and to remove non-nuclei objects. On a 71-image dataset of digitized histology images (where the
ground truth is the epithelial mask which helps in eliminating the non epithelial regions), the algorithm
achieved an overall nuclei segmentation accuracy of 96.47%. We propose a simplified fuzzy spatial cost
function that may be generally applicable for any n-class clustering problem of spatially distributed objects.
1 INTRODUCTION
The abnormal growth of squamous cells on the
surface of the cervix leads to cervical cancer. Study
of microscopic slides of cervical tissue allows early
detection of cancer. The thickness of the squamous
epithelium on the surface of the cervix and the
various nuclei features have been examined in
previous studies (Krishnan et al., 2012) to determine
the grades of cervical intraepithelial neoplasia
(CIN), a cervical cancer precondition. CIN grades
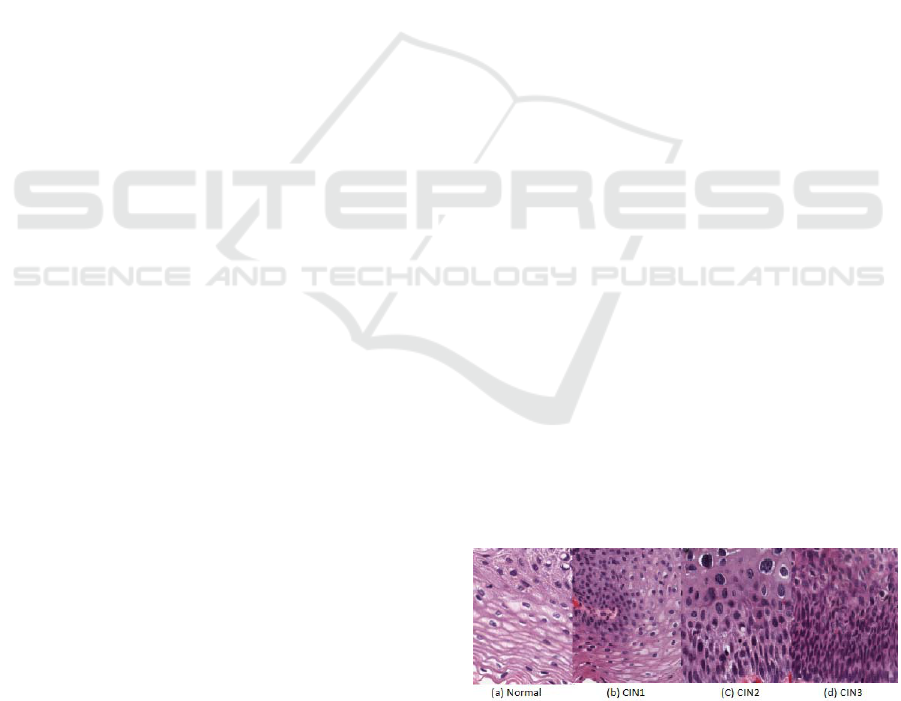
include Normal, CIN1, CIN2, and CIN3. CIN1
grade corresponds to initial human papilloma virus
(HPV) infection; CIN2 and CIN3 show increasing
density of nuclei, and increasing spread of the
abnormal area across the epithelium. Examples of
the CIN grades are shown in Figure 1.
Many algorithms have been implemented for the
extraction of nuclei features from cervix epithelial
tissue. Convolutional nets and graph partitioning
have been explored for the segmentation of the
nuclei and the cytoplasm (Song et al., 2015). This
combination has achieved an accuracy of 90.2%.
The accuracy of this algorithm is reduced in cases of
overlapping of nuclei or cytoplasm. Another
combination in this field uses the K-means
clustering for initial segmentation and superpixels
for the segmentation of cytoplasm and nucleus (Lu
et al., 2013). This paper addresses the segmentation
problem of the overlapping cervical cells and
achieves a comparably good accuracy using k-means
and superpixel segmentation methods.
Figure 1: Examples of Four CIN grades.
Other than segmentation, various selected features
can also be used for the classification of the images.
Fast morphological gray-scale transforms were used
Edulapuram R., Stanley R., Long R., Antani S., Thoma G., Zuna R., Stoecker W. and Hagerty J.
Nuclei Segmentation using a Level Set Active Contour Method and Spatial Fuzzy C-means Clustering.
DOI: 10.5220/0006136201950202
In Proceedings of the 12th International Joint Conference on Computer Vision, Imaging and Computer Graphics Theory and Applications (VISIGRAPP 2017), pages 195-202
ISBN: 978-989-758-225-7
Copyright
c
2017 by SCITEPRESS – Science and Technology Publications, Lda. All rights reserved
195
by (Walker et al., 1994) for the image classification.
This has utilized GLCM texture features for the
identification of traces of cancer, achieving good
accuracy and experimental results. Along with these
methods, image filtering with K-means clustering
for nuclei segmentation along with the other
combinational algorithms has been applied in other
nuclei studies (Guo et al., 2015) (Rahmadwati et al.,
2011)
. This paper introduces a level set algorithm in
combination with fuzzy clustering for the
segmentation of the nuclei.
1.1 Fuzzy Clustering and Level Set
Algorithm
The level set contour algorithm is combined with an
additional algorithm for accurate results. (Wang and
Pan, 2014) used the local correntropy-based K-
means along with the level set algorithm.
This algorithm helps in eliminating the complex
noise present. Similarly, this paper uses spatial fuzzy
c-means clustering for the initialization of the level
set parameters. These parameters change with
respect to the type of input image. Initially, the level
set method uses the level set function, which evolves
from the zero level set to the boundaries of the
object that is being segmented. This function is
restricted by the driving force. This force can be
either the inverse of the gradient of the image or a
Gaussian function which can be a positive constant
or a negative force based on the input image. The
driving force function is usually the gradient
function, because the gradient detects sharp intensity
changes in an image. The value of the gradient is
high at object edges, indicating a sharp change in
intensity. The contour is obtained based on the
driving force. A high driving force inside the object
allows the contour to expand, while a low driving
force at the object edges causes the contour
evolution to stop at the object boundaries (Phillips,
1999). In this paper the driving force is controlled
by the membership function. The proposed
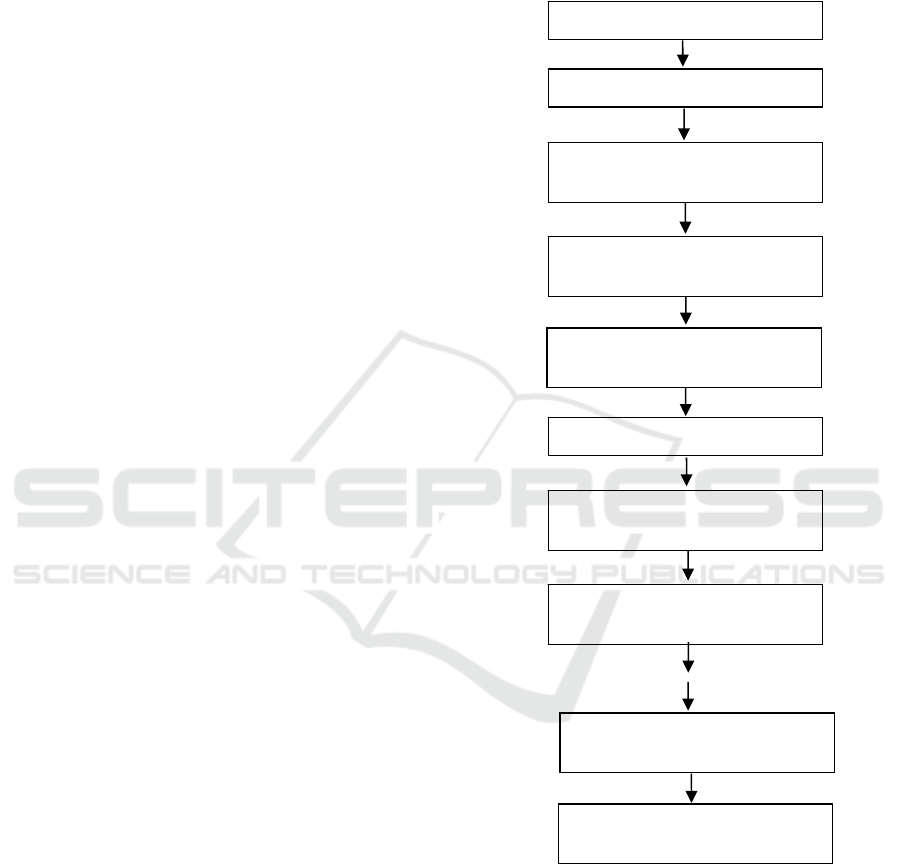
algorithm is shown in the Figure 2. These main steps
are explained in the next section.
2 PROPOSED ALGORITHM
2.1 Dataset Description
The images used for the segmentation of the nuclei
are from a 71-image dataset. These images are the
digitized histology images of hematoxylin and eosin
(H&E) glass slide preparations of uterine cervix
biopsy tissue. These images are initially masked to
eliminate non-epithelium regions. This masking is
done manually. An example input image and
associated mask are shown in Figure 3.
Figure 2: Sequential steps of the proposed algorithm.
2.2 Spatial Fuzzy C-means Clustering
As discussed above spatial information is included
in the membership function. The input image is the
masked RGB epithelium region from Figure 3 (RGB
image is masked with the binary image below) and
is used for modeling to include spatial information.
A gain field is introduced and is multiplied with
Digitized Histology Image
Manually mask epithelium region
Multiply final mask with original
image to obtain final nuclei mask
Combine all morphological
outputs
Calculate energy function
Obtain mask from contour and
apply morphological operations
Update membership function,
cluster centers and gain field
Initialize membership function,
cluster centroids and gain field
Multiply each pixel with the gain
field in a loop
Minimize energy function and
obtain contou
r
VISAPP 2017 - International Conference on Computer Vision Theory and Applications
196

Figure 3: The unmasked (top) and mask of the images of
the epithelium.
each and every pixel of the input image. This helps
in including the spatial information in each and
every pixel rather than using a confined window.
The equation for the modeling of the input image is
shown below (Balla-Arab et al., 2013).
=
,∀∈
1,2,3,…,
(1)
where
and
are the observed and the true
intensities of the pixel and
is the gain field for the
pixel of the image. N is the total number of
pixels present in that image. This modeled image is
then used for further analysis in place of the input
image. The cost function of this algorithm is
modified by introducing the modeled output in place
of the general input (
Lu, 2013)
. The general cost
function and the updated cost function
are
shown below.
=
−
(2)
′
=
/
−
(3)
As we can see, the parameter u indicates the
membership function and
indicates the centroid of
the
pixel, whereas the parameter ‘f’ indicates the
amount of fuzziness to be included for each and
every cluster. This value is obtained by applying the
algorithm on various inputs with various fuzziness
values. The final fuzzy value which is used in this
algorithm is 2. This parameter controls the amount
of fuzziness to be included in the cost function. This
helps in introducing the spatial information into the
membership function. In general, the minimization
of the cost function gives the final clusters and its
centers, which are the values obtained after the
convergence. Here the updated cost function is
minimized to get the converged cluster centers. We
used gradient descent as the minimization method.
While minimizing, the first derivatives of the cost
function are calculated with respect to the
membership function, cluster centers and the gain
field. The obtained first derivatives are then equated
to zero to get equations which are solved for points
that minimize the cost function. These derivatives
when set to zero give the final update laws for the
membership function, gain field and the cluster
centers. The equations for the updated membership
function, cluster centers and the gain fields are given
below (Balla-Arab et al., 2013).
U
(x,y) =
1
∑
‖
Y
(
x,y
)
−B
(
x,y
)
−v
‖
‖
Y
(
x,y
)
−B
(
x,y
)
−v
‖
()
(4)
v
(x,y) =
U
(x,y)
∅
Y
(
x,y
)
−B
(
x,y
)
dxdy
U
(x,y)
∅
dxdy
(5)
B
(
x,y
)
=
Y
(
x,y
)
−
∑
U
(x,y)v
∑
U
(x,y)
(6)
where
indicates the membership function of the
pixel,
(
,
)
is the modeled input image at that
particular location.
(
,
)
is the bias function
which is obtained using the gain field of the modeled
image at that location. indicates the amount of
fuzziness to be included in each cluster. ∅ indicates
the whole image whereas indicates the part of the
image.
indicates the centroid of the
pixel.
indicates the number of clusters.
2.3 Simplified Spatial Cost
Membership Function for Optimal
Clustering
As we can see, the exponent in the membership
function in Equation (4) is
()
. If the value of is
greater than 2, the membership function increases
gradually, which might lead to over clustering; on
the other hand, if the value of is less than 2 and
greater than 1, the membership function decreases,
and the pixels which are supposed to have high
membership function values will have low
membership function values, which might lead to
under segmentation. To balance these tendencies, we
take f = 2 as the fuzziness parameter.. (We made this
decision based on empirical tests of the algorithm on
various input images.) So when is taken as 2, the
membership function reduces to the equation given
Nuclei Segmentation using a Level Set Active Contour Method and Spatial Fuzzy C-means Clustering
197
by Equation (7).
(,) =
1
∑
‖
(
,
)
−
(
,
)
−
‖
‖
(
,
)
−
(
,
)
−
‖
(7)
This is the final membership function which is used
to derive the energy function of the image and also
the driving force which controls the evolution of the
level set function. We assume that we need exactly
two clusters, one for nuclei and one for non-nuclei.
This assumption will give rise to the following
equation.
(
,
)
+
(
,
)
=1
(8)
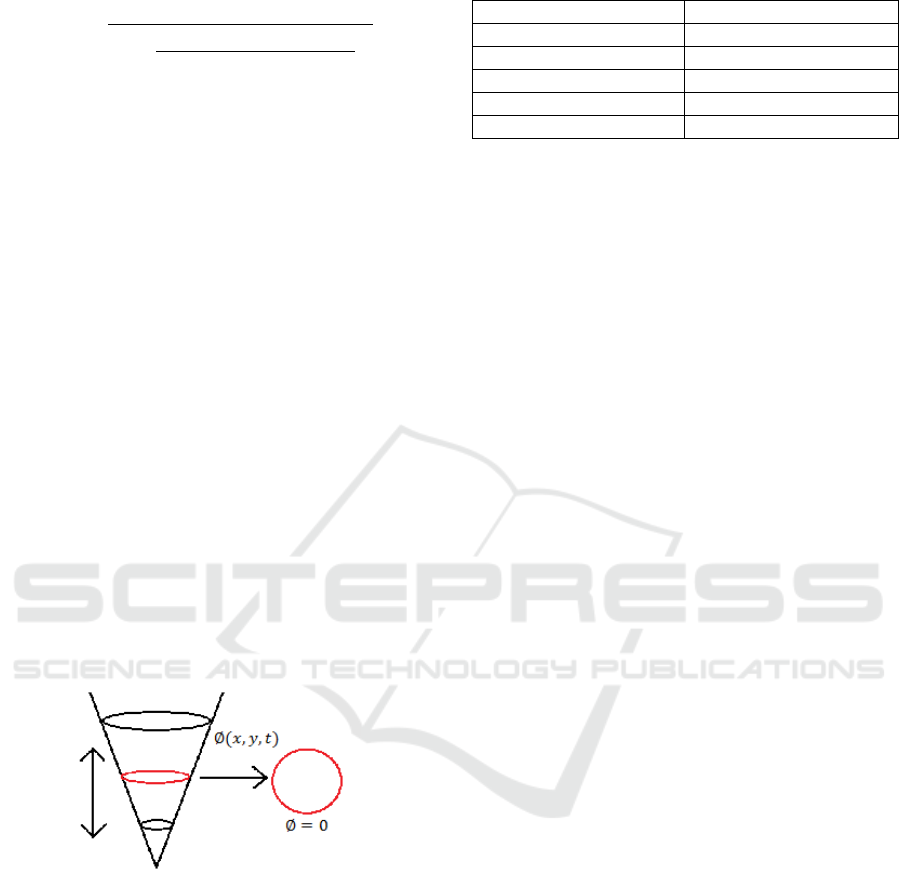
2.4 Level Set Active Contour Method
The zero level set in general is from the level set
function intersected with a constant plane.
This
intersection gives a contour in two dimensional
space. This is shown in Figure 4, where ∅(,,) is
the level set function and ∅=0 is the equation for
the zero level set. The red contour obtained is the
intersection of the level set function and the plane
which is the zero level set. The evolution of the level
set function starts from the zero level set and evolves
to the edges of the nuclei. In this paper the driving
force is obtained from fuzzy c-means clustering by
using the fuzzy membership function. The
parameters of the level set algorithm which control
the evolution are shown in Table 1.
Figure 4: The zero level set is the level set function
intersected with a plane.
From Table 1, ‘τ’ represents the time step. A larger
time step may reduce the evolution time but may
result in loss of boundary detail. We used an
empirically determined value, after experimentation
on various input images. This value varies with the
type of input image. ‘f’ represents the amount of
fuzziness induced by the membership function. We
set this value to 2, as discussed above. ‘V1’, ‘V2’
are the cluster centres, one for the nuclei and one for
the non-nuclei regions. ‘λ’ is an empirically
determined constant which is multiplied by the force
function, which was determined as 2.
Table 1: Parameters of level set.
Parameters Description
τ Time step of evolution
f Fuzziness parameter
V1 Cluster centre
V2 Cluster centre
λ Multiplicative factor
The equation for the driving force, including the
fuzzy membership function, is given below (Balla-
Arab et al., 2013).
=(
(
,
)‖
(
,
)
−
(
,
)
−
‖
−
(
,
)‖
(
,
)
−
(
,
)
−
‖
)
(9)
where is a parameter which enhances or reduces
the controllability of the driving force. In this paper
the value of equals 1. This driving force contains
the modeled input image, gain field information,
membership function and the cluster centers. These
values are obtained from the previously derived
equations and are substituted in the equation of the
driving force. Minimization of the driving force
divides the whole image into the two regions, one
for non-nuclei regions and one for nuclei regions.
This results in obtaining the contour which stops
evolving at the edges of the nuclei. The mask for the
epithelium region of the input image is manually
marked.
2.5 Morphological Operations
Morphological operations are applied to the output
from the level set operation described in section 2.2
to obtain a nuclei mask. Three functions are
implemented to clean the mask while retaining the
data.
These morphological operator outputs help in
reducing noise while preserving critical nuclei
information from the input. Three functions are
applied since the data present in one output may not
be present in the other output. Combining all the
three outputs gives the best final result. The three
functions are demonstrated below.
i. Small nuclei are retained while removing
the large area objects and very small area
objects
ii. Large area nuclei objects are retained while
removing the small nuclei objects
iii. Difference image between i and ii.
The morphological operations are applied to the
level set output generated from the masked
epithelium region from Figure 3. It is evident that in
VISAPP 2017 - International Conference on Computer Vision Theory and Applications
198
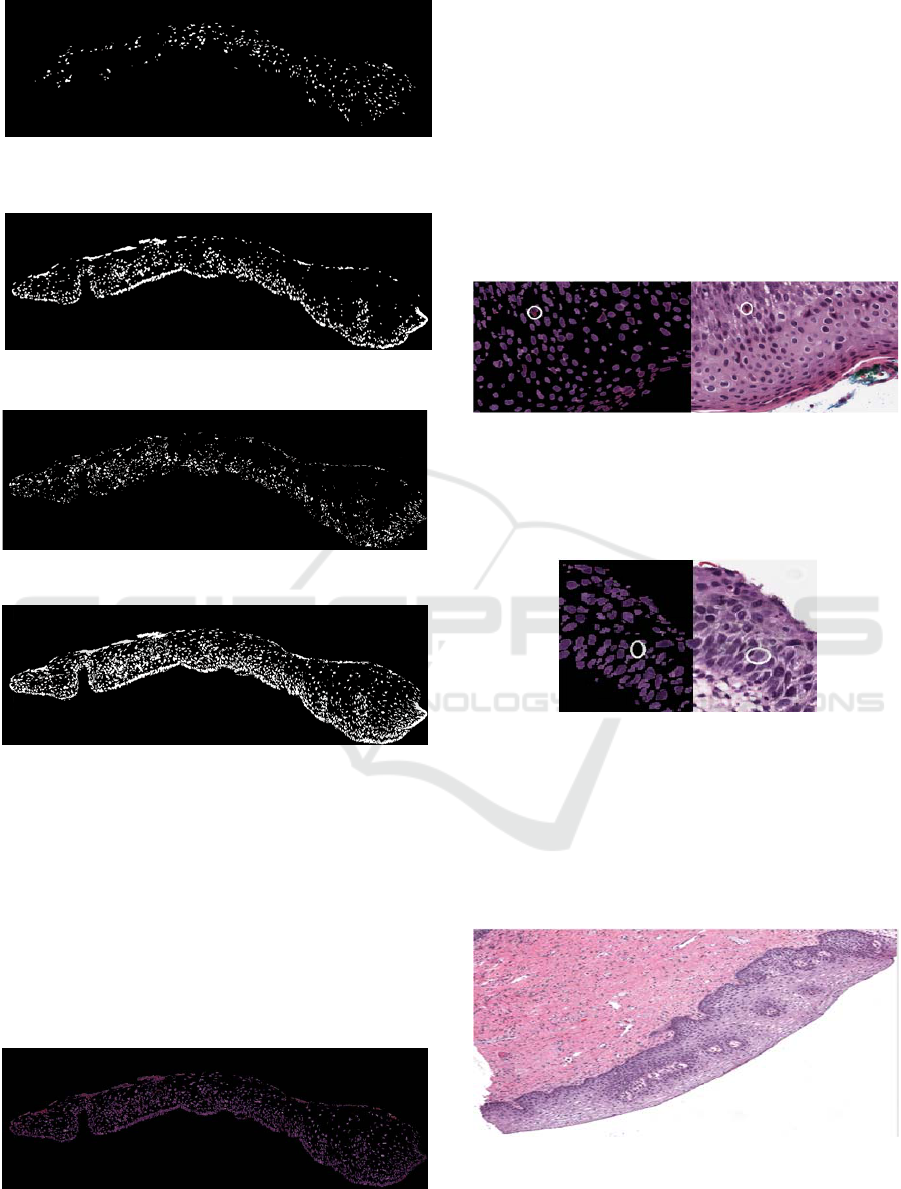
Figure 5: Retaining the small nuclei by eliminating large
area objects.
Figure 6: Retaining the large area objects.
Figure 7: Output of the difference.
Figure 8: Combined output of the morphological
functions.
Figure 5, nuclei with comparatively small size are
retained and in Figure 6 nuclei which have large area
are retained. Figure 7 is the morphological output of
the difference of the previous two images. This helps
in retaining the medium sized nuclei present. Figure
8, the final nuclei mask, is the combined output and
is free of noise. This nuclei mask when multiplied
with the input image, gives the masked nuclei
output, shown in Figure 9.
Figure 9: Nuclei Mask.
3 EXPERIMENTS AND RESULTS
This algorithm is applied on various images and the
accuracy for all the 71-image dataset is calculated.
Examples of false negative and false positive cases
are shown below. True positive results are the cases
where the detected object is in fact a nucleus, and a
false negative result is the case where the nucleus
object is not detected; false positive cases and true
negative cases indicate non-nuclei objects
incorrectly and correctly labeled, respectively.
Figure 10: False positive detection example.
As we can see in Figure 10 the circled area in the
masked image is not a nucleus but it is detected as
nucleus, a false positive.
Figure 11: False negative detection example.
In Figure 11 the nucleus shown is not detected and
hence this is a false negative result. False negative
and false positive cases reduce the overall accuracy.
We calculated accuracy based on these visual
inspections of the results. The best and the worst
cases of the algorithm are shown below.
Figure 12: Example of good nuclei segmentation.
Nuclei Segmentation using a Level Set Active Contour Method and Spatial Fuzzy C-means Clustering
199
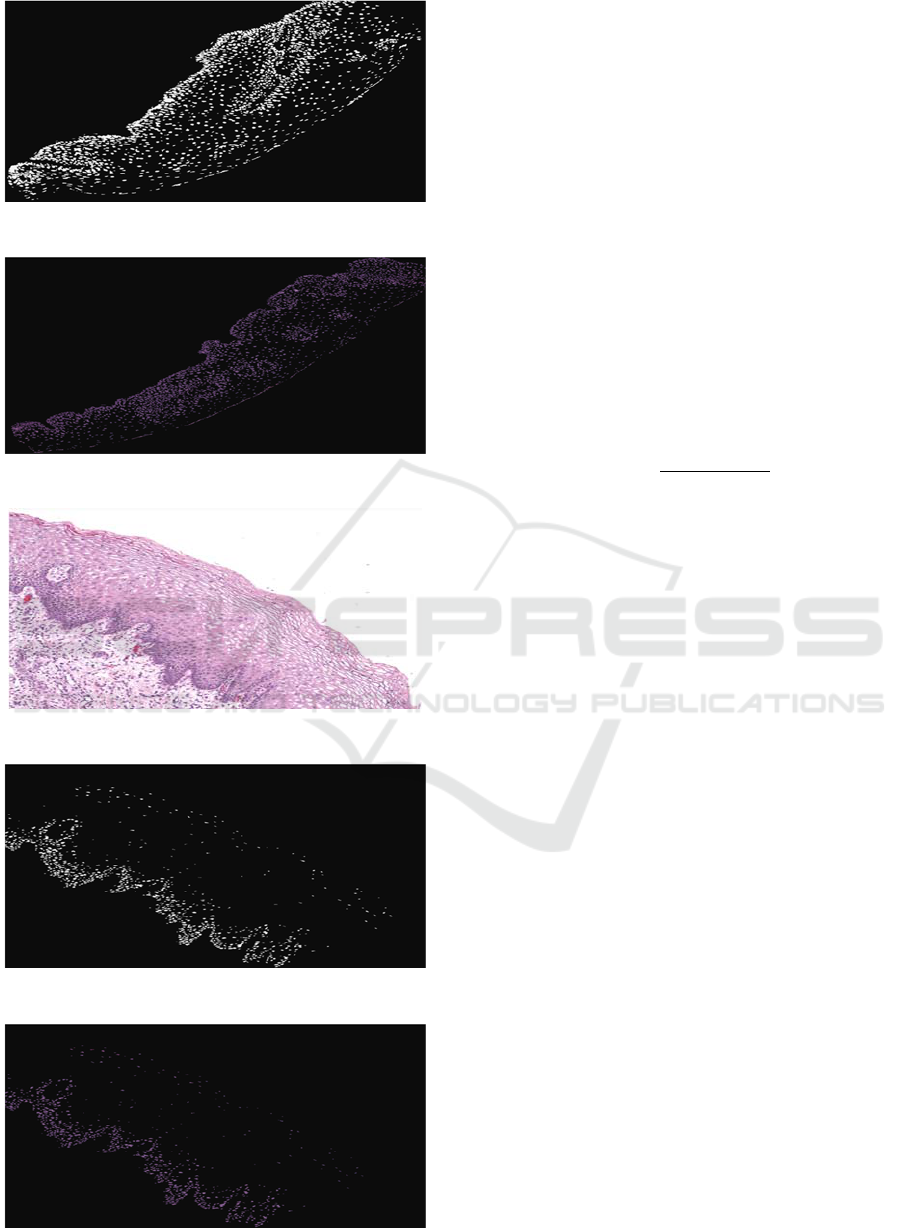
Figure 13: Mask generated.
Figure 14: Masked nuclei output.
Figure 15: Image example with nuclei detection errors.
Figure 16: Masked image.
Figure 17: Masked nuclei output.
In most cases the nuclei are detected with good
accuracy. For a few input images with smaller
nuclei, sensitivity of nuclei detection is less than for
the other images. When morphological operations
are applied to the binary mask image, smaller sized
nuclei get eliminated since they are considered
noise. This can be improved by tuning the
parameters of the morphological operations.
4 EVALUATION
We calculated nuclei segmentation accuracy by
initially calculating the number of nuclei objects
detected by the algorithm, and then using human
visual inspection to assess true positive, false
negative, and false positive . We calculated accuracy
from the equation below (Szénási et al., 2012)
Accurac
y
=
T
−F
−F
T
(10)
where T
indicates the true positive detections
(number of nuclei correctly found), F
indicates the
false negative detections (number of nuclei that are
not found) and F
indicates the false positive
detections (number of false nuclei that are found)
from the image. For the masked epithelium image
from Figure 3 used for demonstration, the nuclei
segmentation accuracy obtained is 96.47% (T
=
1163,F
=4,F
=37). In the experimental results,
the accuracy for the best case image is 100% (T
=
2164,F
=0,F
=0) and the accuracy for the
worst case image is 81.98% (T
= 827,F
=
0,F
= 149). This accuracy is calculated for each
image in the 71-image dataset.
5 COMPARISON
Various investigators have published results on
nuclei segmentation. To cite one example (Guo et
al., 2015), K-means and other morphological
operations have been used and have achieved 88.5%
accuracy. This paper segments the initial image into
ten vertical segments and then SVM or LDA
algorithms are applied and then their results are used
for obtaining final classification label. The dataset
used is similar and has obtained from NLM database
which was discussed earlier. This proposed
algorithm presents a nuclei segmentation approach
based on the fuzzy c-means and level set
segmentation methods and performs the
VISAPP 2017 - International Conference on Computer Vision Theory and Applications
200

segmentation of the nuclei on a digitized histology
dataset of 71 images. The average accuracy for
segmentation results achieved is 96.47%. Table 2
provides a summary of the nuclei detection results
for these images
Table 2: Nuclei Segmentation Results, 71-image Dataset.
Total No.
Nuclei
T
F
T
75107 73791 1662 346
6 DISCUSSION
The best result, 100% detection of all the nuclei, was
achieved for an image where the nuclei were non-
overlapping and had larger nuclei as compared to the
other test images. A combination of morphology
operators is proposed as a method to optimize
information preservation while removing noise. In
the worst case (81% accuracy), nearly 20% of nuclei
were not detected, since many small nuclei were
removed in the morphological operations. We
experimented with modifying the algorithm to allow
small objects to be retained; this increased the
accuracy of nuclei detection for one particular image
by 10%, at a cost of drop in overall accuracy over
the 71-image set of 9%, from 96% to 87%. In our
current work, we use the original algorithm and
continue to seek an alternate solution which does not
degrade the overall accuracy. We propose the
simplified spatial cost function Equation (7), as a
cost function that may be generally applicable for
any N-class clustering problem of spatially
distributed objects. Since many problems involve
two classes, our novel technique represented in
Equation (8) is proposed as an optimal solution to
two-class spatial clustering problems.
ACKNOWLEDGEMENTS
This research was supported [in part] by the
intramural research program of the National
Institutes of Health (NIH), the National Library of
Medicine (NLM), and Lister Hill National Center
for Biomedical Communications (LHNCBC). We
gratefully acknowledge the medical expertise and
collaboration of Dr. Mark Schiffman and Dr.
Nicolas Wentzensen, both of the National Cancer
Institute’s Division of Cancer Epidemiology and
Genetics (DCEG).
The relatively small set presented here (71
images) is typical for this domain, with other studies
presenting fewer images. The 71 images represent
284 possible grading choices: normal, CIN1, CIN2
and CIN3. The domain addressed here is therefore
quite dependent on expert input. The large number
of segments, 710, and the large number of nuclei
present in each segment, provide a sufficiently large
number of nuclei for application of the methods
outlined here.
REFERENCES
Balla-Arab, S., Gao, X. & Wang, B., 2013. A fast and
robust level set method for image segmentation using
fuzzy clustering and lattice Boltzmann method. IEEE
Transactions on Cybernetics, 43(3), pp.910–920.
Guo, P. et al., 2015. Nuclei-Based Features for Uterine
Cervical Cancer Histology Image Analysis with
Fusion-based Classification. IEEE journal of
biomedical and health informatics, (c).
Krishnan, M.M.R. et al., 2012. Computer vision approach
to morphometric feature analysis of basal cell nuclei
for evaluating malignant potentiality of oral
submucous fibrosis. Journal of Medical Systems,
36(3), pp.1745–1756.
Lu, Z., Carneiro, G. & Bradley, A.P., 2013. Automated
nucleus and cytoplasm segmentation of overlapping
cervical cells. In Lecture Notes in Computer Science
(including subseries Lecture Notes in Artificial
Intelligence and Lecture Notes in Bioinformatics). pp.
452–460.
Phillips, C., 1999. The level-set method. The MIT
Undergraduate Journal of Mathematics, pp.155–164.
Available at:
http://diyhpl.us/~bryan/papers2/frey/levelsets/Phillips
C., The level-set method.pdf.
Rahmadwati, G.N. & Ros, M. & Todd, C. & Norahmawati
E., 2011. Cervical cancer classification using Gabor
filters. In First IEEE International Conference on
Healthcare Informatics, Imaging and Systems Biology,
pp. 48-52.
Song, Y. et al., 2015. Accurate segmentation of cervical
cytoplasm and nuclei based on multiscale
convolutional network and graph partitioning. IEEE
Transactions on Biomedical Engineering, 62(10),
pp.2421–2433.
Szénási, S., Vámossy, Z. & Kozlovszky, M., 2012.
Evaluation and comparison of cell nuclei detection
algorithms. In 16th IEEE International Conference
onIntelligent Engineering Systems (INES2012). pp.
469–475. Available at: http://users.nik.uni-
obuda.hu/sanyo/gpgpu/ines2012_submission_101.pdf.
Walker, R.F. et al., 1994. Classification of cervical cell
nuclei using morphological segmentation and textural
Nuclei Segmentation using a Level Set Active Contour Method and Spatial Fuzzy C-means Clustering
201

feature extraction. In Intelligent Information Systems,
1994. Proceedings of the 1994 Second Australian and
New Zealand Conference on. pp. 297–301.
Wang, L. & Pan, C., 2014. Robust level set image
segmentation via a local correntropy-based K-means
clustering. Pattern Recognition, 47(5), pp.1917–1925.
VISAPP 2017 - International Conference on Computer Vision Theory and Applications
202
