
Creating User-specific Business Process Monitoring Dashboards
with a Model-driven Approach
Maximilien Kintz, Monika Kochanowski and Falko Koetter
Fraunhofer IAO, Nobelstr. 12, 70569 Stuttgart, Germany
Keywords: Business Processes, Monitoring, Dashboards, Roles, Views, Model-driven Development.
Abstract: Monitoring with the goal of visualizing key performance indicators using dashboards is an established way
of enabling the analysis of business processes and providing quick information in critical situations. Model-
driven development and design of these dashboards has proven useful in real world scenarios. However, in
large organizations, dashboards need to be role-specific, as not all users are concerned by the same data. In
this paper, a users-and-roles model is introduced. It extends and adapts the model-driven process monitoring
methodology aPo. With this model, it becomes possible to automatically generate user-specific monitoring
dashboards, properly displaying the needed information for each user in an organisation. The implementation
is evaluated with a real-world use-case from the service industry.
1 INTRODUCTION
The importance of business process monitoring to
support quick information and better understanding
of the activities within an organisation is an already
well-known and established fact (Kötter et al. 2014).
Dashboards are an often-used appropriate way of
visualising the gathered information (Few 2013;
Kintz 2012). Model-driven approaches have already
been proposed to automate cumbersome tasks when
setting-up a monitoring and dashboard infrastructure
(see for example Chowdhary et al. 2006; Kötter et al.
2014).
A less investigated area is the importance of role-
specific information. In large organisations, not all
users concerned by a specific process face the same
goals and are interested in, or allowed to access, the
same data: Eckerson (2010, p.210) insists on the
importance of "owned" Key Performance Indicators
(KPIs), associated to one specific person in the
organisation.
To cater to these different needs, role-specific
dashboards can be used. For each role, a custom
dashboard is made available. However, designing and
implementing dashboards is a cumbersome task,
especially as roles and requirements change over
time.
In previous work, we introduced aPro, a model-
driven approach for process monitoring. This
approach creates a ready-to-run monitoring
application from a platform-independent process and
monitoring model. This includes a dashboard with all
process KPIs.
However, when using the solution in practice, we
found that different stakeholders have different
monitoring requirements and are overwhelmed with
the existing pre-configured standard dashboard.
Thus, a need arises for creating user- or role-
specific dashboards within the model-driven
approach. As roles may evolve over time (Odell et al.
2003), dashboards need to be created and modified
while the monitoring application is running.
The remainder of this article is structured as
follows: in section 2, the state of the art concerning
views modelling and role-specific dashboards is
presented and related work is analysed. In section 3,
the aPro process-monitoring architecture is described.
Section 4 explains how aPro can be extended with a
users-and-roles model to create role-specific
dashboards. Section 5 presents the prototypical
implementation, section 6 presents its evaluation with
a use-case from the service industry. Finally, section
7 discusses security concerns, followed by section 8,
which concludes the paper.
Kintz M., Kochanowski M. and Koetter F.
Creating User-specific Business Process Monitoring Dashboards with a Model-driven Approach.
DOI: 10.5220/0006135203530361
In Proceedings of the 5th International Conference on Model-Driven Engineering and Software Development (MODELSWARD 2017), pages 353-361
ISBN: 978-989-758-210-3
Copyright
c
2017 by SCITEPRESS – Science and Technology Publications, Lda. All rights reserved
353

2 STATE OF THE ART AND
RELATED WORK
Related work to model-driven process monitoring
was already discussed in detail (see Kötter &
Kochanowski 2012; Kötter & Kochanowski 2013).
The generation of dashboards was also previously
discussed in (Kintz 2012). Kim et al. (2007) have
proposed an approach for the development of
personalised monitoring dashboards. However, they
do not provide any information on the user model
used. The goal of the present work is to extend a
model-driven approach for the generation of
monitoring dashboards, in order to generate user-
specific views. Therefore, this section is focused
exclusively on work related to the modelling of views
for business process models.
To evaluate already existing approaches
concerned with the modelling of views on process
models, the following criteria were applied:
1. Views can be directly associated to
process elements (as this work uses
the modelling of business processes
for the basis of the monitoring
infrastructure).
2. Views can be defined on associated
KPIs (because it can be that not all
KPIs associated to the same process
element are relevant to the same
users).
3. Views and roles can be freely and
easily defined (so as to leave freedom
to the user performing the modelling
tasks and to keep the necessary tasks
simple and thus accessible to as many
users as possible).
4. A dashboard can be created
automatically from defined views (to
provide a simple way of visualising
the monitored data).
5. Dashboards can be deployed at run-
time of the process monitoring
solution (to adapt easily to changes).
Schumm et al. (2010) introduce the concept of
process viewing patterns, allowing the definition of
“patterns” to apply transformations to an existing
process model (independently of its modelling
language) and reduce it. The goal is to make the
process model easier to understand. Pattern modelling
is highly powerful, however also complex and
requires technical skills.
Streule (2009) introduces a method to define
views on processes modelled using the Business
Process Execution Language (BPEL) (OASIS 2007)
by applying tagging to a process model. The tagging
of KPIs related to process steps is however not
discussed.
Latuske (2010) proposes a method to visualise
KPIs on views of BPEL processes. However, these
views cannot be freely configured: they are derived
from the data type being visualised. The provided
visualisations are also rather limited in supported
types and configurability, compared to what is
usually expected from (commercial) monitoring
dashboards.
Muehlen and Rosemann (2000) propose an
architecture for the monitoring of KPIs associated to
process steps. However, the views cannot be freely
defined, but are set by the architecture.
Table 1: Fulfilment of the criteria by the reviewed
approaches. Meaning of symbols: criteria ○ not fulfilled, ◑
partially fulfilled, ● completely fulfilled.
Criteria
Schumm
et al.
(2010)
Streule
(2009)
Latuske
(2010)
Muehlen
and
Rosemann
(2000)
Views for
process
elements
● ● ● ●
Views for
KPIs
○ ○ ● ●
Free / easy
definition
◑ ● ○ ○
Automatic
dashboard
generation
for views
○ ○
◑ ◑
Deployment
at runtime
○ ○ ○ ○
The analysis results and the fulfilment of the
previously defined criteria are summarised in Table
1. It shows that no existing approach fulfils all
requirements. However, some ideas can be adapted to
meet the missing requirements. Based on these
results, it is needed to
use the tagging approach and apply it to
both process steps and KPIs (i.e. to all
elements of a process monitoring model)
and
develop a simple and flexible users-and-
roles model, where users can be
associated to one or more roles.
Summing up the analysis of sections 1 and 2, the
following four requirements can be defined for an
MODELSWARD 2017 - 5th International Conference on Model-Driven Engineering and Software Development
354
extended approach to a dashboard development
methodology:
Show each user the information relevant
to them, and only this information.
Offer a free definition of views (and a
free definition of users and roles).
Support a definition of views for process
elements as well as for metrics.
Generate user-specific dashboards
automatically (with some minimum
work needed for the integration within
existing systems, to send data to the
monitoring infrastructure).
This approach is realised as an extension to an
already existing process monitoring architecture,
briefly described in the following section.
3 MODEL-DRIVEN BUSINESS
PROCESS MONITORING WITH
aPro
The architecture for business process optimization
(aPro) is a model-driven approach to monitor and
control (and in the end optimize) business processes
(Kötter & Kochanowski 2012).
Creating a process monitoring solution with aPro
is done in four steps:
1. A platform-independent process and
goal model are graphically modelled.
A goal model describes data to be
monitored, Key Performance
Indicators (KPIs) to be calculated and
goals to be fulfilled.
2. Both models are stored in a
ProGoalML (a process model and
goal mark-up language) file in an
XML-based format.
3. In a model transformation step,
monitoring infrastructure is generated
into a web archive, ready to be
deployed on a web server. This
includes a VisML (visualization
mark-up language) file describing the
process dashboard. A VisML file
contains a description of
visualizations (chart type, name), of
the data sets to display (for example
database query) and of the data
sources to use (for example database
connection). This is further explained
in section 4.2.
4. Using automatically generated
monitoring stubs, the monitoring
infrastructure is integrated with the
system executing the process,
gathering monitoring data.
A goal model can be modelled directly within a
process model using a graphical notation (step 1). An
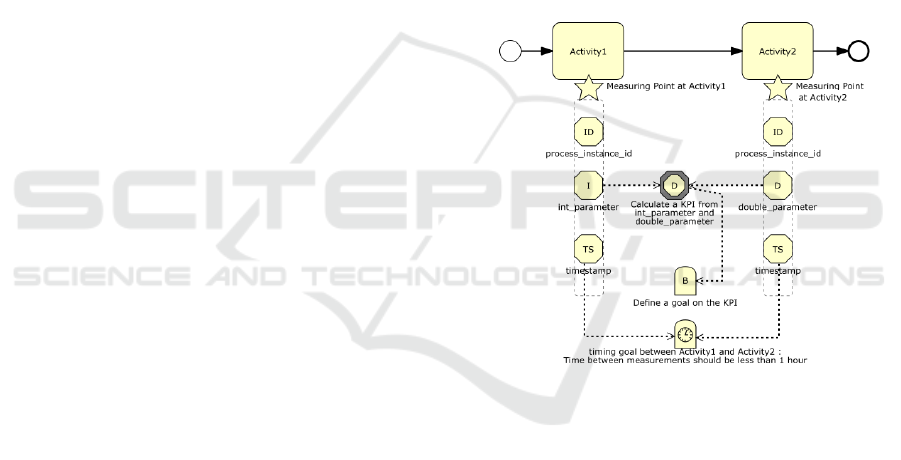
example for a small goal model is shown in Figure 1.
The process has two tasks (Activity1 and Activity2).
Measuring points (represented by stars on the
figure) are used to define measurements consisting of
multiple parameters and attaching them to the process
element, where the measurement should take place.
Parameters (octagons on the figure) are values of
any simple datatype to be measured. IDs are used to
identify process instances and correlate
measurements during monitoring data processing.
Timestamps indicate the time of measurement. Other
parameters are process-specific.
Figure 1: Example process and goal model.
From parameters, KPIs can be calculated,
representing important values. KPIs may be instance
specific (i.e. pertaining to a single process instance)
or aggregated (e.g. average savings for the last 100
instances). An example KPI is shown with the grey
octagon on the figure.
Two kinds of goals can be specified. Regular
goals are defined on KPIs and parameters, indicating
an acceptable range of values (e.g. average savings of
at least 5%). Timing goals define the maximum time
between two activities (e.g. time between process
start and end should at most be one hour).
An overview of the next steps is given in Figure
2. After modelling, the graphical model is stored in an
XML-based format (Step 2).
In a model transformation step, the platform-
independent model is used to create a monitoring web
Creating User-specific Business Process Monitoring Dashboards with a Model-driven Approach
355
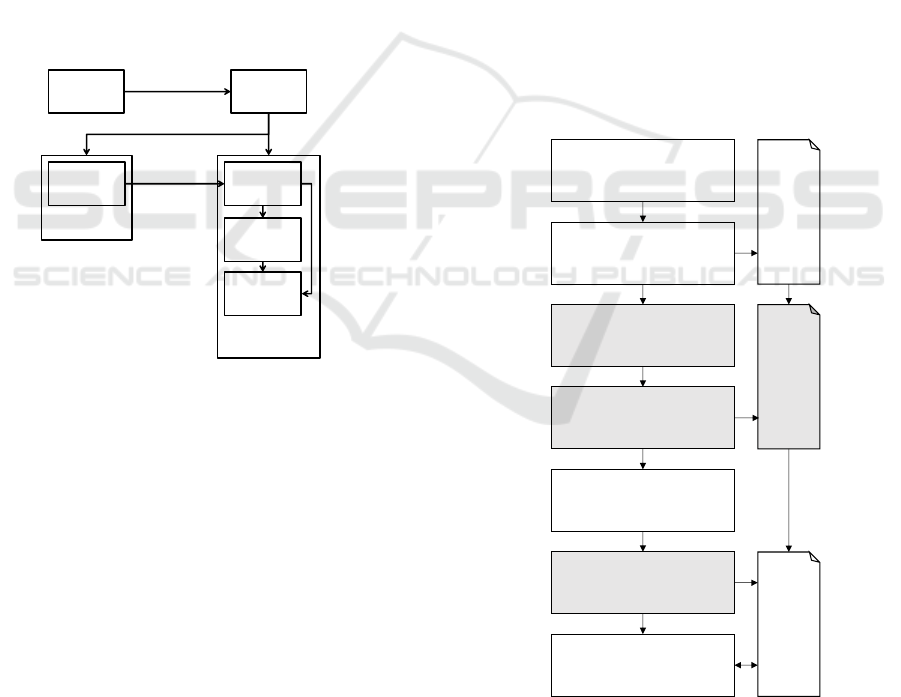
application, encompassing monitoring data gathering,
processing, storage and visualization (Step 3).
Artefacts created include measurement data formats,
event processing rules, result data formats, schemata
for a data warehouse and a general dashboard
configuration (stored in a XML dashboard
description file using the VisML format). The web
application can be automatically deployed to a web
server, providing a one-step creation of a monitoring
solution from the modelling tool.
To actually monitor the process, monitoring data
needs to be gathered from the system or system(s)
executing the process (Step 4). Similar to model
transformation, implementation technology specific
monitoring stubs can be automatically generated for
each measuring point, aiding integration (e.g. Java
code or listeners in a process engine). These
monitoring stubs measure all parameters of the
measuring point whenever the associated activity is
reached during execution and send the measurement
to the monitoring solution.
Figure 2: Overview of the model-driven approach for
business process monitoring.
The further steps of the methodology have been
described in previous work (Kötter & Kochanowski
2012; Kötter & Kochanowski 2013). The next section
focuses on the extension of the model to users, roles,
and views.
4 EXTENDING APRO WITH A
USER AND ROLE MODEL
This section explains how aPro can be extended to
create role-specific dashboards. Following the
tagging approach identified as appropriate in section
2, new models are introduced, then the adaption of the
algorithms is described.
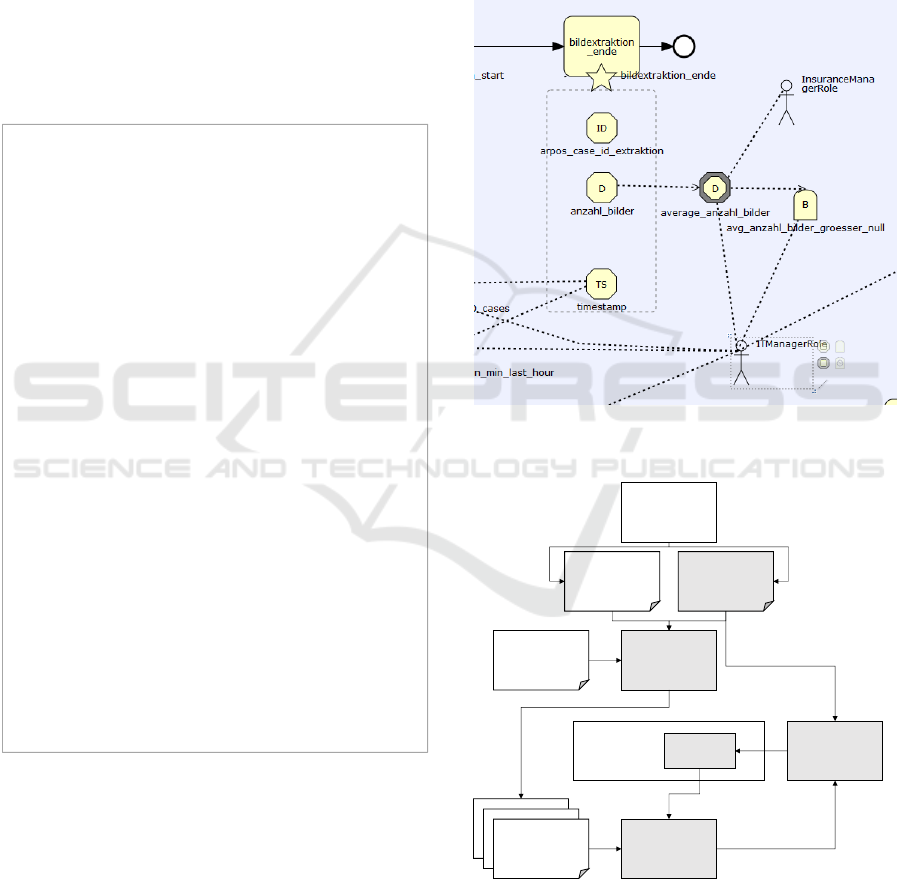
An overview of the extended aPro method for
role-specific process monitoring is given by Figure 3.
The main difference for a user working with aPro
consists in new steps for the modelling of users and
roles, and the mapping of parameters, KPIs and goals
to roles. This step comes after the modelling of the
process and KPIs and after the automatic generation
of the infrastructure.
In this approach, the creation of solutions for
process and goal model definition and monitoring is
separated from role modelling and configuration.
This offers several advantages:
(1) Role modelling is optional and existing
models can be used as-is.
(2) User-specific dashboards can be created
independently from the monitoring
infrastructure. Thus, no downtime or new
deployment of monitoring infrastructure is
necessary.
(3) Roles and their associated dashboards can be
changed without changing the monitoring
infrastructure.
In the following subsections, the extension is
described in detail.
Figure 3: Overview of the process monitoring
methodology. The steps and components displayed in bold
on a grey background are the main contribution of this
paper.
Modeling
Modeling
Tool
Process &
GoalModel
Process
Execution
Monitoring
Stubs
Monitoring
Solution
Event
Processing
Data
Warehouse
Dashboard
Model
Transformation
Integration
Measurements
Monitoring
Results
Model business process
Model parameters, KPIs
and goals
Model users and roles
Map roles to
parameters, KPIs and
goals
Generate monitoring
infrastructure
Generate user-specific
dashboards
Use and / or edit user-
specif ic dashboards
XML process and
goal model
User s, Ro l es and
Views
XML dashboard
description files
MODELSWARD 2017 - 5th International Conference on Model-Driven Engineering and Software Development
356

4.1 New Models for Roles and Views
Alongside the process and goal model described in
ProGoalML, two components were added. The first is
a users-and-roles model, containing information
about users concerned by the monitored business
process and their respective roles. The second is a
views model, containing the list of roles allowed to
view each parameter, KPI or goal in the goal model.
Both models are described using an XML syntax,
following the same principles as ProGoalML and
VisML.
Figure 4: Example roles and users description document of
the process monitoring methodology.
The users-and-roles model contains a list of roles
and a list of users. Each role in the list is characterized
by its name, a short description, and some optional
specific properties. An example property is the
customAlertQuery, which can be used to filter the
alert messages that are relevant to the role. Each user
in the list is characterized by an identifier, which has
to be unique, a name, and a list of one or more
associated roles. Modelling users in addition to roles
helps provide useful information that can be used, for
example, to link a generated dashboard to a user
account in the organization’s corporate directory.
That way, a password check on dashboard loading
could be easily implemented (see section 7 for further
comments on security).
The views model contains two blocks: the first
block contains metadata, such as latest modification
date and some global preferences (for example, the
possibility to deactivate the creation of a “master
dashboard” containing all visualisations). The second
block gives a list of associated roles (identified by
their role name) for all elements having been mapped
to a role.
Figure 4 shows an example XML document
describing a role and associated user. Figure 5 shows
an example of a views description document.
Figure 5: Example - views description document
4.2 Extending the Dashboard Creation
Algorithm
The creation of dashboards without taking users and
roles into account within aPro works as follows: using
a set of rules containing mappings from ProGoalML
elements to visualization types (cf. Kintz 2012), a file
describing a dashboard is generated. The dashboard
description file contains information on data sources
and data sets to fetch the data to visualize, on the chart
types to be used, and on alerts to display.
Creating user-specific dashboards works as
follows:
A global file describing a dashboard
containing all elements from the process
and goal model is created (if its
generation is deactivated using the
<?xml version="1.0" encoding="UTF-8"?>
<userRoles>
<roles>
<role name="Manager">
<description>Responsible for the
management of the tool</description>
<properties>
<property
key="customAlertQuery" value="*management*"/>
</properties>
</role>
</roles>
<users>
<user id="1" name="Jake">
<roles>
<role>Manager</role>
</roles>
</user>
</users>
</userRoles>
<?xml version="1.0" encoding="UTF-8"?>
<views>
<meta><lastmodified>2015-10-
20T22:15:34Z</lastmodified></meta>
<preferences>
<global>
<preference
key="generateMasterDashboard" value="false"/>
…
</global>
<roleSpecific/>
</preferences>
<elements>
<element
stencil=http://b3mn.org/stencilset/bpmn2.0#kpi
name="onlineUsers">
<role>Manager</role>
</element>
</elements>
</views>
Creating User-specific Business Process Monitoring Dashboards with a Model-driven Approach
357
properties of the views file, the master
dashboard will be deleted after creation
of the user-specific dashboards).
For each user described in the users-and-
roles model, a user-specific dashboard
description file is created. This is done
by deleting the data sets that are not
associated to elements visible to a role
the user possesses. Then, the
visualizations without associated data
set and the unused data sources are
removed.
These steps are described in pseudo-code in
Figure 6. Note that a user can see an element if at least
one of their roles allows to do so.
Figure 6: Algorithm for the creation of user-specific
dashboards
aPro was created (and extended) with the
objective of freeing users from cumbersome tasks
when setting-up a monitoring infrastructure. In order
to pursue this objective, graphical user interfaces
(GUIs) were created and extended. This is presented
in the following section.
5 PROTOTYPICAL
IMPLEMENTATION
The already existing modelling user interface, based
on Oryx (Decker et al. 2008), was extended to allow
the definition of users and roles as well as the
mapping of ProGoalML elements (parameters, KPIs
and goals) to roles. Users and roles can be created
within the modelling environment.
Figure 7: Graphical modelling of role-to-parameter
associations.
Figure 8: Architecture overview of the solution, showing
the main process steps and used or generated artefacts. The
steps and components displayed in bold on a grey
background were added to support the development of role-
specific dashboards in this work.
Monitoring
infrastructure
Value
provider
Dashboard
description file
Dashboard
rendering
so f t w are
Dashboard
description file
Dashboard
description file
Visualisation
mapping file
Generation
engine
A cce ss r i ght s
checker
Modelling tool
Process and
goal model
Views
(Users-and-
roles model)
# 1. Create master dashboard
For each element Goal, KPI or Parameter from
the goal model
Find appropriate mapping in mapping file
Add appropriate visualisation to
dashboard
Add needed data set to dashboard
End for
For each data set
If data source not present
Add data source
End if
End for
# 2. Create user-specific dashboard
For each user in user model
Copy master dashboard
For each data set
If there exists no role associated to
the user allowing to see the data set
Remove data set
End if
End for
Remove visualizations without data sets
Remove unused data sources
End for
MODELSWARD 2017 - 5th International Conference on Model-Driven Engineering and Software Development
358
Mapping elements to roles is done following the
tagging approach mentioned in section 2. An example
is shown on Figure 7. The person-like figure
represents a role (and not a user, as elements are
associated to roles, and roles to users).
Based on the graphical modelling of the process,
KPIs and goals, and users and roles, the generation of
the monitoring infrastructure and the master
dashboard configuration is triggered. This was
previously implemented, as explained in (Kintz 2012;
Kötter & Kochanowski 2012). A step was then added
to generate user-specific dashboards.
An overview of the resulting architecture of the
implemented solution is shown on Figure 8. Software
components are shown on a grey background,
whereas models and configuration files are shown on
a white background. The access rights checker
component was not implemented as part of the
prototype (as it was not needed within the evaluation
use-case), but is described in section 7.
6 EVALUATION WITH AN
EXAMPLE FROM THE
INSURANCE CLAIM
MANAGEMENT
The method was evaluated with a use-case from the
service industry, more precisely insurance claim
management. This discipline is particularly suited for
an evaluation of process monitoring as it deals with
large quantities of data and established processes
(Aschenbrenner et al. 2010). It is also an area that
could easily be evaluated, as our research institute has
a long expertise in the development of software for
automatic or partially automated claim processing
(Renner 2006).
The evaluation use-case consists of a software
that automatically checks car insurance damage
claims. For each claim, a series of automated checks
is performed. Following the automated checks, the
claim is presented in a Web portal, where insurance
experts can assess the details of the claim.
The solution is operated for a large German
insurance company. It is monitored by Fraunhofer
IAO since 2012 using a general dashboard. While this
general dashboard was sufficient for internal
monitoring at the institute, the level of (technical)
detail was not suitable for all insurance stakeholders.
Thus, different dashboards for different roles were
needed.
Two typical users, each representing one role,
were considered for the assessment. Firstly, an
insurance manager is interested in checking the load
and usage (by its employees) and effectiveness (in
terms of potential savings) of the system in real time.
Secondly, an IT manager is interested in checking that
the system is up and running and that the response
times are appropriate, while at the same time making
sure that the results are correct from a business point
of view (no errors in calculations). Table 2 presents
some metrics and their relevance for the users.
Table 2: Some metrics and the users they are relevant for.
Metric
Insurance
Manager
IT
Manager
Users currently online X X
Savings past 24 hours X
Cases checked last hour X X
Mean automated check time
for a claim
X
Following the steps of the process documented in
Figure 3, the claims checking process was modelled;
the metrics were defined and associated to the two
roles (Insurance Manager and IT Manager). Using
aPro, a monitoring infrastructure and code-stubs for
the connection of the claims checking software with
the monitoring infrastructure as well as two
dashboards were automatically generated.
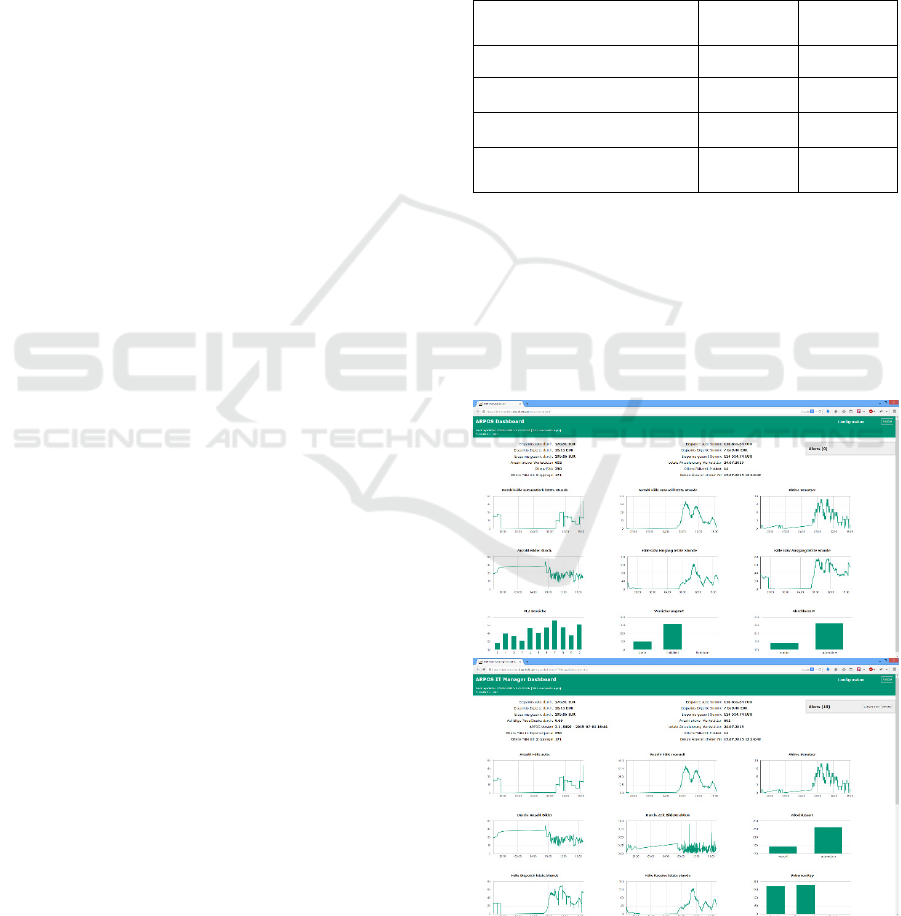
Figure 9: Screenshots of the resulting dashboard for the
roles Insurance Manager (top) and IT Manager bottom) as
used in a production environment.
Creating User-specific Business Process Monitoring Dashboards with a Model-driven Approach
359

An overview of the generated dashboards (after
some minor adaptions, such as changes of chart titles
and resorting of some visualisations) can be seen in
Figure 9.
The role-specific dashboards have been used in
production for several months. An Insurance
Manager is using one dashboard on a daily basis to
track the performance of his/her team. IT Managers
use their own dashboards to identify times of
intensive and less intensive use of the tool, among
other reasons in order to best determine time slots to
apply patches. The IT Managers can also benefit from
the alert mechanisms to be informed quickly when a
component of the system fails or process activities
don’t finish on time.
As the process and its KPIs evolved, changes to
the dashboards were necessary. To change a
dashboard, new KPIs can be associated with roles and
the user-specific dashboards can be re-generated
without interrupting the process or monitoring. To
end-users, the new configuration is available after a
browser refresh.
Overall, when considering the requirements for
the generation of role-specific dashboards mentioned
at the end of section 2, it can be stated that:
The proposed approach allows to show
each user the information relevant to
them, and only this information.
The view model used allows a free
definition of views (and a free definition
of users and roles).
The model used allows a definition of
views for process elements as well as for
metrics.
User-specific dashboards can be
generated automatically (with some
minimum work needed for the
integration within existing systems, to
send data to the monitoring
infrastructure) following the previously
specified model-driven approach.
The evaluation shows that these requirements are
fulfilled and that the solution is suitable for providing
user specific dashboards for a monitored process
without cumbersome manual design, implementation
and deployment.
7 SECURITY ASPECTS
The current implementation of the user-specific
dashboard generation ensures that each user by
default sees the data relevant to their tasks (as defined
in the views on the process and goal model). It
however does not provide any guarantee that a user
cannot access data that they shouldn’t be able to see,
for example by manually editing the VisML
dashboard description file.
This was not yet implemented as it was not a
requirement in our evaluation use case, were all users
are allowed to see all data (even though some data sets
are more or less interesting to them).
Should this requirement be critical for another use
case, an adaption of the implementation would be
feasible (and relatively simple) with following
approach:
(1) When loading a dashboard configuration file
in a dashboard rendering software, a user has to enter
a username and password.
(2) The username and password are sent to an
access checker component each time a dashboard
refresh requires new data.
(3) The access rights checker component
forwards accepted request to the data provider, sends
empty data sets (or an error message) otherwise.
(4) The dashboard rendering component can
display the charts as usual upon reception of the data.
The link between dashboard rendering, data
provider, and access rights checker is presented on
Figure 8.
8 CONCLUSION AND OUTLOOK
This paper showed how a model-driven architecture
for process monitoring can be extended to generate
user-specific dashboards, showing each user only the
data relevant to them. For this, the models and the
generation engines were extended. A prototypical
implementation was evaluated with a real-world use-
case from the insurance claim management domain.
It has been showed that the approach is suitable to
create and change user-specific dashboards with
minimal effort.
For future work, the following topics are being
considered: (1) Focusing on the monitoring of
compliance to rules and regulations, with specific
new models and visualisations (2) Extending the
approach to use-cases from manufacturing industry
(currently mostly service-related use-cases are
supported). This also requires an extension of the
models. First steps in this direction have already been
undertaken (Kötter & Krause 2015).
MODELSWARD 2017 - 5th International Conference on Model-Driven Engineering and Software Development
360

REFERENCES
Aschenbrenner, M. et al. eds., 2010.
Informationsverarbeitung in Versicherungen – Eine
stark vernetzte Anwendungslandschaft, Berlin
Heidelberg: Springer.
Chowdhary, P. et al., 2006. Model-Driven Dashboards for
Business Performance Reporting. In P. Themis, ed.
10th IEEE International Enterprise Distributed Object
Computing Conference (EDOC 2006). Hong-Kong:
IEEE, pp. 374–386.
Decker, G., Overdick, H. & Weske, M., 2008. Oryx – An
Open Modeling Platform for the BPM Community. In
M. Dumas, M. Reichert, & M.-C. Shan, eds. Business
Process Management SE - 29. Lecture Notes in
Computer Science. Berlin, Heidelberg: Springer, pp.
382–385.
Eckerson, W.W., 2010. Performance dashboards:
measuring, monitoring, and managing your business,
Hoboken, New Jersey: Wiley.
Few, S., 2013. Information Dashboard Design - Displaying
data for at-a-glance monitoring, Burlingame,
California: Analytics Press.
Kim, H. et al., 2007. Design and Implementation of a
Personalized Business Activity Monitoring System. In
12th International Conference, HCI International
2007, Beijing, China, July 22-27, 2007, Proceedings,
Part IV. Berlin Heidelberg: Springer Verlag, pp. 581–
590.
Kintz, M., 2012. A Semantic Dashboard Description
Language for a Process-oriented Dashboard Design
Methodology. In T. Schlegel, R. Kühn, & S.
Pietschmann, eds. Proceedings of 2nd International
Workshop on Model-based Interactive Ubiquitous
Systems (MODIQUITOUS 2012). Copenhagen: CEUR-
WS.org.
Kötter, F. & Kochanowski, M., 2013. A Model-Driven
Approach for Event-Based Business Process
Monitoring. In M. Rosa & P. Soffer, eds. Business
Process Management Workshops. Lecture Notes in
Business Information Processing. Berlin, Heidelberg:
Springer, pp. 378–389.
Kötter, F. & Kochanowski, M., 2012. Goal-Oriented
Model-Driven Business Process Monitoring using
ProGoalML. In Proceedings of the 15th International
Conference on Business Information Systems (BIS
2012). Berlin, Heidelberg: Springer.
Kötter, F., Kochanowski, M. & Kintz, M., 2014.
Leveraging Model-Driven Monitoring for Event-
Driven Business Process Control. In Modellierung
2014. Vienna, Austria.
Kötter, F. & Krause, T., 2015. Production Process
Monitoring Using Model-Driven Event Processing
Networks. In M. A. Jeusfeld & K. Karlapalem, eds.
Advances in Conceptual Modeling (ER 2015
Workshops AHA, CMS, EMoV, MoBID, MORE-BI,
MReBA, QMMQ, and SCME, Stockholm, Sweden,
October 19-22, 2015, Proceedings). Copenhagen:
Springer International Publishing.
Latuske, G., 2010. Sichten auf Geschäftsprozesse als
Werkzeug zur Darstellung laufender Prozessinstanzen.
Universität Stuttgart.
Muehlen, M. Zur & Rosemann, M., 2000. Workflow-based
process monitoring and controlling-technical and
organizational issues. In Proceedings of the 33rd
Annual Hawaii International Conference on System
Sciences. IEEE, pp. 1–10.
OASIS, 2007. Web Services Business Process Execution
Language Version 2.0. Available at: http://docs.oasis-
open.org/wsbpel/2.0/OS/wsbpel-v2.0-OS.html
[Accessed October 26, 2015].
Odell, J. et al., 2003. Changing Roles: Dynamic Role
Assignment. Journal of Object Technology, 2(5),
pp.77–86.
Renner, T., 2006. Dienstleistungen automatisieren -
Potenziale, Vorgehensmodelle und Lösungen,
abgeleitet aus Erfahrungen in der
Versicherungswirtschaft. In D. Spath, ed.
Technologiemanagement in der Praxis. Stuttgart:
Fraunhofer IRB Verlag.
Schumm, D., Leymann, F. & Streule, A., 2010. Process
Viewing Patterns. In 14th IEEE International
Enterprise Distributed Object Computing Conference.
IEEE, pp. 89–98.
Streule, A., 2009. Abstract Views on BPEL Processes.
University of Stuttgart.
Creating User-specific Business Process Monitoring Dashboards with a Model-driven Approach
361
