
Combined High-Resolution Imaging and Spectroscopy System
A Versatile and Multi-modal Metrology Platform
Tobias Hegemann, Fabian B
¨
urger and Josef Pauli
Intelligent Systems Group, University of Duisburg-Essen, Bismarckstraße 90, 47057 Duisburg, Duisburg, Germany
Keywords:
Imaging, Spectroscopy, Surface Analysis, Metrology, Calibration.
Abstract:
Multi- and hyperspectral measurement methods are a versatile approach to analyzing and understanding ma-
terial properties. Especially imaging techniques allow for a precise sensing of surface properties. This paper
presents a novel and multi-purpose metrology platform for high-resolution spectral measurements. The sys-
tem is able to acquire multispectral images with six different spectral channels as well as hyperspectral point
measurements and images. This is realized with a combined measurement head that includes a gray value
camera as well as two spectrometers ranging from 190nm to 1,700nm. A three axis Cartesian robot with
nanometer-precision allows the analysis of large samples with a size up to 40 × 10 × 10 cm and a weight
of up to 25kg. Approaches to automatically focus both the camera and the spectrometers are presented. The
calibration process between the camera and the spectrometers, which is necessary to acquire the full spectral
information corresponding to each pixel of the camera image, is described. Example images and measure-
ments are discussed to show the potential of the metrology platform.
1 INTRODUCTION
The analysis of a wider range of the electromag-
netic spectrum offers the chance to obtain more in-
formation about materials and the quality of sam-
ples. To this effect a unique measurement system was
built, the flexible and multi-modal metrology plat-
form CHRISS: Combined High-Resolution Imaging
and Spectroscopy System. CHRISS allows for multi-
and hyperspectral material analysis which offers more
information than color images and may be employed
in various application fields such as industrial inspec-
tion, defect detection, material classification or food
quality, but also in medical contexts such as tumor
identification (Panasyuk et al., 2007). By analyzing
materials with respect to their properties in the elec-
tromagnetic spectrum, it is possible to differentiate
between substances, learn about the composition of
materials in a sample or evaluate the heterogeneity
of a specimen. This provides challenges concerning
both hardware, as specialized equipment is needed,
and software. CHRISS is built to comply with the
hardware challenges, and software solutions were im-
plemented to enable autofocusing both camera and
spectrometer unit as well as providing interaction be-
tween those two units. This paper is organized as fol-
lows: In section 2, spectroscopy in its different types
is presented, followed by an overview of the devel-
oped system in section 3 and an outline of the com-
bined measurement head of camera and spectrometer
unit in section 4. In section 5, the autofocus of the
camera and the spectrometer unit as well as the cali-
bration between the two units is explained. The paper
is concluded with a brief discussion of this work and
a notion of future work is given.
2 ESTABLISHED
MEASUREMENT PRINCIPLES
Spectroscopy is the study of the interaction be-
tween matter and electromagnetic radiation (Skoog
and West, 1980). While there are other types of
spectroscopy such as vibrational (Long, 1977) and
emission spectroscopy (Radziemski and Cremers,
2006), this paper discusses reflectance spectroscopy
(Kort
¨
um, 2012) since this type is used in the presented
measurement system. Reflectance spectroscopy is
concerned with the materials’ light absorption and
reflectance properties. Different substances reflect
wavelengths of light distinctly differently so that the
reflectance characteristic of an object can give some
indication of the object’s material or at least help to
differentiate between two objects that look alike to the
human eye.
Hegemann T., BÃijrger F. and Pauli J.
Combined High-Resolution Imaging and Spectroscopy System - A Versatile and Multi-modal Metrology Platform.
DOI: 10.5220/0006134602150222
In Proceedings of the 5th International Conference on Photonics, Optics and Laser Technology (PHOTOPTICS 2017), pages 215-222
ISBN: 978-989-758-223-3
Copyright
c
2017 by SCITEPRESS – Science and Technology Publications, Lda. All rights reserved
215

It is possible to differentiate between 1-
dimensional and polydimensional measurement
techniques. The former denotes a point measurement,
also called a whisk broom scanner (Green et al.,
1998), in which the full spectral data is obtained for
a single point, while the latter applies to line-scan
systems, area scanning and snapshot imaging. A
line-scan system, also known as a push broom
scanner (Weser et al., 2008), is able to acquire the
spectral data for one line instead of a single point.
For an image with a width of x pixels and a height of
y pixels, the push broom scanner obtains spectral data
(λ) for every pixel x in one line (y
i
) simultaneously.
To acquire the whole data cube, the push broom only
has to scan each of the y lines, making the method
faster than a whisk broom scanner which has to
scan x × y times in order to obtain the whole data
cube. However, the push broom scanner is not as
versatile as a whisk broom scanner, as the width of
the scanning unit is fixed and it is thus not possible
to freely choose the part of the sample for which to
acquire hyperspectral data. Area scanning, also called
spectral scanning (Dickinson et al., 2001), is another
technique which allows for surveying the whole
image monochromatically, meaning that a value for
every pixel of the image is obtained for one certain
wavelength λ. This can be achieved either by using
a broadband light source and an optical band-pass
filter, which rejects all but one wavelength and may
be tunable or has to be replaced in order to allow for
more wavelengths to be scanned, or alternatively by
using a light source with adaptable spectrum. With
this technique, it is easy to choose certain spectral
bands for the whole image. However, in order to
acquire data of several wavelengths, the station has
to be stationary, as otherwise spectral smearing can
occur, thus deteriorating correlations of an object at
multiple wavelengths. Finally, snapshot imaging, also
referred to as non-scanning (Volin et al., 2001), is a
technique which allows for obtaining the whole data
cube at once. This is naturally very time-efficient, but
computational effort and initial costs are high.
For the metrology platform presented in this pa-
per, a point scanner was chosen as it is the most ver-
satile of the described techniques and also the most af-
fordable. Due to the positioning robot, which allows
for nanometer-exact positioning, a high-resolution
spectral image can be obtained for heterogeneous
samples. Furthermore, the choice of the character-
istics of the spectrometers is flexible and almost any
wavelength range can be analyzed. The only draw-
back is the relatively slow capturing process com-
pared to the other recording approaches.
3 SYSTEM OVERVIEW
Atop of a vibration damped optical table, a three axis
Cartesian robot with nanometer-precision and a com-
bined measurement head for large area gray value
images as well as spectral measurements is placed.
A lighting system encompassing LEDs in different
colors and infrared along with an ultraviolet light
provides the means to acquire multispectral images,
while a broadband halogen light facilitates hyperspec-
tral image acquisition with the aid of spectrometers.
An overview of the system’s exterior, with the impor-
tant instruments and parts of CHRISS, as well as the
system’s main components of the interior, is presented
in Figure 1.
3.1 Enclosure
The core of the system is mounted atop the vibra-
tion damped optical table manufactured by the Opta
GmbH and is surrounded by a light-proof enclosure
construction with a canvas hull. Building vibration
is a problem when dealing with high-precision image
acquisition. In order to handle this problem, a table
which absorbs most of the vibration is used, thus en-
suring that the measurement of the sample is not cor-
rupted. A granite surface plate manufactured by the
company Johann Fischer Aschaffenburg is used as the
precise base for transacting measuring and inspection
tasks. It guarantees a flatness of the measuring sur-
face according to DIN 876 and is thus important for
nanometer-precise measurements.
Additionally, the influence of variable daylight
has to be minimized to ensure that measurements of
the same sample are always comparable. For that rea-
son the opaque enclosure is important, ensuring that
only the internal lighting system illuminates the sam-
ple. Since the user has to be able to access the interior
to, for example, replace samples, a roller blind has
been installed on the front of the canvas hull which
can be lowered to make the enclosure light-proof.
Due to the fact that the stages of the Cartesian
robot are only guaranteed to operate with nanometer-
precision at 20 degrees Celsius, the room is equipped
with an air conditioning unit. Since the lighting sys-
tem, especially the halogen light, causes the air within
the enclosure to heat up, a ventilation system inter-
changing the warm interior and the cool exterior air
is necessary to ensure the high-precision work of the
positioning robot. A thermometer system with three
measuring points provides information about the tem-
perature within the enclosure so that the user is able
to assess the precision of the positioning system.
PHOTOPTICS 2017 - 5th International Conference on Photonics, Optics and Laser Technology
216

UV spectrometer
Ventilation
system
Light proof
enclosure
Network-
controlled
socket outlet
Ventilation
control
Optical table
Stages
control
system
Color LED
lights
IR light
UV light
Measurement
head
X stage
(a) (b)
Figure 1: Overview of the measurement system. Figure (a) shows the exterior of the measurement system. Figure (b) shows
the main components of the interior. The NIR spectrometer is not visible, because it is behind the enclosure.
3.2 Cartesian Robot
The Cartesian Robot is equipped with a three-axis
high-precision positioning system manufactured by
the company Aerotech. The x-stage may carry a high
payload of up to 25kg over a distance of 40 cm with
a speed of up to 100 mm/s. It is an air-bearing lin-
ear stage which allows for positioning accuracy of
1 nanometer of samples. On the other hand, the y-
and z-stage are connected and hold the measurement
head. The y-stage is a cross roller bearing stage and
is used to position the measurement head over the re-
gion of interest, while the z-stage is an air-bearing lin-
ear stage and its position determines the focus of the
measurement head with respect to the sample. Since
the focal length of both the gray value camera and the
spectrometers is fixed, the distance of the measure-
ment head to the sample has to be adjusted to obtain
images in focus.
3.3 Illumination System
The illumination system consists of four white LED
lights, three of which are equipped with an additional
color filter to obtain blue, green and red light. Further-
more an infrared (IR) LED and an ultraviolet (UV)
light are installed so that images beyond human vi-
sion can be acquired. The illumination system is man-
aged by a network-controlled socket outlet, the All-
net ALL4076, so that each light can be switched on
and off automatically by the system. Using these six
lights and the gray value camera, it is possible to ac-
quire multispectral images by taking one image with
the camera for each light source thus obtaining a mul-
tispectral image with 6 spectral channels (gray value,
blue, green, red, UV and IR). Additionally, a broad-
band halogen lamp is mounted near the measurement
head and moves together with it in order to produce
light for the spectrometers. The halogen light offers
a broad spectrum of light ranging from approximately
400nm to 1700nm, thereby providing light for the ma-
jority of the acquirable spectrum, while neglecting the
ultraviolet region. The acquisition of a light type more
suitable to the task, which ensures that data in the UV
region as well as in the visible and near IR spectrum
can be obtained, like a confocal broadband fiber op-
tics light source, is planned for the future.
4 MEASUREMENT HEAD
The measurement head is a combined system of cam-
era and spectrometer units in which both units are
mounted on rails along the z-axis. The measurement
location of camera and spectrometers are distinct be-
cause of the offset between camera and spectrome-
ter unit along the y-axis, as can be seen in Figure 2.
Since the relative position of camera and spectrome-
ter unit can be calibrated (see section 5.3), it is pos-
sible to scan an area first with the camera in order to
find the desired section of the sample and then acquire
the full spectral range in one or several defined points
by means of the spectrometer module. This combina-
tion of camera and spectrometer units, along with the
high-precision positioning system, offers a versatile
approach of scanning large areas with the camera to
find regions of interest which can be examined more
closely by utilizing the spectrometers.
Combined High-Resolution Imaging and Spectroscopy System - A Versatile and Multi-modal Metrology Platform
217

Camera
Image sensor
Camera lens
Objective tube
Fiber to NIR
spectrometer
=1000-1700nm
Fiber to UVVIS
spectrometer
=190-1000nm
Microscope lens
Dichroic filter
Sample
X stage
Spectrometers
measurement
point/area
Y stage
Z stage
Mounting rails
Objective tube
Camera
area
Light di usor
tube
(a) (b)
Figure 2: Detail description of the measurement head. Figure (a) shows the components and the light paths. Figure (b)
depicts the actual system with the side-mounted light source for the spectrometers.
4.1 Camera Module
For the camera module, the industrial gray value cam-
era Baumer SXG80 with a resolution of 3296 × 2472
pixels (8 megapixel CCD sensor) is used. In com-
bination with the objective inspect.x L 105mm man-
ufactured by the company Qioptiq, which allows for
2x magnification while featuring very low optical dis-
tortion, it is utilized to obtain high-resolution surface
scans of a sample. The camera module is especially
applicable when inspecting large samples for defects,
as it is used to localize regions of interest. In combi-
nation with the illumination system, it is possible to
acquire multispectral images with 6 waveband chan-
nels, as can be seen in figure 3. Although the cam-
era may only acquire images of a small section of the
sample, i.e. approximately 2 × 2 cm, the position-
ing system in combination with a stitching module
facilitates the attainment of large-area images. Image
stitching allows for the acquisition of large scale im-
ages, but poses the problem of possibly creating visi-
ble seams where two images meet. Due to the fact that
the camera in CHRISS is not perfectly aligned with
the positioning stage, it is necessary to compensate
the problem of slightly rotated images by cropping
them, thus only using the inner part of the overlap-
ping images. In this way, the stitching module yields
large area scans of the surface of the sample without
visible seams, which can be seen in Figure 4.
In order to be able to reduce the impact of lumi-
nous reflectance and unevenness of samples, a light
dispersion unit can be utilized. This unit is placed be-
tween camera objective and sample so that light from
the light source in use does not directly illuminate
the sample but the dispersion unit instead, which pro-
vides a uniform light distribution and ensures a dif-
fuse illumination setting. As a consequence, shad-
ows casted by surfaces with 3D structure can be mini-
mized. Thus, images of samples are generally less af-
fected by problems of uneven surfaces and reflections
caused by direct illumination of glossy surfaces. To
this effect, either a semi-transparent cylindrical dis-
persion unit for a diffuse bright field or an opaque
cylinder for a dark field can be utilized, the results
of which can be seen in Figure 5.
4.2 Spectrometer Module
The presented measurement system utilizes re-
flectance spectroscopy to facilitate a more detailed ex-
amination of samples. The spectrometer module con-
sists of two separate spectrometers which are com-
bined in order to acquire a wide range of spectral data
for a single point. For the purpose of obtaining data
ranging from the near ultraviolet region (190-390 nm)
to the visible spectrum (390-700 nm) up to the begin-
ning of near infrared data (700-1,100 nm) the BaySpec
Super Gumet UV-NIR spectrometer is utilized, while
the BaySpec Super Gamut NIR spectrometer, with a
range of 900 to 1,700 nm, is used to extend the exam-
inable scope of IR data. To acquire the full spectrum
(190-1,700 nm) at one single point, the spectrometers
are combined using a dichroic mirror that serves as a
filter which reflects light of a certain spectrum while
allowing the remaining light to pass through. In this
case a dichroic mirror at λ = 1,000 nm is used, mean-
ing that light below 1000 nm is reflected while light
above 1000 nm passes the filter unimpeded. From the
PHOTOPTICS 2017 - 5th International Conference on Photonics, Optics and Laser Technology
218
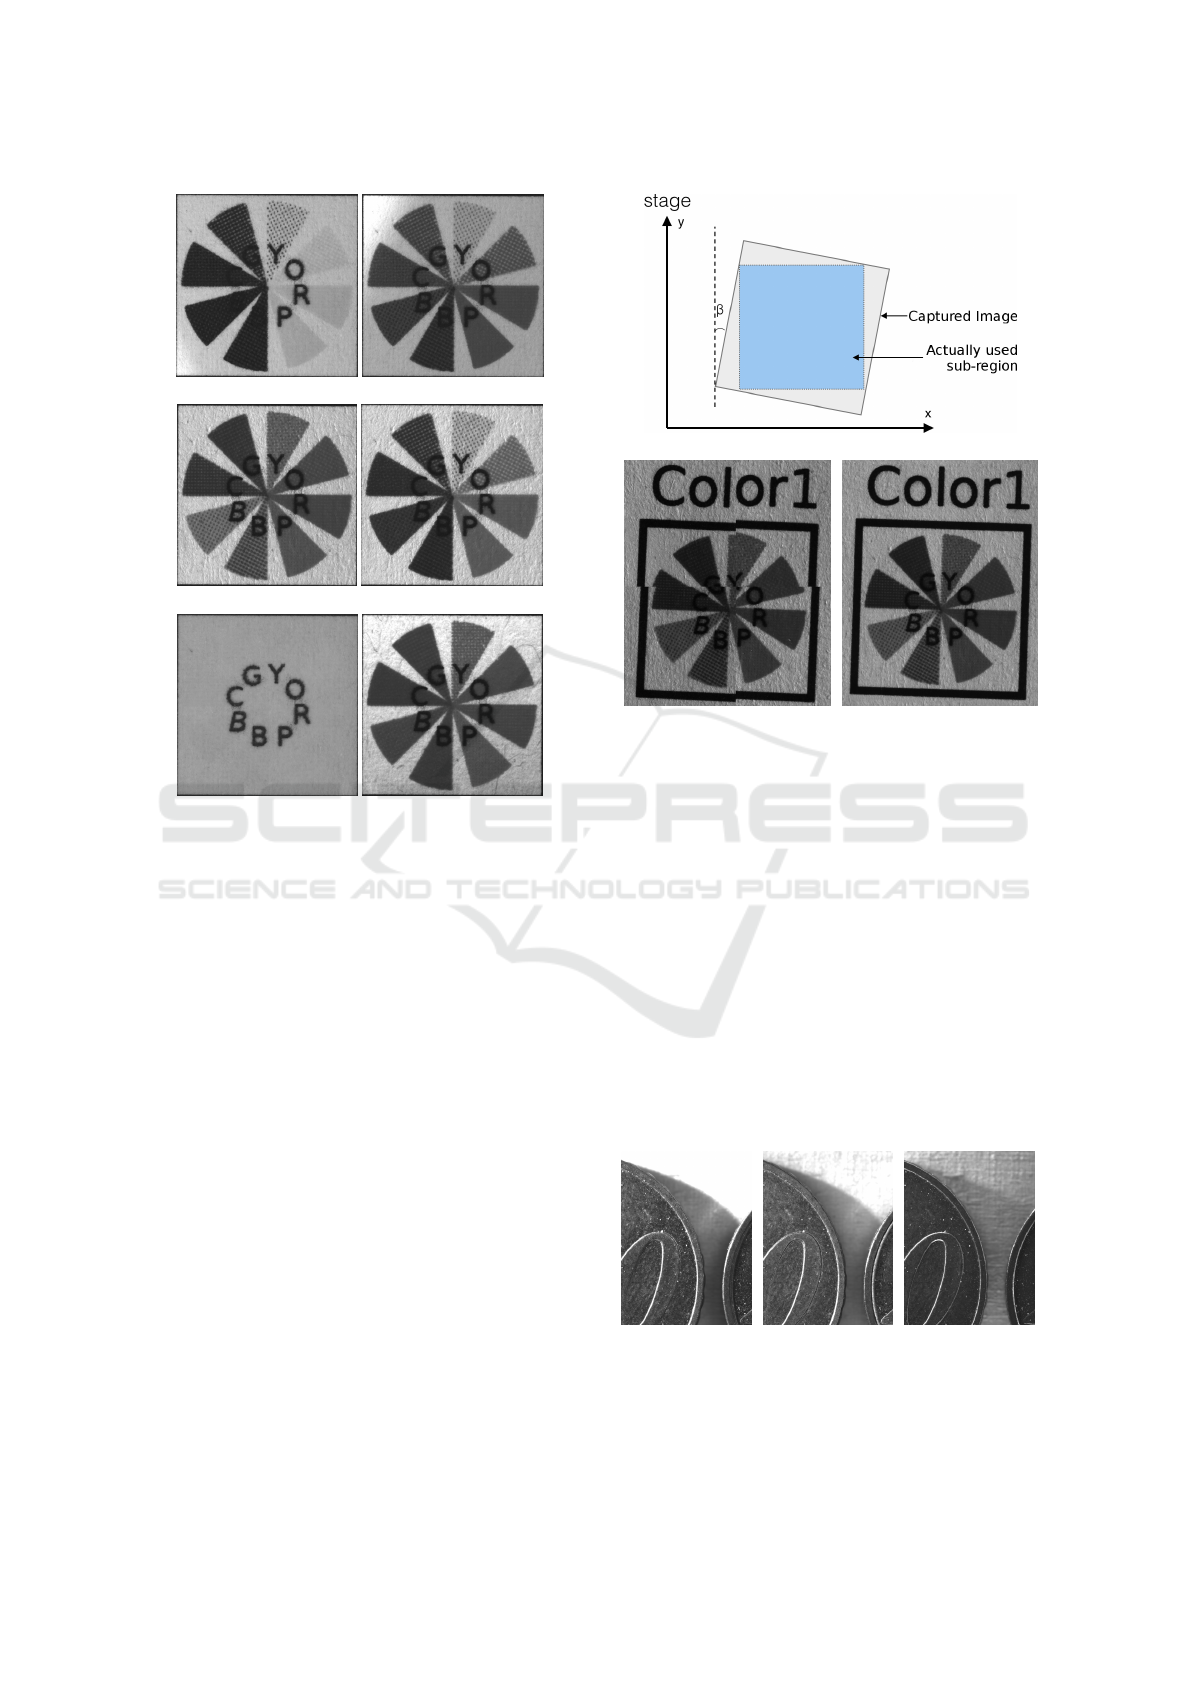
(a) Red (b) Green
(c) Blue (d) White
(e) IR (f) UV
Figure 3: Multispectral image channels with denoted light
sources. The sample is a colored calibration pattern printed
on paper.
dichroic filter, two fiber optic cables lead to the re-
spective spectrometers where the optical signal is dis-
cretized. In this way, it is possible to have two spec-
trometers acquiring data from nearly the same area,
as depicted in Figure 2 (a). In order to minimize the
size of the area, thus allowing for more accurate mea-
surements with higher resolution, a microscope lens,
namely the Nikon TU Plan Fluor 10x, is attached to
the end of the objective tube of the spectrometer head.
In this way, a point resolution of 60 µm is achieved.
A total of 3,904 measurements can be obtained
with the two spectrometers for each sample point,
3,648 of which are conducted by the UV-NIR spec-
trometer, which amounts to 3.97 measurements per
nanometer of the spectral band, while the NIR
spectrometer offers an additional 256 measurements
with a spectral resolution of 0.32 measurements per
nanometer. Even though the resolution of the NIR
spectrometer is inferior to the other spectrometer,
both of them are important to ensure the applicability
of the system to a wide variety of tasks, in particular
those for which the IR spectrum is significant, as, for
example, in quality inspection of steel surfaces.
(a)
(b) (c)
Figure 4: (a) Demonstrates the rotation shift between cam-
era and stage. (b) Shows naively stitched image from 4
input images without rotation correction, (c) the result ob-
tained by the presented stitching module with rotation cor-
rections.
5 CAMERA TO SPECTROMETER
CALIBRATION
Calibration is a very important topic in the scope of
CHRISS. This is due to the fact that the ability to ob-
tain the point spectrum for each pixel in the camera
image is desirable. The first aspect of the proposed
calibration method is the focus of the camera in or-
der to achieve sharp images. To this effect, an autofo-
cus module has been developed, which is described in
(a) No dispersion (b) Bright field (c) Dark field
Figure 5: Image of reflecting surface with and without dis-
persion units. Shadows and reflections can be significantly
reduced by using bright and dark field. However, more pow-
erful lights are required for the dark field.
Combined High-Resolution Imaging and Spectroscopy System - A Versatile and Multi-modal Metrology Platform
219

section 5.1. Since the spectrometer unit is also an op-
tical device, it needs to be focused as well. Section 5.2
provides the specification of the spectrometer focus.
Subsequently, the coordinate system of the spectrom-
eter unit can be calibrated to the camera’s coordinate
system, in order to obtain the point spectrum for each
pixel in the camera image.
5.1 Camera Focusing
In order to obtain camera images in focus, the dis-
tance of the camera to the sample is important so that
the focal point of the camera coincides with the posi-
tion of the image plane. Therefore, the camera has to
be moved along the z-axis until the focal length con-
curs with the distance of the image plane to the lens.
To be able to automatically evaluate the image focus,
an image-based approach has been chosen. A focus
metric was implemented based on the Brenner gradi-
ent described in (Yazdanfar et al., 2008). The Brenner
gradient was extended to obtain a metric in which not
only vertical edges are considered but also horizontal
edges. The modified Brenner metric B is calculated
by
B =
N
∑
i=1
M
∑
j=1
(
|s(i−1, j)−s(i+1, j)|+|s(i, j−1)−s(i, j+1)|
2
)
2
,
where s(i, j) is the gray value of pixel (i, j) and N and
M are the number of horizontal and vertical pixels re-
spectively. Since an edge in an image induces a sig-
nificantly higher contrast between neighboring pixels,
B increases with more edges in an image and since in-
focus images contain more sharp edges, B is accord-
ingly higher for sharp images. The metric B has to
be maximized in order to obtain in-focus images and
according to (Yazdanfar et al., 2008) a focus function
f depending on the vertical position of the camera z
can be approximated by a Lorentzian function
f (z) = y
0
+
1
π
∗
α
(z−z
0
)
2
+α
2
,
with α specifying the width, z
0
the center and y
0
the
offset of the curve in y-direction.
A hybrid approach for the autofocus of CHRISS
has been chosen, which comprises a naive and a curve
fitting approach. The naive approach is basically a
grid search for the optimal z so that B is maximized.
The curve fitting approach is faster but less accu-
rate and works with three images taken from differ-
ent heights which suffices to fit a Lorentz function
to the data points using MSE-minimizing curve fit-
ting. A Lorentzian function has a single maximum at
z
0
. The z-coordinate corresponds directly to the op-
timal z-position of the camera to obtain in-focus im-
ages. Combining both approaches also combines the
advantages, i.e. the approach is faster than the naive
grid search but gives more accurate results compared
to the curve fitting approach. On average, the cam-
era is positioned within 0.039 mm of the optimal z-
position in 3.67 seconds.
5.2 Spectrometer Focusing
In order to focus the spectrometer unit, an adapta-
tion of the Brenner-based camera image focus pro-
cess is proposed. Since the spectrometers do not cap-
ture an image but instead just a single ”pixel” with
almost 4000 different wavelengths, the focusing ap-
proach described above cannot be applied without ad-
justments. However, the principle of examining the
sharpness of edges is still valid. The idea is to use
a sample pattern with two distinct areas, a black and
a white one. After positioning the spectrometer head
over the white part of the sample in an initial z po-
sition, the measurement head is moved in the y di-
rection, to the black area of the sample. In between,
several measurements are carried out so that the inten-
sity value for each waveband and each position on the
y-axis is obtained. Using only the wavelength with
the highest variation, it is possible to locate the point
of transition from white to black by determining the
maximum change between two measurements. This
is reasonable as it can be assumed that the difference
between two measurements is higher for sharp tran-
sitions and lower for blurry edges. The spectrome-
ter head is moved in the z-axis after the procedure of
finding the maximal intensity difference ∆I
z
0
, and the
next maximal intensity difference is determined. In
this way it is possible to find the z-position in which
the spectrometer unit delivers sharp measurements by
determining the z-position in which the maximum
change max(∆I
z
n
) occurs.
Since the measurement system comprises two sep-
arate spectrometers and since both of the optical fiber
cables were manually positioned and fixated, and are
thus not centered perfectly on the optical axis, the
focus point of the two spectrometers differs slightly.
It is therefore possible to find different optimal z-
positions for both spectrometers, however, to allow
for faster intensity value acquisition of all wave-
lengths in one point, the mean value of the two best
z-positions is taken as the optimal z
best
.
5.3 Point Calibration
Point calibration describes the process of finding the
same point in a camera image and with the spectrom-
eter unit. This should be possible so that regions of
interest, which were found by analyzing the image ob-
tained with the camera, can be examined more closely
by means of utilizing the spectrometers. In order to
PHOTOPTICS 2017 - 5th International Conference on Photonics, Optics and Laser Technology
220

(a) Coarse calibration pat-
tern.
(b) Fine calibration pattern.
Figure 6.
find the same point with camera and spectrometers,
the coarse calibration pattern, which is shown in Fig-
ure 6 (a), is used. It is easily possible to find the cor-
ner at the center of the pattern using a regular image,
however, since the spectrometers only scan one point
at a time, it is a challenging task to find the corner
using the spectrometers. In order to do so, the user
places the calibration pattern approximately under the
spectrometer head and a number of measurements are
taken along the y-axis for the purpose of finding the
horizontal edge, similarly to detecting the edge when
focusing the spectrometers. When the y-coordinate of
the edge is found, the measurement head is moved in
the x-axis and the process of finding the edge is re-
peated so that several y-coordinates are found corre-
sponding to the horizontal edge. In a respective way
several x-coordinates are determined for the vertical
edge. The intersection point of the two lines obtained
in this way corresponds to an approximation of the
target corner of the calibration pattern. Since this is
only a coarsely estimated target point, it is possible
to improve upon the results by taking an array of hy-
perspectral measurements in the vicinity of the found
intersection point, as can be seen in Figure 7 (a). The
obtained data can be regarded as a large number of
images by considering a single wavelength at a time,
thus obtaining a total of 3,904 images. Each image is
preprocessed with morphological filters using struc-
turing elements (Efford, 2000). By utilizing a combi-
nation of the Canny edge detector (Canny, 1986) and
Hough transform (Duda and Hart, 1972), it is pos-
sible to find a proper representation of the two per-
pendicular lines in each image. The intersection of
the two lines is determined for each image and the
median coordinates of the intersection points are cal-
culated in order to find an accurate representation of
the target corner point. To find the exact offset of the
camera to the spectrometer head, several more aspects
are taken into consideration. It is necessary to find
the size of pixels in the camera image to translate a
distance in the image coordinate system (CS) to the
positioning stage CS and also determine the rotation
(a)
(b)
(c)
(d)
(e)
Figure 7: Calibration results. (a) shows the selected area
of the image with green dots indicating spectrometer mea-
surement locations. (b) and (c) reveal the results for UV-
NIR and NIR spectrometer respectively after coarse cali-
bration, i.e. blurry lines and corner does not match center
point (black plus). (d) and (e) show improved results with
sharper lines and lower offset between center and corner
for the two spectrometers with wavelengths of 702 nm and
1360 nm respectively.
between camera and the stage. Since the camera was
installed manually, it is not perfectly aligned with the
axis of the stage, therefore a rotation parameter has
to be found in order to move the stage properly with
respect to the information provided by the camera im-
age. It is also necessary to consider that the found
intersection point differs for the two spectrometers,
as explained above, hence the mean value of the two
coordinates of the intersection points is used as an es-
timate of the corner. To improve the results, a fine
calibration pattern
1
, cf. see Figure 6 (b), manufac-
tured by means of a laser instead of a printer and thus
more precise, is used. The results of calibrating with
both patterns can be seen in figure 7. The calibration
process takes about 67 minutes both for coarse and
fine calibration, but it only has to be done once un-
1
USAF-1951 Standard Target (T-20).
Combined High-Resolution Imaging and Spectroscopy System - A Versatile and Multi-modal Metrology Platform
221

less the hardware setup of the measurement system
is changed. Experiments show that the hyperspectral
images reach a lateral resolution of 60 micrometers.
6 CONCLUSIONS
With CHRISS, a unique, flexible and versatile mea-
surement system has been developed which contains
a high-resolution camera able to obtain multispectral
images, also considers a wide area of wavebands due
to the combined spectrometer unit and utilizes a high-
precision positioning system which allows for thor-
ough analysis of large samples. The hardware of the
attained system was presented in detail, and solutions
to the major problems of calibration and focus have
been described. Construction and implementation of
the CHRISS project is finished in general but can be
extended in the future to improve the performance, for
example by installing a more suitable light source or
by using pinholes at the junction of the spectrometer
head and the optical fiber cables of the spectrometers.
This would improve the lateral resolution of hyper-
spectral point measurements, but is only applicable in
combination with a more powerful light source as less
light is able to reach the fibers and thus the spectrom-
eters.
The system may now be used to acquire multi- or
hyperspectral data which can be analyzed. Current
projects work on clustering of hyperspectral image
data and classification of different materials in multi-
spectral space by means of Convolutional Neural Net-
works (CNN). The applicability of CNNs to hyper-
spectral image data and its classification results will
be explored in the future in order to create a measure-
ment system that holistically analyzes a large sample,
detects regions of interest and is able to examine them
more closely to detect anomalies in an otherwise ho-
mogeneous sample.
ACKNOWLEDGEMENTS
This work was funded by the European Commis-
sion within the Ziel2.NRW programme “NanoMikro
+Werkstoffe.NRW”.
REFERENCES
Canny, J. (1986). A computational approach to edge de-
tection. IEEE Transactions on pattern analysis and
machine intelligence, (6):679–698.
Dickinson, M., Bearman, G., Tille, S., Lansford, R., and
Fraser, S. (2001). Multi-spectral imaging and lin-
ear unmixing add a whole new dimension to laser
scanning fluorescence microscopy. Biotechniques,
31(6):1272–1279.
Duda, R. O. and Hart, P. E. (1972). Use of the hough trans-
formation to detect lines and curves in pictures. Com-
munications of the ACM, 15(1):11–15.
Efford, N. (2000). Digital image processing: a practical
introduction using java (with CD-ROM). Addison-
Wesley Longman Publishing Co., Inc.
Green, R. O., Eastwood, M. L., Sarture, C. M., Chrien,
T. G., Aronsson, M., Chippendale, B. J., Faust,
J. A., Pavri, B. E., Chovit, C. J., Solis, M., et al.
(1998). Imaging spectroscopy and the airborne vis-
ible/infrared imaging spectrometer (aviris). Remote
Sensing of Environment, 65(3):227–248.
Kort
¨
um, G. (2012). Reflectance spectroscopy: principles,
methods, applications. Springer Science & Business
Media.
Long, D. A. (1977). Raman spectroscopy. New York, pages
1–12.
Panasyuk, S. V., Yang, S., Faller, D. V., Ngo, D., Lew, R. A.,
Freeman, J. E., and Rogers, A. E. (2007). Medical hy-
perspectral imaging to facilitate residual tumor iden-
tification during surgery. Cancer biology & therapy,
6(3):439–446.
Radziemski, L. J. and Cremers, D. A. (2006). Handbook of
Laser Induced Breakdown Spectroscopy. John Wiley
& Sons, West Sussex, England.
Skoog, D. A. and West, D. M. (1980). Principles of in-
strumental analysis, volume 158. Saunders College
Philadelphia.
Volin, C. E., Garcia, J. P., Dereniak, E. L., Descour, M. R.,
Hamilton, T., and McMillan, R. (2001). Midwave-
infrared snapshot imaging spectrometer. Applied op-
tics, 40(25):4501–4506.
Weser, T., Rottensteiner, F., Willneff, J., Poon, J., and
Fraser, C. S. (2008). Development and testing of a
generic sensor model for pushbroom satellite imagery.
The Photogrammetric Record, 23(123):255–274.
Yazdanfar, S., Kenny, K. B., Tasimi, K., Corwin, A. D.,
Dixon, E. L., and Filkins, R. J. (2008). Simple and ro-
bust image-based autofocusing for digital microscopy.
Opt. Express, 16(12):8670–8677.
PHOTOPTICS 2017 - 5th International Conference on Photonics, Optics and Laser Technology
222
