
Impact of Airflow Rate on Amplitude and Regional Distribution of
Normal Lung Sounds
Elmar Messner
1
, Martin Hagm¨uller
1
, Paul Swatek
2
, Freyja-Maria Smolle-J¨uttner
2
and Franz Pernkopf
1
1
Signal Processing and Speech Communication Laboratory, Graz University of Technology, Graz, Austria
2
Division of Thoracic and Hyperbaric Surgery, Medical University of Graz, Graz, Austria
Keywords:
Lung Sounds, Multichannel Recording, Respiratory Flow, Acoustic Thoracic Images.
Abstract:
In computerized lung sound research, the usage of a pneumotachograph, defining the phase of respiration
and airflow velocity, is essential. To obviate its need, the influence of airflow rate on the characteristics of
lung sounds is of great interest. Therefore, we investigate its effect on amplitude and regional distribution of
normal lung sounds. We record lung sounds on the posterior chest of four lung-healthy male subjects in supine
position with a 16-channel lung sound recording device at different airflow rates. We use acoustic thoracic
images to discuss the influence of airflow rate on the regional distribution. At each airflow rate, we observe
louder lung sounds over the left hemithorax and a constant regional distribution above an airflow rate of 0.7 l/s.
Furthermore, we observe a linear relationship between the airflow rate and the amplitude of lung sounds.
1 INTRODUCTION
In auscultation, beside distinct findings like adven-
titious lung sounds, also the lung sound intensity is
used as a diagnostic marker. For example, physicians
examine the differences in intensity between left- and
right-sided lung sounds at pneumothorax condition.
Therefore, a basic knowledge about the regional dis-
tribution of normal lung sound intensity, but also its
dependence on airflow rate is essential. Moreover,
a good understanding of this dependence could ren-
der the pneumotachographdispensable for lung sound
research, because of airflow estimation directly from
lung sounds.
Several research groups already investigated the
effect of airflow rate on the amplitude and the re-
gional distribution of lung sound. Differing relation-
ships were observed in (Kraman, 1984), (Gavriely
and Cugell, 1996), (Hossain and Moussavi, 2002)
and (Shykoff et al., 1988). Recently, the authors
in (Yosef et al., 2009) showed the effect of airflow
rate on Vibration Response Imaging measurement in
healthy lungs during expiration, but also discussed the
relationship between lung sound energy and airflow
rate. The authors in (Torres-Jimenez et al., 2008a)
used a 5x5 microphone array and generated respi-
ratory acoustic thoracic images (RATHI) to discuss
the regional distribution of lung sounds, by com-
paring its performance with clinical physicians. In
(Torres-Jimenez et al., 2008b), the authors further
show RATHIs at different airflow rates.
In this paper, we independently investigate the im-
pact of airflow rate on amplitude and regional distri-
bution of normal lung sounds. For that, we recorded
lung sounds on the posterior chest of four lung-
healthy male subjects with a 16-channel lung sound
recording device (Messner et al., 2016) at airflow
rates of 0.3, 0.7, 1.0, 1.3 and 1.7 l/s during inspiration.
In contrast to other research groups, we recorded lung
sounds in supine position. Another differentiation
is the usage of uncontaminated lung sound record-
ings, i.e. free of heart and other interfering sounds.
By means of acoustic thoracic images (Charleston-
Villalobos et al., 2004), we discuss the regional distri-
bution of lung sounds dependent on airflow rate. To
generate the surface acoustic thoracic images from the
multiple lung sound signals, we use 2D-interpolation.
For each subject, we illustrate the acoustic thoracic
images at the five airflow rates independently. We ob-
serve a constant regional distribution above an airflow
rate of 0.7 l/s. Furthermore, we observe a linear rela-
tionship between the airflow rate and the amplitude of
lung sounds. Our results most closely correspond to
the findings in (Yosef et al., 2009) and are indepen-
dent of the recording position.
We organized the paper as follows. Section 2 de-
Messner E., HagmÃijller M., Swatek P., Smolle-JÃijttner F. and Pernkopf F.
Impact of Airflow Rate on Amplitude and Regional Distribution of Normal Lung Sounds.
DOI: 10.5220/0006134400490053
In Proceedings of the 10th International Joint Conference on Biomedical Engineering Systems and Technologies (BIOSTEC 2017), pages 49-53
ISBN: 978-989-758-212-7
Copyright
c
2017 by SCITEPRESS – Science and Technology Publications, Lda. All rights reserved
49
scribes the data acquisition, the subjects, the record-
ing material, the signal pre-processing and the gen-
eration of the acoustic thoracic images. Section 3
presents our observations for the regional distribu-
tion and the lung sound amplitude for different air-
flow rates. In Section 4, we discuss the results and
Section 5 concludes the paper.
2 MATERIALS AND METHODS
2.1 Data Acquisition
We recorded the lung sounds with a multichannel
recording device, which enables the simultaneous
recording of airflow (Messner et al., 2016). The
device is equipped with a multichannel lung sound
recording front-end and a pneumotachograph.
The recording front-end is a foam pad covered
with artificial leather, a similar construction as the
Stethographics STG 16 (Murphy, 2007). On the sur-
face of the pad, we arranged 16 lung sound transduc-
ers (LSTs) with a fixed pattern. The pattern is compa-
rable with the one proposed in (Sen and Kahya, 2006).
Based on the approach with air-coupled electret-
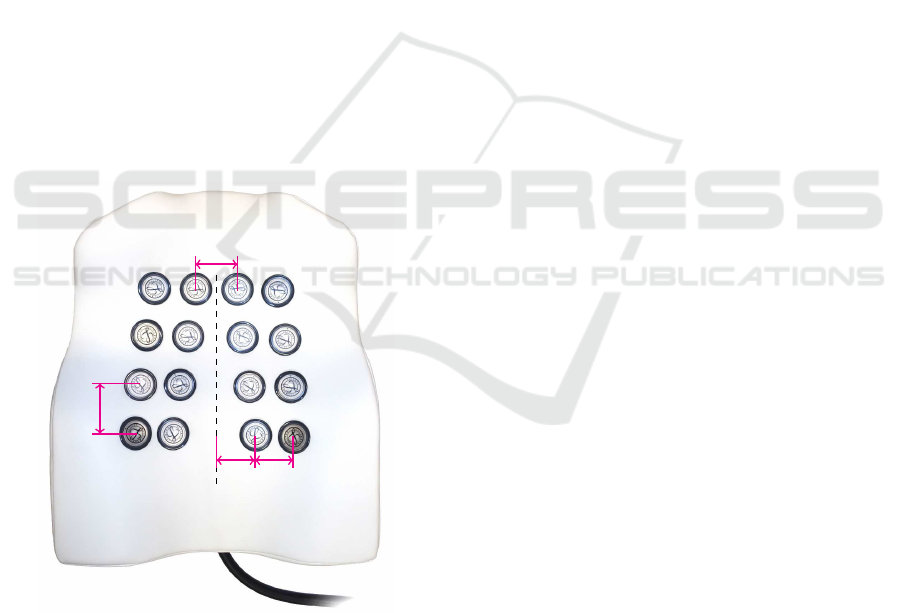
6cm
6cm 6cm
7cm
1 2
3
4
5 6
7
8
9
10
11 12
13
14
15 16
Figure 1: Multichannel recording front-end of the lung
sound recording device (Messner et al., 2016). 16 lung
sound transducers are distributed on the foam pad. The cen-
ter line represents the spine.
condenser microphones (Pasterkamp et al., 1993), we
modified Littmann Classic II chest pieces for the LST
design. By placing the foam pad under the back of the
subject, we perform the recording of the lung sounds
in supine position on an examination table.
We use standard audio recording equipment for
the analogue pre-filtering, pre-amplification, and dig-
itization of the LST signals. The sampling frequency
is f
s
= 16 kHz and the resolution is 24 bit. Before
the analog-to-digital conversion of the LST signals,
we apply a Bessel high-pass filter with a cut-off fre-
quency of f
c
= 80 Hz and a slope of 24 dB/oct.
We measure the airflow with a pneumotachograph
Schiller SP 260. The airflow signal is sampled with a
frequency f
s
= 400 Hz.
We calibrate the recording device with a Br¨uel &
Kjær sound calibrator Type 4231, a sound source with
a sinusoidal waveform at a frequency of f = 1 kHz
and with a sound pressure level of 94 dB. We adjusted
the microphone preamplifiers of the LSTs to reach the
same signal level for the sound calibrator.
2.2 Subjects and Material
At airflow rates of 0.3, 0.7, 1.0, 1.3 and 1.7 l/s, we
recorded lung sounds over the posterior chest of four
lung-healthy subjects. The subjects held the pneu-
motachograph with both hands and wore a nose clip.
The subjects breathe steadily during inspiration at the
given airflow rates and with natural breathing dur-
ing expiration. The recording setup provided a real-
time feedback for the airflow rate. The subjects were
placed on the pad with a defined distance d ≈ 7 cm
between the 7th cervical vertebra (C7) and the cen-
ter line of the topmost row of sensors. The recording
material of one subject consists of 16-channel lung
sound recordings at five different airflow rates, with
4-8 breathing cycles within 30 seconds, respectively.
The subjects were four male volunteers, with no diag-
nosed lung diseases and with the following metadata:
age (27, 27, 26, 27 years), weight (78, 75, 75, 75 kg)
and height (1.8, 1.78, 1.89, 1.72 m).
The used multichannel recording front-end is ro-
bust against ambient noise. However, in lung sound
recordings, interfering signals are caused by the heart,
bowels and body movement. These can distort the
signal energy values from lung sound signals. To en-
sure uncontaminated lung sound recordings, we man-
ually labeled the sections containing heart, bowel and
other interfering sounds.
2.3 Signal Pre-processing
We applied a bandpass filter, with a lower cut-off fre-
quency f
L
= 150 Hz and an upper cut-off frequency
f
H
= 250 Hz, to the 16 lung sound signals. To cal-
culate the energy, we used a sliding window with a
length of 50 ms and an overlap of 75 %.
BIOSIGNALS 2017 - 10th International Conference on Bio-inspired Systems and Signal Processing
50

2.4 Acoustic Thoracic Images
To illustrate the regional distribution of the lung
sound energy, we use acoustic thoracic images. We
generate the images for the left and the right hemitho-
rax independently. In particular, we use the energy
signal of the left-sided (Sensors 3, 4, 7, 8, 11, 12, 15
and 16) and right-sided sensors (Sensors 1, 2, 5, 6, 9,
10, 13 and 14), respectively. To generate an acoustic
thoracic image at a certain airflow rate, we used the
appropriate segments of the recording. We average
the energy values of all the uncontaminated segments,
i.e. labeled as free of interfering sounds (cf. Section
2.2), where the subjects reached the proper airflow
rate. For the interpolation between the energy values,
obtained from the eight sensor signals, we use the bi-
harmonic spline interpolation. The resulting acoustic
thoracic images are grayscale images (see Figure 4).
The white color indicates the minimum value and the
black color the maximum value.
3 RESULTS
3.1 Amplitude
Figure 2 shows the square root of the sound energy
as a function of airflow rate for all of the four subjects
independently. We performed linear regression for the
values from each subject independently (The results
are not shown in Figure 2).
For Subject 1, the coefficient of determination is
R
2
= 0.98, for Subject 2 it is R
2
= 0.96, for Subject 3
it is R
2
= 0.99 and for Subject 4 it is R
2
= 0.99. Figure
3 shows the spectral characteristics (i.e. power spec-
tral density (PSD)) of the lung sounds at different air-
flow rates, generated from the lung sound recording of
the sensor at position 6 (see Figure 1) from Subject 1.
0 0.5 1 1.5 2
Airflow Rate [l/s]
0
5
10
15
20
√
E [Arb. Units]
Subject 1
Subject 2
Subject 3
Subject 4
Figure 2: Square root of the sound energy
√
E as a function
of airflow rate for all four subjects.
Frequency [Hz]
10
2
10
3
PSD [dB]
-120
-110
-100
-90
-80
-70
-60
-50
-40
0.3 l/s
0.7 l/s
1.0 l/s
1.3 l/s
1.7 l/s
Figure 3: Spectral characteristics of the lung sounds at dif-
ferent airflow rates, generated from the lung sound record-
ing of the sensor at position 6 (see Figure 1) from Subject 1.
3.2 Regional Distribution
Figure 4 shows the acoustic thoracic images of four
lung-healthy subjects, evaluated at five different air-
flow rates. The grayscale images are normalized for
the respective airflow rate. For an airflow rate of
0.3 l/s, we observe that most of the energy is in the
middle right area. Already for an airflow rate of
0.7 l/s, the lung sound energy is higher towards the
base of the lungs. Above an airflow rate of 0.7 l/s, the
regional distribution remains almost constant.
Table 1 shows the mean and standard deviation of
the percentage of the summed up energy from the sen-
sors over the left, right, upper (sensor 1 to 8) and
lower hemithorax (sensor 9 to 16). The signal en-
ergy over the left lung is distinctly higher than over
the right lung. This is further reflected in the acous-
tic thoracic images, especially above an airflow rate
of 0.3 l/s. The values in Table 1 show that with in-
creasing airflow rate the percentage for the left lung
increases. Regarding the ratio of the upper to lower
hemithorax, for an airflow value of 0.3 l/s the energy
in the upper lungs is higher. With increasing airflow,
the percentage for the lower lung increases, but for
1.7 l/s it decreases again.
Table 1: Mean and standard deviation of the percentage of
the summed up energy from the sensors over the left, right,
upper and lower hemithorax for different airflow values.
0.3 l/s 0.7 l/s 1.0 l/s 1.3 l/s 1.7 l/s
Left 53±8 62±9 59±3 62±3 65±7
Right 47±8 38±9 41±3 38±3 35±7
Upper 56±13 43±5 34±3 33±4 40±1
Lower 44±13 57±5 66±3 67±4 60±1
Impact of Airflow Rate on Amplitude and Regional Distribution of Normal Lung Sounds
51

Subject 1
Subject 2
Subject 3
Subject 4
R L R L R L R L R L
R L R L R L R L R L
R L R L R L R L R L
R L R L R L R L R L
0.3 l/s 0.7 l/s 1.0 l/s 1.3 l/s 1.7 l/s
Figure 4: Acoustic thoracic images from four lung-healthy subjects, evaluated at five different airflow rates. The orientation
is indicated by the capital letters R (right hemithorax) and L (left hemithorax).
4 DISCUSSION
To compare our findings with those in (Yosef et al.,
2009), we used a similar bandpass filter, with a lower
cut-off frequency f
L
= 150 Hz and an upper cut-off
frequency f
H
= 250 Hz (see Section 2.3). Although
we lose important information from the signal in the
higher frequency range, due to the dominance of the
signal energy in the low frequency range, a higher up-
per cut-off frequency f
H
would not have a huge im-
pact on the acoustic thoracic images. According to
Figure 3 a bandpass filter with an upper cut-off fre-
quency of f
H
≈ 600 Hz could be considered.
Our findings regarding amplitude and regional
distribution of lung sounds correspond most closely
with those in (Yosef et al., 2009), although we
recorded the lung sounds in supine position. The au-
thors in (Fiz et al., 2008) already observed that, com-
pared with sitting, the supine position does not cause
a substantial change in lung sound intensity. The au-
thors in (Torres-Jimenez et al., 2008b) also observed
a constant regional distribution for RATHIs at airflow
rates of 1.0, 1.5 and 2.0 l/s. The authors in (Yosef
et al., 2009) showed the same for Vibration Response
Images at airflow rates of 1.0, 1.3 and 1.7 l/s. Re-
garding the relationship between airflow rate and the
square root of lung sound energy (see Section 3.1),
the authors in (Yosef et al., 2009) achieved for linear
regression a coefficient of determination of R
2
= 0.95.
A limitation of our experiment is the small number
of subjects n = 4 and the lack of female subjects.
5 CONCLUSIONS
In this paper, we investigate the impact of airflow rate
on amplitude and regional distribution of normal lung
sounds. Therefore, we record lung sounds with a mul-
tichannel recording device at different airflow rates.
We illustrate the regional distribution with acoustic
thoracic images.
We observe a linear dependence between airflow
rate and lung sound amplitude. In our recordings, the
signal energy from lung sounds over the left lung is
distinctly higher than from those over the right lung.
Above an airflow rate of 0.7 l/s, we observe a con-
stant regional distribution for the lung sound energy.
Although we recorded lung sounds on the posterior
chest in supine position instead of sitting, our find-
ings match most closely with those in (Yosef et al.,
2009).
The observed relationship can be used for the ex-
traction of the airflow from lung sounds. Further-
more, the findings are helpful for future work, re-
garding the standardized recording of lung sounds and
subsequent classification by means of machine learn-
ing techniques.
BIOSIGNALS 2017 - 10th International Conference on Bio-inspired Systems and Signal Processing
52

ACKNOWLEDGEMENTS
This project was supported by the govern-
ment of Styria, Austria, under the project call
HTI:Tech
for Med. The authors acknowledge 3M
TM
for providing Littmann
R
stethoscope chest pieces
and Schiller AG for the support with a spirometry
solution.
REFERENCES
Charleston-Villalobos, S., Cort´es-Rubiano, S., Gonz´alez-
Camerena, R., Chi-Lem, G., and Aljama-Corrales,
T. (2004). Respiratory acoustic thoracic imaging
(RATHI): assessing deterministic interpolation tech-
niques. Medical and Biological Engineering and
Computing, 42(5):618–626.
Fiz, J. A., Gnitecki, J., Kraman, S. S., Wodicka, G. R., and
Pasterkamp, H. (2008). Effect of body position on
lung sounds in healthy young men. CHEST Journal,
133(3):729–736.
Gavriely, N. and Cugell, D. W. (1996). Airflow effects
on amplitude and spectral content of normal breath
sounds. Journal of applied physiology, 80(1):5–13.
Hossain, I. and Moussavi, Z. (2002). Relationship be-
tween airflow and normal lung sounds. In Proceed-
ings of the 15th IEEE Canadian Conference on Elec-
trical and Computer Engineering (CCECE’02), pages
1120–1122.
Kraman, S. (1984). The relationship between airflow and
lung sound amplitude in normal subjects. CHEST
Journal, 86(2):225–229.
Messner, E., Hagm¨uller, M., Swatek, P., and Pernkopf, F.
(2016). A robust multichannel lung sound recording
device. In Proceedings of the 9th Annual Interna-
tional Conference on Biomedical Electronics and De-
vices (BIODEVICES’16), pages 34–39.
Murphy, R. (2007). Development of acoustic instruments
for diagnosis and management of medical condi-
tions. Engineering in Medicine and Biology Maga-
zine, 26(1):16–19.
Pasterkamp, H., Kraman, S., DeFrain, P., and Wodicka,
G. (1993). Measurement of respiratory acoustical
signals. Comparison of sensors. CHEST Journal,
104(5):1518–1525.
Sen, I. and Kahya, Y. (2006). A multi-channel device for
respiratory sound data acquisition and transient detec-
tion. In Proceedings of the 27th Annual International
Conference of the IEEE Engineering in Medicine and
Biology Society (EMBS’06), pages 6658–6661.
Shykoff, B. E., Ploysongsang, Y., and Chang, H. (1988).
Airflow and normal lung sounds1. 2. Am Rev Respir
Dis, 137:872–876.
Torres-Jimenez, A., Charleston-Villalobos, S., Gonzalez-
Camarena, R., Chi-Lem, G., and Aljama-Corrales,
T. (2008a). Asymmetry in lung sound intensities
detected by respiratory acoustic thoracic imaging
(RATHI) and clinical pulmonary auscultation. In Pro-
ceedings of the 30th Annual International Conference
of the IEEE Engineering in Medicine and Biology So-
ciety (EMBS’08), pages 4797–4800.
Torres-Jimenez, A., Charleston-Villalobos, S., Gonzalez-
Camarena, R., Chi-Lem, G., and Aljama-Corrales,
T. (2008b). Respiratory acoustic thoracic imaging
(RATHI): Assessing intrasubject variability. In Pro-
ceedings of the 30th Annual International Conference
of the IEEE Engineering in Medicine and Biology So-
ciety (EMBS’08), pages 4793–4796.
Yosef, M., Langer, R., Lev, S., and Glickman, Y. A. (2009).
Effect of airflow rate on vibration response imaging in
normal lungs. The open respiratory medicine journal,
3(1).
Impact of Airflow Rate on Amplitude and Regional Distribution of Normal Lung Sounds
53
