
Combining Different Reconstruction Kernel Responses as Preprocessing
Step for Airway Tree Extraction in CT Scan
Samah Bouzidi
1,2
, Fabien Baldacci
1
, Chokri ben Amar
2
and Pascal Desbarats
1
1
Univ. Bordeaux, LaBRI, UMR 5800, F-33400 Talence, France
2
Research Group in Intelligent Machines (ReGIM), University of Sfax, Sfax, Tunisia
{sbouzidi, fabien.baldacci, pascal.desbarats}@u-bordeaux.fr, chokribenamar@ieee.org
Keywords:
Airway Tree Segmentation Pipeline, CT Reconstruction Kernels, Data Fusion, CT Chest Scan.
Abstract:
In this paper, we propose a new preprocessing procedure that combines the responses of different Computed
Tomography (CT) reconstruction kernels in order to improve the segmentation of the airway tree. These
filters are available in all commercial CT scanner. A broad range of preprocessing techniques have been
proposed but all of them operate on images reconstructed using a single reconstruction filter. In this work,
the new preprocessing approach is based on a fusion of images reconstructed using different reconstruction
kernels and can be included as a preprocessing stage in every segmentation pipeline. Our approach has been
applied on various CT scans and an experimental comparison study between state of the art of segmentation
approaches results performed on processed and unprocessed data has been made. Results show that the fusion
process improves segmentation results and removes false positives.
1 INTRODUCTION
Lung disorders like asthma, chronic obstructive pul-
monary disease, bronchiectasis and many more are
associated with structural changes in airways. These
deformations are characterized by a thickening of the
airway walls and a narrowing of the airways lumen
area. Therefore, the assessment and the treatment of
such disorders require a good knowledge of airways
morphology (Montaudon et al., 2007; Fetita et al.,
1999). The diagnosis of the airways can be done by
a direct observation of CT images. However, visual
diagnosis is limited in practice because of the large
number of slices under investigation. An accurate
quantitative measurement of airway lumen dimension
and wall thickness requires a (semi-) automatic seg-
mentation of the airways tree.
Airway tree segmentation in CT images is a chal-
lenging task mainly due to the specific characteris-
tics of the region of interest. Anatomically, an airway
consists of a low-density lumenal area surrounded by
high-density vascular airway wall (see Figure 2). The
size of the wall and lumen decreases at each bifur-
cation (generation) as the tree is going deeper in the
lung. Therefore, only airways located within genera-
tion 0 −10, having an average diameter that decrease
from 15mm at the trachea to 1mm at the 10
th
gener-
ation (Weibel and Gomez, 1962), can be imaged by
current clinical CT scanners. Moreover, the tiny size
of airways beyond the 6
th
generation makes them less
recognizable from the lung parenchyma.
Improvements in image resolution are usually accom-
plished by using thin slices which, however, expose
the patient to high radiation dose or by interpolating
additional slices (Aykac et al., 2003).
Besides of slice thickness parameter, radiologist can
also adjust, during the reconstruction process, the re-
construction kernel which is usually chosen according
to the studied organ.
Nevertheless, there has been no interest to investi-
gate the effect of this parameter on the image quality.
In this work, we propose to improve the quality of
data by combining images obtained from more than a
single reconstruction kernel. Merged volume is then
employed as the input of any airways segmentation
method.
In the literature, several airway tree segmenta-
tion methods have been proposed. For an overview
of existing approaches we refer to the survey of (Pu
et al., 2012) and (Lo et al., 2012). Mostly, proposed
approaches are based on Region Growing (RG) al-
gorithms. However, this technique deals with two
main difficulties: it often leads to leakage into the
lung parenchyma or stops earlier and gives an incom-
plete segmentation. Leakage occurs when the air-
way wall is obscured by noise and partial volume
Bouzidi S., Baldacci F., ben Amar C. and Desbarats P.
Combining Different Reconstruction Kernel Responses as Preprocessing Step for Airway Tree Extraction in CT Scan.
DOI: 10.5220/0006134200890097
In Proceedings of the 12th International Joint Conference on Computer Vision, Imaging and Computer Graphics Theory and Applications (VISIGRAPP 2017), pages 89-97
ISBN: 978-989-758-225-7
Copyright
c
2017 by SCITEPRESS – Science and Technology Publications, Lda. All rights reserved
89
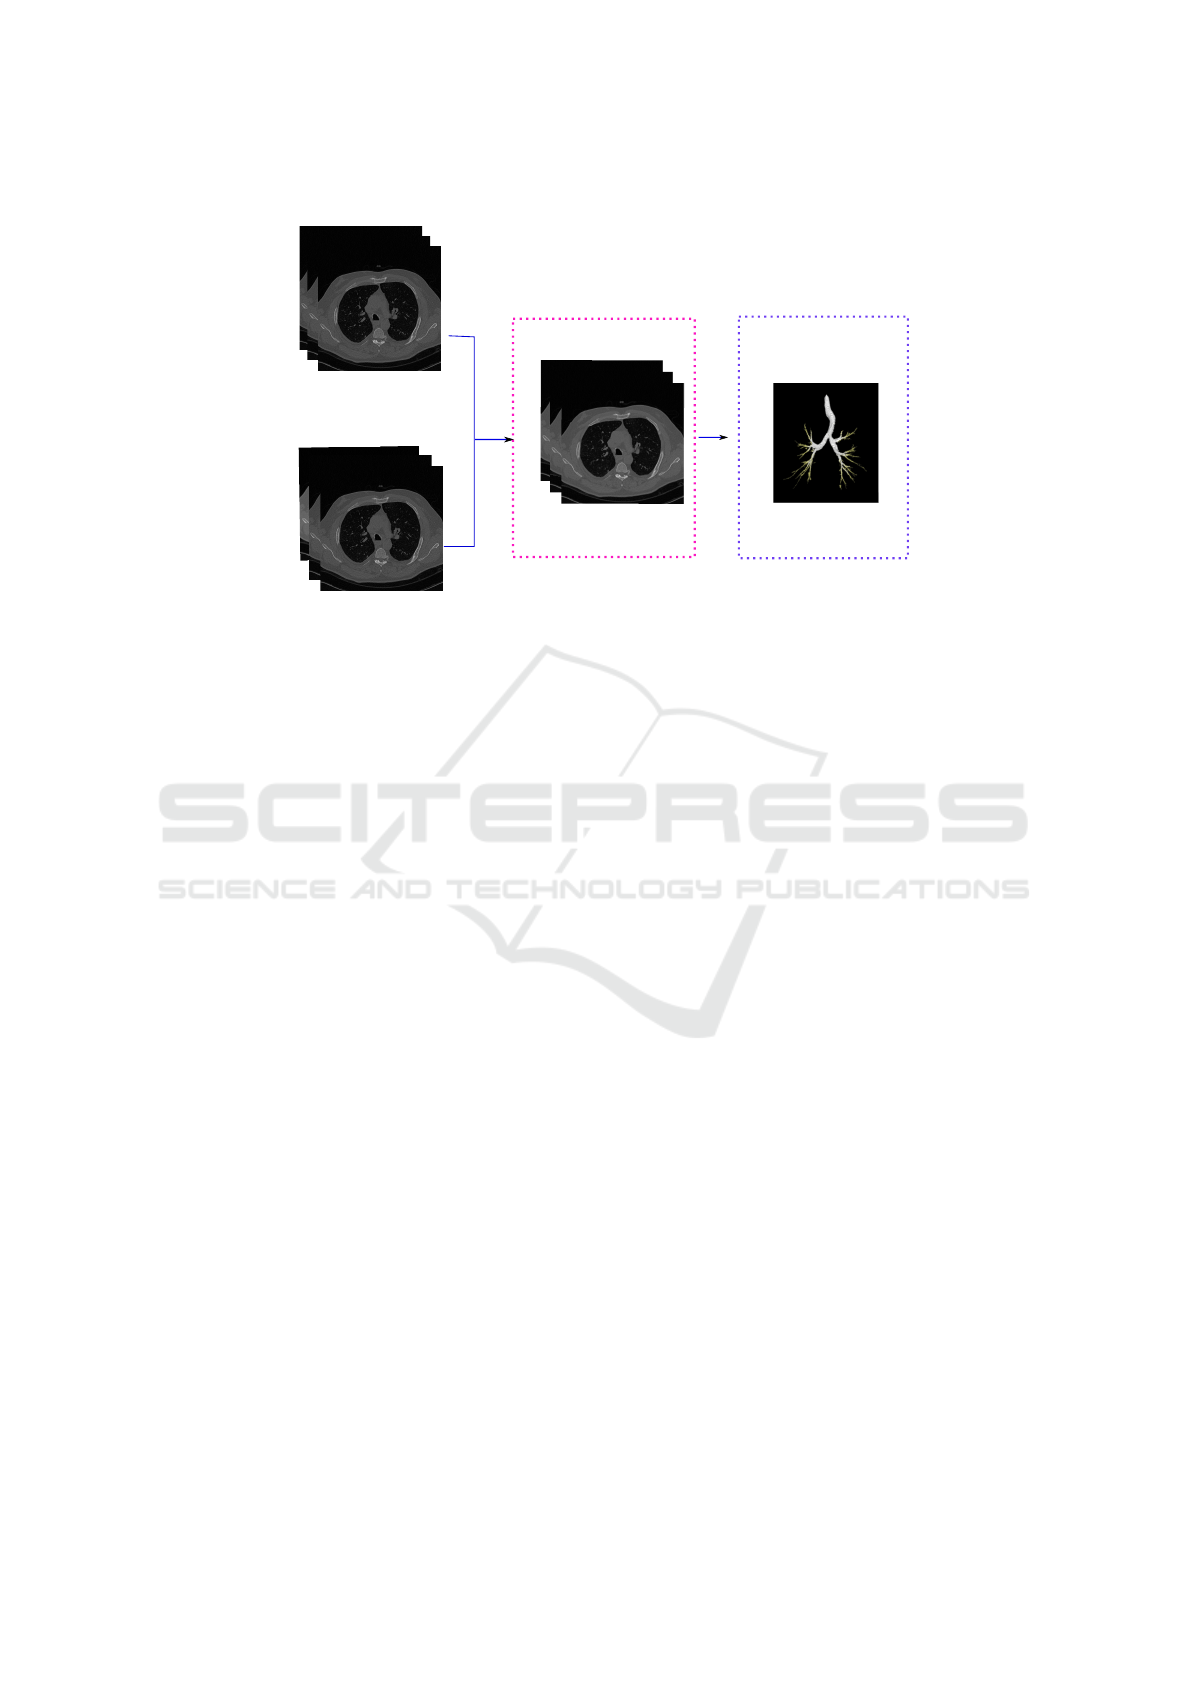
Hard filter
reconstructed data
Soft filter
reconstructed data
Data Fusion
Airways
segmentation
Figure 1: Overview of the segmentation pipeline.
effects. To overcome this problem, several strate-
gies have been proposed. Adjusting the RG thresh-
old iteratively and stopping the segmentation when
leakage occurs are solutions proposed in (Mori et al.,
1996; Kitasaka et al., 2003; Weinheimer et al., 2008).
Other works address the RG leakage problem by fil-
tering the image before performing the tree segmen-
tation. In that approach, tubular enhancement fil-
ters based on hessian matrix analysis (Frangi et al.,
1998; Sato et al., 1997; Krissian et al., 2000; Lo
et al., 2009) and mathematical morphology operations
(Aykac et al., 2003; Pisupati et al., 1996; Irving et al.,
2009; Fabija
´
nska, 2009) are used to isolate candidate
airway locations. So far, and despite these efforts,
none of these methods guarantee that the RG doesn’t
leak into lung parenchyma and that the full airway
tree is constructed. In this paper, we combine CT vol-
ume reconstructed using different reconstruction ker-
nels to create a new 3D image used as the input of
airway segmentation pipelines. Data is reconstructed
from the same CT acquisition therefore without ex-
posing the patient to an additional radiation dose.
A quantitative and qualitative evaluation was con-
ducted to assess the impact of the new data on the
airways segmentation schemes in terms of the num-
ber of recognized bronchi and the rate of leakage. The
content of this paper may be summarized as follows.
In section 2, the proposed method is explained. Sec-
tion 3 presents the experimental results and discusses
the accuracy of the method. Finally, conclusions and
perspectives are drawn in section 4.
2 METHOD
Our approach consists of introducing a new prepro-
cessing step (Data fusion step) in the airway segmen-
tation pipeline. An overview of the new segmentation
pipeline is given by Figure 1. The inputs of the work-
flow, are two 3D X-ray CT volume reconstructed us-
ing soft and hard filters. We then apply, on the com-
bined data, state of the art methods based on RG to
extract the airways and reconstruct the tree.
2.1 Fusion of Reconstructed CT
Volumes
In Computed Tomography scanning, cross-sectional
images are reconstructed from the measurements of
attenuation coefficients of the X-ray beams at differ-
ent angles and positions. Besides the data acquisition
efficiency, CT image quality greatly depends on the
accuracy of the reconstruction process. During this
operation, user intervention is limited to adjusting ac-
quisition parameters such as the choice of the recon-
struction kernel, also known as reconstruction filter.
There are several types of filters available in commer-
cial CT scanners and the choice of the appropriate one
depends on the explored organ.
In the case of CT lung exams, when data is recon-
structed using a hard kernel, high-frequency compo-
nents such as vessel and airway wall, pleura and sharp
transitions are highlighted (see Figure 2.(a)). On the
contrary, the soft kernel has the effect of filtering
out high frequencies and letting low frequencies pass.
Thus, this filter produces blurred images where noise
VISAPP 2017 - International Conference on Computer Vision Theory and Applications
90
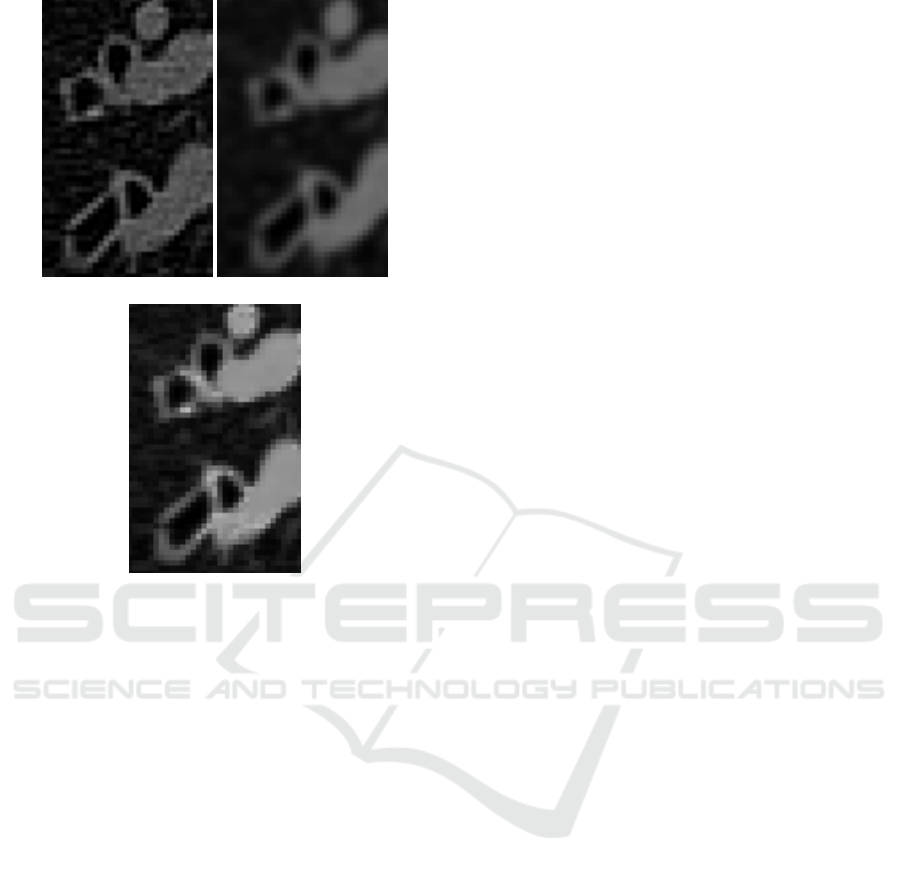
(a) (b)
(c)
Figure 2: Three CT images reconstructed using (a) hard fil-
ter and (b) soft filter (c) the fusion of the data using soft and
hard kernel. Airways appear in CT image as a dark structure
surrounded by a bright and thin contour. Airways showed
here belong to the 6
th
generation.
is smoothed. However contours are attenuated (see
Figure 2.(b)).
Most of airway tree segmentation algorithms based
on RG try to retrieve and extract airway lumen pix-
els and then reconstruct the whole tree. Even if the
airway wall pixels are not considered in the segmen-
tation, they play a very important part in the growing
process. In fact, The wall surrounds the lumen area,
separates this region from the lung parenchyma and
prevents the RG from leaking outside the airway lu-
men.
According to this constraint, it seems better to use
the hard reconstruction kernel because it allows en-
hancing the airway wall contours. However, using
this kernel thin contours are often obscured by noisy
pixels. This leads to decrease the contrast between
the air and the surrounding tissue. Then, the whole
lung can be added to the growing region. Further-
more, if noisy pixels are located in airway lumen re-
gions, growth can be interrupted earlier. Noise can be
smoothed using the soft reconstruction kernel. How-
ever, using this filter, contours are smoothed too and
airway lumen is narrowed, so the airway lumen can-
not be well distinguished from the lung parenchyma
and leakage can occurs or segmentation is stopped
earlier.
In order to take advantages of each type of recon-
struction, we propose to combine its resulting data in
a single volume (see Figure 2.(c)) in which noise is
smoothed and contours are enhanced. The fusion pro-
cess can be added to any airways segmentation algo-
rithm as a preprocessing step. Images are combined
as follow:
I(x, y, z) =
(
I
HF
(x, y, z) |I
HF
(x, y, z) |>=| I
SF
(x, y, z) |
I
SF
(x, y, z) otherwise
.
(1)
Where I
HF
is the image reconstructed using the
hard kernel and I
SF
is the image reconstructed using
the soft kernel. Considering that airway lumen are
filled with air and have a very low and negative in-
tensity in CT images. The combined volume takes
from HF data high-intensity pixels (airway wall and
vessel) and very low and negative intensity (airway
lumen and parenchyma). Noise pixels, having high
intensity, are replaced by smoothed one, having very
low and negative intensity, given by the SF data.
2.2 Airways Tree Segmentation
In order to study the effect of the proposed fusion pro-
cess, the airways segmentation stage has been per-
formed using six state of the art algorithms. Fur-
thermore, we have implemented a fast and simple
RG algorithm to segment airways tree that we have
also used for the assessment of the fusion procedure.
These methods are:
• Intensity based RG Approach. (Mori et al.,
1996) proposed a 3D ”explosion-controlled” RG
algorithm that starts from a seed placed inside
the trachea. Adjacent voxels are added to the
tree if their intensities are smaller than a thresh-
old. The algorithm updates iteratively the inten-
sity threshold until parenchymal leakage (explo-
sion) is detected. The leakage is detected by com-
paring two successive segmentations. if the ra-
tio between these segmentations is higher than an
explosion control parameter, voxels added by the
current threshold are removed and the algorithm
is stopped. We have used this algorithm to au-
tomate all RG process proposed in the following
approaches.
• Multiscale Black Top-Hat based RG Ap-
proach. In our previous work (Bouzidi et al.,
Combining Different Reconstruction Kernel Responses as Preprocessing Step for Airway Tree Extraction in CT Scan
91
2016), we used a multiscale Black Top-Hat fil-
ter to enhance airways. The proposed airways
enhancement filter aims to separate airways from
adjacent lung parenchyma and vessels (see Fig-
ure 3). Based on the filter output, the RG is per-
formed twice. First, an intensity based RG is ap-
plied to segment trachea and main bronchi (air-
ways). Then, the input volume is enhanced using
the multiscale Black Top-Hat filter. Thereafter,
the second RG is performed on the processed vol-
ume to extract the airway tree and prevent leak-
age.
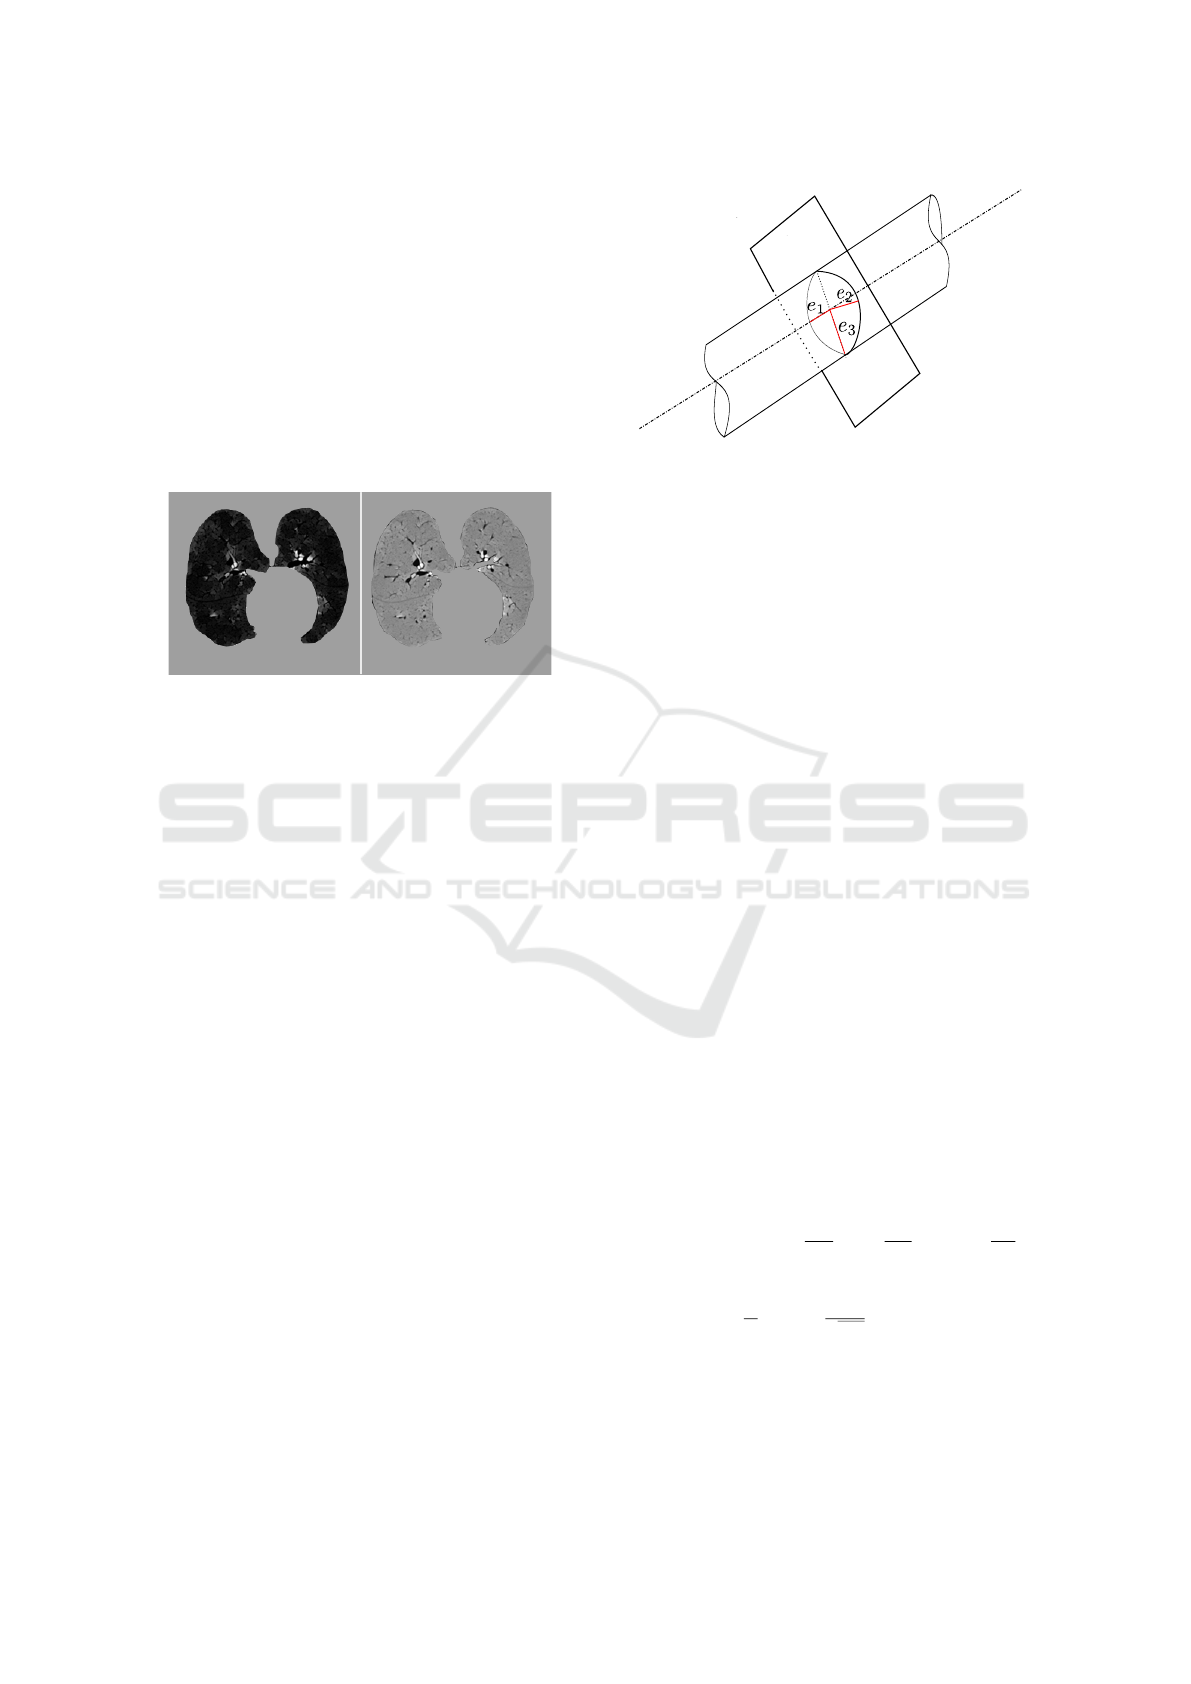
Figure 3: Airways highlighted using the Black Top-Hat
transform. Left: the multiscale response of the filter applied
in an axial slice. Right: its corresponding image difference.
• Gradient based 3D RG Algorithm. We propose
here a very simple and fast algorithm to delin-
eate the airways and then to reconstruct the air-
ways tree. In this algorithm, we have applied
the gradient operator in order to detect contours.
The resulting volume contains vessel, airways and
pleura contours. The volume contains also noisy
pixels contours depending on the type of the input
data (HF or SF data). Using the Otsu algorithm
(Otsu, 1975), the gradient volume is thresholded.
As the RG extract lumen regions, the interior of
each contour is filled using a hole fill operator.
Here, the interior of the pleura, the parenchyma,
is excluded from the fill hole process. We then
subtract from the obtained volume the thresholded
gradient volume. This allows keeping only ves-
sels and airways lumen but also some parenchyma
pixels due to noise contours. All the pixels with
density values in the initial volume lower than
900 HU (Hounsfield Units) are labeled as airway
lumen since air has very low HU values around
1000 in CT slices, other pixels are removed from
the volume. After that, The RG is performed to
link airways lumen region of the processed vol-
ume in one final tree.
• Mathematical Morphology based RG. Mathe-
matical morphology methods use a range of mor-
phological structuring elements (SE) for the seg-
mentation process. (Aykac et al., 2003) used
Figure 4: The eigenvalues e
2
and e
3
of the Hessian matrix
define the principal curvature of the tube.
grayscale mathematical morphology reconstruc-
tion to identify airways candidates on 2D CT
slices. The grayscale reconstruction is performed
using different sized SE in order to detect airways
over a wide range of sizes. Airway tree is then
reconstructed using a slice by slice RG algorithm.
• Hessian based RG Approaches. The segmenta-
tion of tubular structures, which represent areas
of lower intensity in the case of airways, can be
achieved by studying the differential properties of
the image and especially the analysis of the Hes-
sian matrix of the image. In this field of research,
a lot of tubular detection filters (Sato et al., 1997;
Krissian et al., 2000; Frangi et al., 1998) have
been proposed in the literature. Filters perform a
shape analysis for each pixel in the image domain
resulting in a kind of medialness or tube-likeliness
measure. The extraction scheme, RG in our case,
is then applied on the enhanced data to extract the
whole tree. We will present here the theory be-
hind vesselness filters.
Frangi Line Filter. (Frangi et al., 1998) perform
a Hessian eigenvalue analysis to enhance voxel
within tubular structures ( vessels, airways...).
Based on the information that dark tubular struc-
tures have two positive larger eigenvalues (e
3
>
0 and e
2
> 0) and the third eigenvalue being close
to zero (e
1
≈0). The proposed line filter is defined
as:
T (x) =
(1 −exp(
R
2
A
2α
2
))exp(
R
2
B
2β
2
)(1 −exp(
S
2
2γ
2
))
0 e
3
< 0 and e
2
< 0
(2)
with R
A
=|
e
2
e
3
|, R
B
=
|e
1
|
√
e
2
e
3
and S is the Frobenius
norm of the Hessian matrix. α, β and γ are control
parameters.
Sato Line Filter. Similar to the work of (Frangi
et al., 1998). (Sato et al., 1997) proposed the
VISAPP 2017 - International Conference on Computer Vision Theory and Applications
92
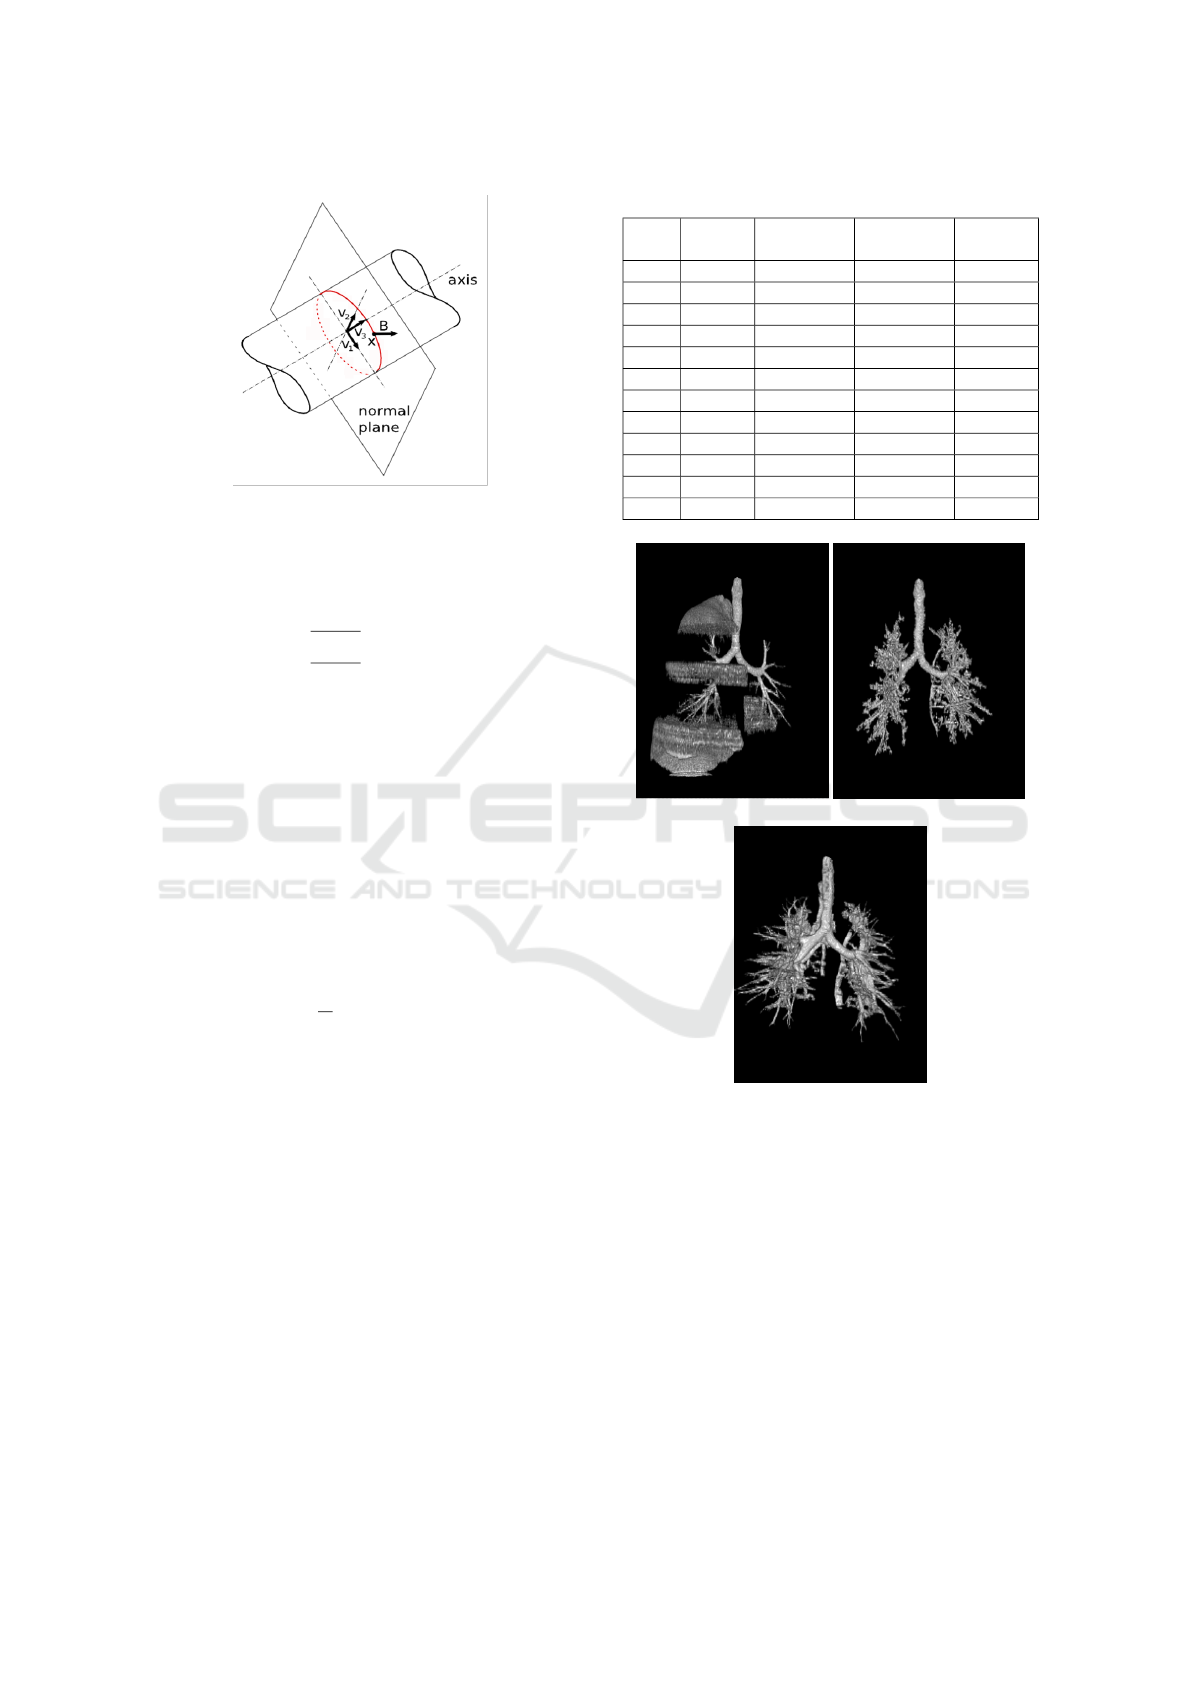
Figure 5: The medialness response obtained from the
boundary information (red circle). The Cross-section plane
of the tube is spanned by the eigenvectors v
1
and v
2
of the
Hessian matrix.
following line filters to enhance tubular structures:
T (x) =
exp(−
e
2
1
2(α
1
e
c
)
2
) ∗e
c
e
1
≤ 0 and e
c
6= 0
exp(−
e
2
1
2(α
2
e
c
)
2
) ∗e
c
e
1
> 0 and e
c
6= 0
0 e
c
= 0
.
(3)
with e
c
= min(e
2
, e
3
), and α
1
and α
2
are control
parameters.
Krissian Medialness Filter. Krissian et al.
(Krissian et al., 2000) proposed a medialness
function which measures the degree to belong to
the medial axis. The response function is esti-
mated by measuring the boundary information at
a circular neighborhood which radius is the used
scale. The proposed medialness function is repre-
sented as follows:
R(X, σ, θ) =
1
N
N−1
∑
i=0
| 5I
σ
(X + θσv
α
i
| (4)
Here, X = (x, y, z)
T
is a pixel point, I
σ
(X) is the
image at the scale σ, N is the number of samples.
The circle is defined by eigen vectors v
1
and v
2
and the radius r = σθ.
3 EXPERIMENTS AND RESULTS
The performance of the proposed approach in terms
of filter responses (Frangi et al., 1998; Sato et al.,
1997; Krissian et al., 2000; Aykac et al., 2003;
Bouzidi et al., 2016) and segmentation results has
been qualitatively and quantitatively compared to
those obtained when the input of the segmentation
pipeline is only one type of reconstructed data. We
have compared the results of combined data to the re-
sults of SF data because lung CT data are usually re-
Table 1: Description of the dataset.
Scan Spacing
(mm)
Z-spacing
(mm)
number
of slices
kV/mAs
01 0.67 1 306 120/155
02 0.71 1 272 120/128
03 0.65 1 286 120/152
04 0.74 1 344 120/152
05 0.74 1 304 120/155
06 0.63 1 323 120/155
07 0.57 1 300 120/152
08 0.68 1 319 120/152
09 0.7 1 300 120/158
10 0.72 1 286 120/152
11 0.7 1 300 120/152
12 0.71 1 300 120/155
(a) (b)
(c)
Figure 6: Airway tree segmentations using the HF data.
(a) (Aykac et al., 2003). (b) Gradient based method (c)
(Bouzidi et al., 2016).
constructed using SF kernel and airways tree obtained
from the HF data leaks to the lung parenchyma (see
Figure 6).
We applied our method to twelve CT chest scan
available in two examples: images reconstructed us-
ing the hard kernel and images reconstructed using
the soft kernel. Table 1 presents the characteris-
tics of each scan. All computations were performed
on an intel-Xeon E3-1200 @3.60GHz, 16GB RAM,
Ubuntu Linux 64 bit.
Combining Different Reconstruction Kernel Responses as Preprocessing Step for Airway Tree Extraction in CT Scan
93
We first investigate the impact of the combined data
on Hessian based (Frangi et al., 1998; Sato et al.,
1997; Krissian et al., 2000) and morphological based
(Aykac et al., 2003; Bouzidi et al., 2016) airways filter
responses. Figure 7 reports filters responses of (Aykac
et al., 2003) (Figure 7.(a)) and (Frangi et al., 1998)
(Figure 7.(b)) on the SF data (left side) and combined
data (right side). In (Aykac et al., 2003) and (Bouzidi
et al., 2016) segmentation approaches, the fusion of
HF and SF data has an effect of noise reduction, as can
be seen in Figure 7.(a), especially before the first bi-
furcation of the tree. This can be explained by the im-
provement of the contrast between airway lumen and
parenchyma given by the hard reconstruction. Such
improvement allows the employed morphological op-
erator (Black Top-Hat operator, grayscale closing re-
construction respectively) to enhance only grayscale
minima corresponding to candidate airway locations
and remove false positives (parenchyma pixels). Sim-
ilarly, (Frangi et al., 1998)’s filter succeeds to enhance
more airways when it is employed on combined data
(see Figure 7.(b)). As a consequence, the improve-
ment in filters responses of the combined data will
guide and constraint the segmentation process to re-
trieve more enhanced bronchi without leaking into
parenchyma. An example of segmentations using
(Aykac et al., 2003) approach is shown in Figure 8.
Leakages that occur in the segmentation based on the
SF data are excluded when we use the combined data.
Further, more deeper airways has been added to the
tree. The branch detection number for each method
and data will be detailed in Table 2.
We then compare all segmentation results in terms
of tree depth (number of retrieved generation) and the
number of retrieved bronchi per generation. Using
these two metrics, we compare for each method air-
way trees obtained from combined data and SF data.
An example of the combined data effect on the gra-
dient based 3D RG is shown in Figure 9. The airway
tree extracted from the HF data (Figure 9.(a)) presents
a very high rate of false positives (parenchyma vox-
els misclassified as lumen area voxels). The airway
tree extracted from the SF data reached only the 4
th
generation while the merged data allows to extend the
segmentation to the 10
th
generation.
Quantitative improvement of the data fusion on
the segmentation results is given in Table 2 and Table
3. In Table 2, we give for each scan the total number
of extracted bronchi from the processed and unpro-
cessed data (SF reconstructed data) and we detail in
Table 3 the maximum, minimum and the average of
retrieved airways per generation in all the dataset. We
limit our investigation to recognized bronchi from the
4
th
to 7
th
generation because, first, all methods suc-
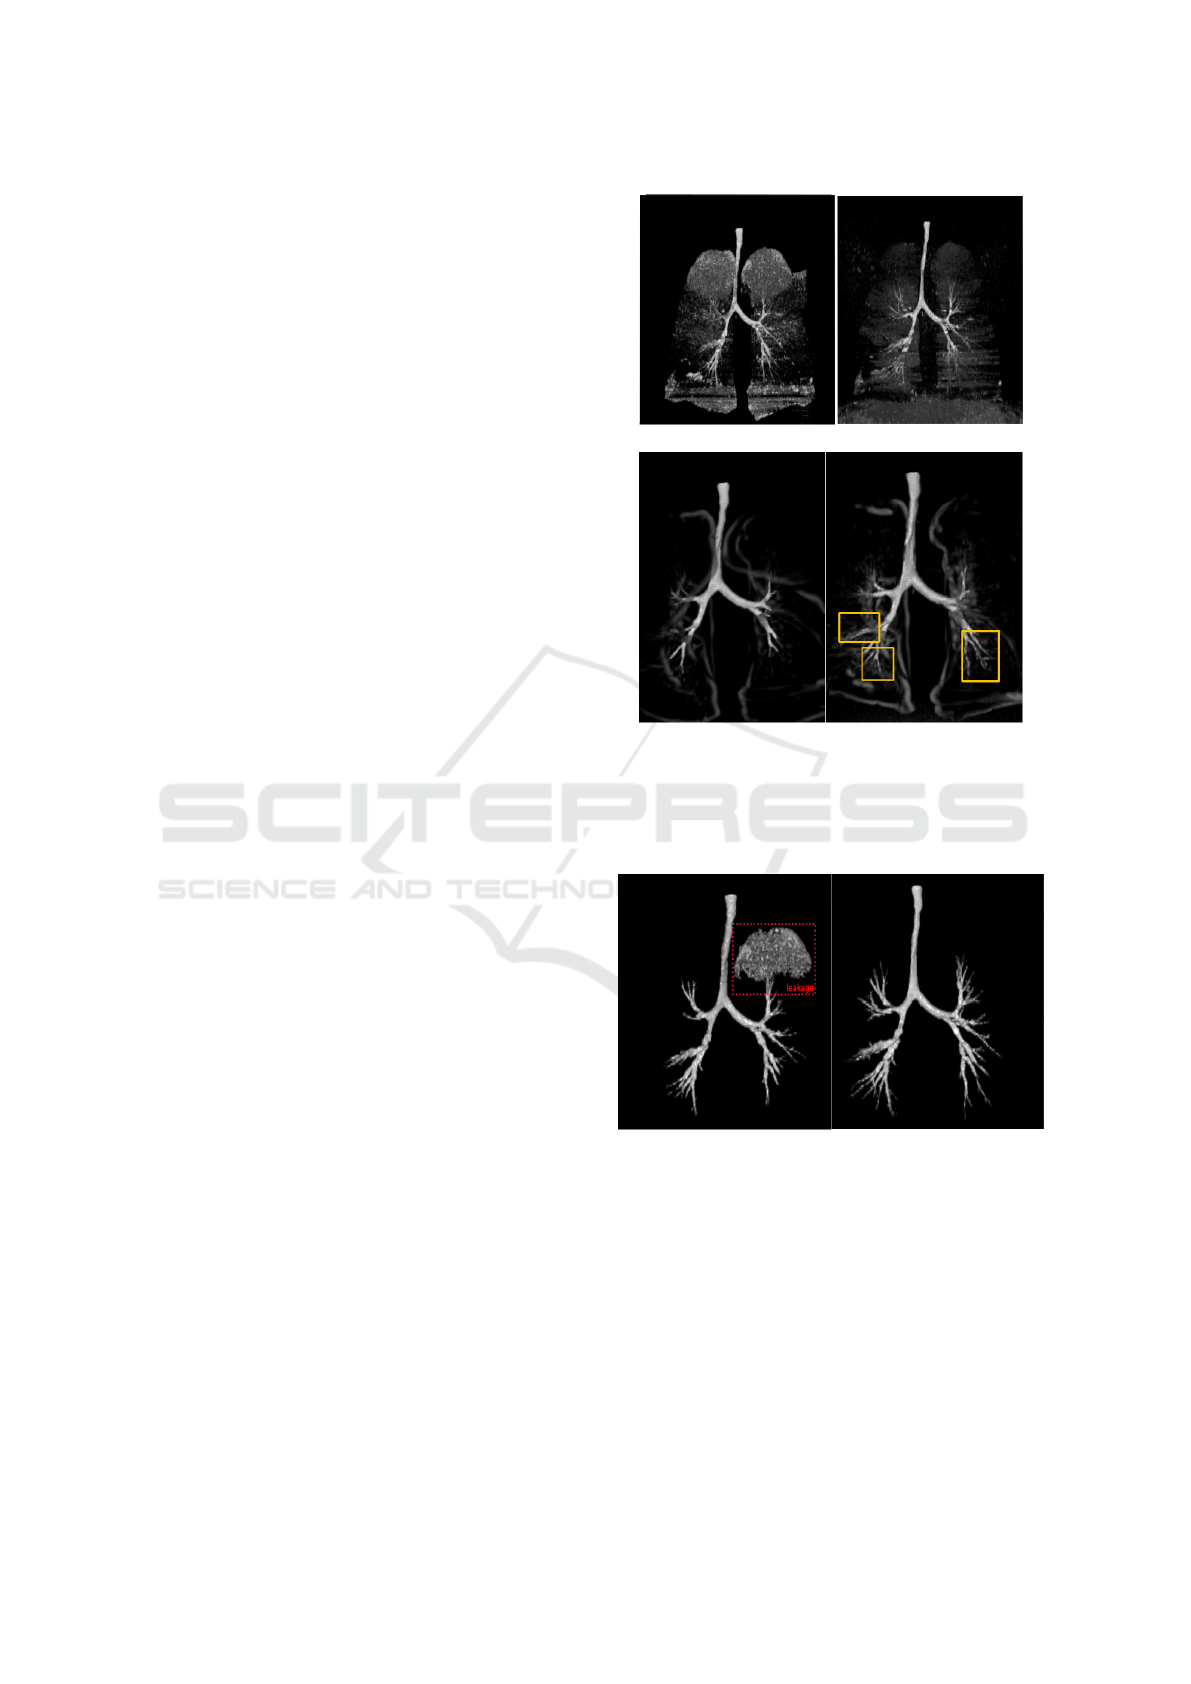
(a)
(b)
Figure 7: Aykac and Frangi filter responses when the data is
combined (right) or not (left). (a) Aykac’s filter responses.
(b) Frangi’s filter responses. In Aykac’s filter, the combined
data has an effect of noise remover. In Frangi’s filter, new
enhanced airways are marked in yellow rectangle.
Figure 8: Airways tree segmentations using the method of
(Aykac et al., 2003) applied on the SF reconstructed data
(in the left) and on the merged data (in the right). The com-
bined data allows to remove the leakage that occurs in the
segmentation of the SF data.
cessfully extract all airways until the four first gener-
ation. Second, beyond the 7
th
generation, methods,
whatever the input data, fail to identify more than an
average of five airways, which cannot be used in prac-
tice. For that reason alsov, we didn’t give in table 3
the statistics of detected bronchi at these generations.
Table 2 shows that (Aykac et al., 2003), (Bouzidi
et al., 2016) and the gradient based method has more
VISAPP 2017 - International Conference on Computer Vision Theory and Applications
94
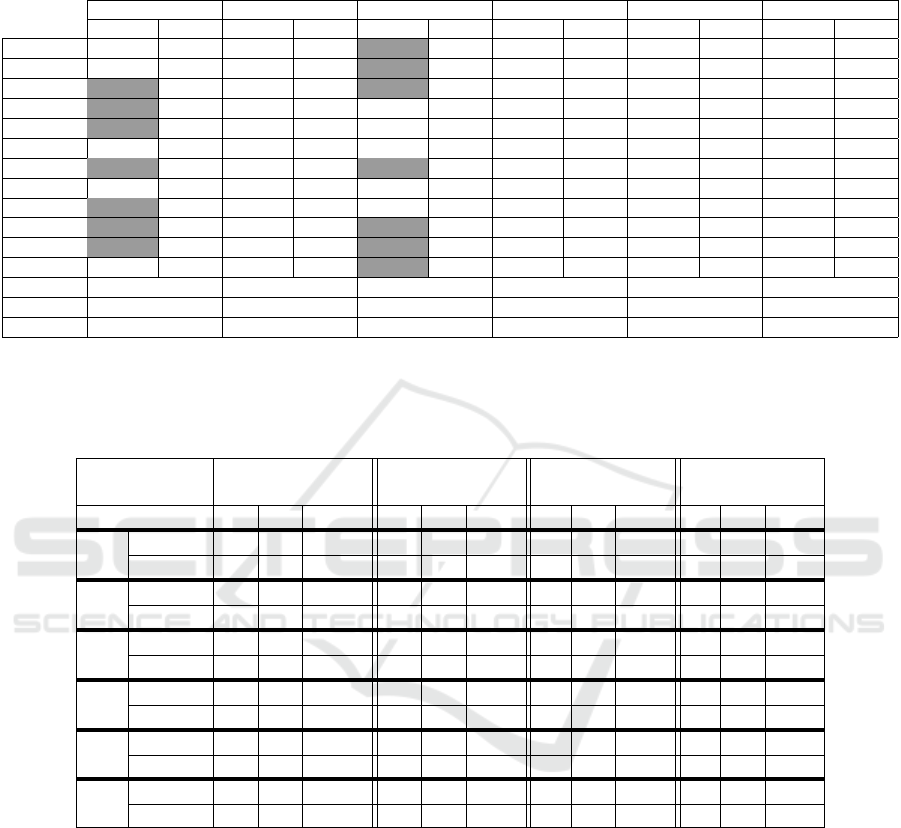
Table 2: Comparison of the number of recognized bronchi using SF reconstructed data (SF data) and combined data (C data)
over 12 human CT scans. gray cell : leakage occurs in the segmentation, G: gradient based algorithm, TH: Top-Hat based
algorithm, AY: Aykac algorithm, FR: Frangi based algorithm, SA: Sato based algorithm, KR: Krissian based algorithm.
G TH AY FR SA KR
SF data C data SF data C data SF data C data SF data C data SF data C data SF data C data
Scan1 33 52 43 63 76 82 37 41 31 33 33 36
Scan2 20 67 47 67 62 72 32 34 26 30 23 26
Scan3 7 76 37 62 76 84 35 35 29 31 25 25
Scan4 15 34 27 43 52 58 27 32 25 27 17 17
Scan5 16 58 44 60 66 72 28 28 26 26 17 17
Scan6 7 52 39 65 61 80 35 35 29 29 31 35
Scan7 45 60 47 90 63 75 30 33 27 29 24 25
Scan8 37 50 45 56 55 60 31 35 26 30 15 17
Scan9 28 42 35 47 41 49 24 27 24 24 22 22
Scan10 25 76 60 84 75 85 27 29 25 25 25 25
Scan11 31 82 41 82 65 68 20 22 27 30 21 21
Scan12 32 54 43 60 59 68 33 38 33 36 25 27
Min gain 13 11 3 0 0 0
Max gain 69 43 20 5 4 4
Avreage 33.92 22.58 10 2.5 1.83 1.25
Table 3: Maximum, minimum and avreage of airways detection as a function of apparent generation. Trachea is the generation
zero. m :minimum of detected airways, M :maximum of detected airways, µ: Average of detected airways, G: gradient based
algorithm, TH: Top-Hat based algorithm, AY: Aykac algorithm, FR: Frangi based algorithm, SA: Sato based algorithm, KR:
Krissian based algorithm.
Apparent
Generation
4 5 6 7
m M µ m M µ m M µ m M µ
G
SF data 0 14 6.58 0 11 3.25 0 4 0.67 0 2 0.17
C data 11 21 16.17 3 24 13.8 2 15 6.92 0 8 6
TH
SF data 10 21 14.2 2 20 8.33 0 8 2.17 0 2 0.83
C data 14 20 16.4 4 24 14.8 2 22 9.08 0 12 3.45
AY
SF data 10 19 15 6 22 16 4 16 9.8 0 10 5
C data 10 20 16 10 24 17.5 6 18 13.4 0 13 6
FR
SF data 4 14 9.3 2 8 3 0 6 2.17 0 2 0.33
C data 5 14 10.41 2 9 4 0 6 2.17 0 2 0.33
SA
SF data 6 12 8.83 2 6 2.5 0 2 0.67 0 0 0
C data 6 12 9.75 2 9 3.08 0 2 0.67 0 0 0
KR
SF data 0 10 6.3 0 2 1.2 0 6 0.7 0 0 0
C data 2 12 7.08 0 3 1.25 0 6 0.67 0 2 0.16
benefited from the use of the combined data than Hes-
sian based segmentation methods. These methods ex-
tract new branches that were missing from the SF data
reconstructed data. For example, for the second scan
and using the combined data (Aykac et al., 2003),
(Bouzidi et al., 2016) and the gradient based method
add respectively 10, 20 and 40 new airways to the
trees obtained from the SF data. This leads to add
1-3 extra generations of airway branches. We sum-
marize in Table 4 gains in term of added bronchi of
each method over the dataset. A slight improvement,
less than five added bronchi, is associated to Hessian
based segmentation results even though the prominent
improvement of their filters responses using the out-
put of the fusion step. This behaviour is due to the
lack of direction information, given by these filters
to retrieve tubular structures (airways in our case), in
the RG algorithm. Further, the proposed preprocess-
ing step has allowed preventing the RG from leakage
produced when the input is the SF data. We specify in
Table 2 (gray cell) segmentations where the leakage
occur. Note that airways which are recognized after
the leakage are not considered in the final tree.
Combining Different Reconstruction Kernel Responses as Preprocessing Step for Airway Tree Extraction in CT Scan
95
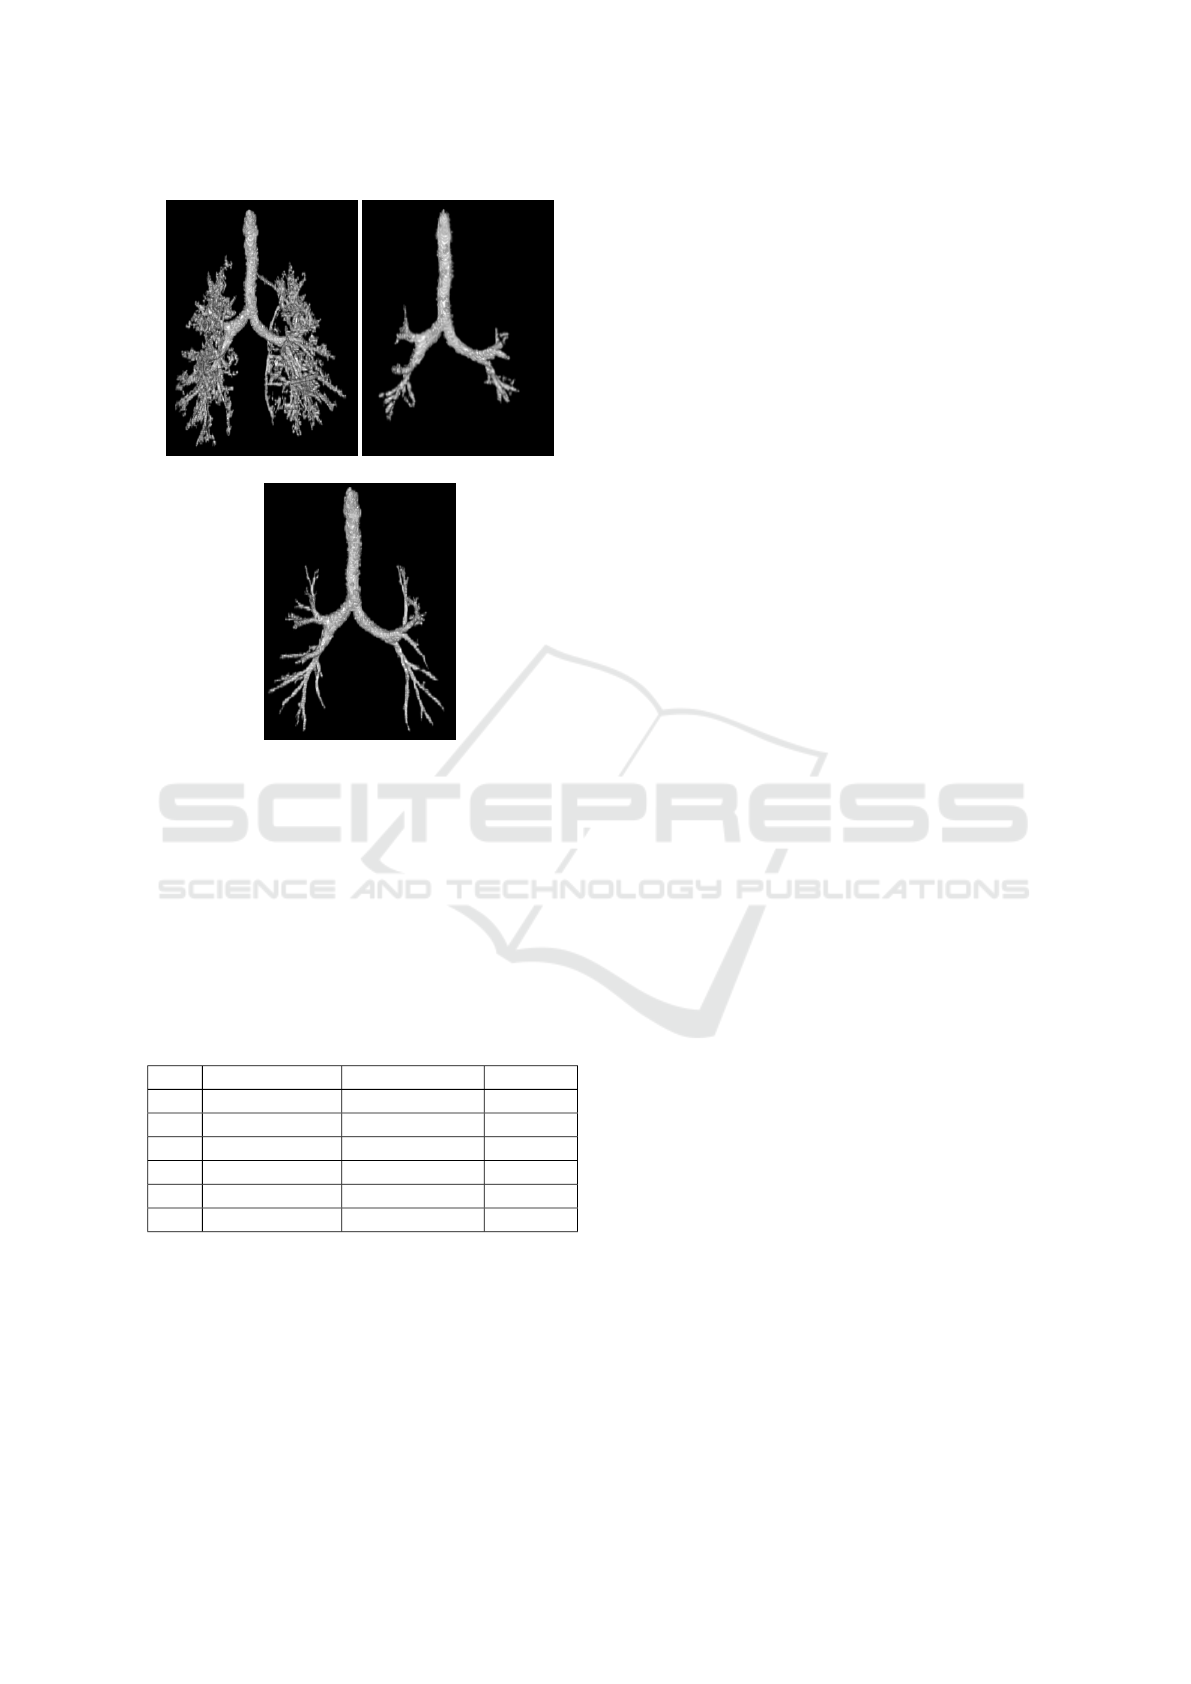
(a) (b)
(c)
Figure 9: Comparison of airway tree segmentations pro-
duced by the gradient based RG using the creterion of (Mori
et al., 1996) on the third CT exam. (a) The HF tree contains
leakage caused by parenchyma voxels misclassified as air
voxels. (b) Leakage doesn’t occur in the SF tree but the
segmentation is stopped earlier (c) Obtained tree when the
SF data is combined with the HF data. the tree penetrates
deeper into the lung without leaking into the parenchyma.
Table 4: Overall gains in term of added bronchi of the seg-
mentation methods over 12 human CT scans. G: gradient
based algorithm, TH: Top-Hat based algorithm, AY: Aykac
algorithm, FR: Frangi based algorithm, SA: Sato based al-
gorithm, KR: Krissian based algorithm.
Minimal gain Maximal gain Avreage
TH 11 43 22.58
G 13 69 33.92
A 3 20 10
FR 0 5 2.5
SA 0 4 1.83
KR 0 4 1.25
4 CONCLUSION AND
PERSPECTIVES
In this paper, we have proposed a new preprocess-
ing procedure that can be incorporated in any airways
segmentation process. The idea behind this method is
combining responses of different reconstruction ker-
nels, available in all commercial CT scan. Data is re-
constructed from the same acquisition so without ex-
posing the patient to additional radiation dose. Com-
bined data shows good results in terms of the number
of recognized bronchi and the rate of leakage. Future
works will focus on combining more than two recon-
struction kernels responses and assessing its impact in
the segmentation schemes. In our case, we have used
two reconstruction kernel response : HF data and SF
data. The first allows enhancing airway wall contours
and the second, the standard data used in the airway
segmentation task, smooths noisy pixels.
Furthermore, we plan to adapt and test the proposed
procedure to segment other lung structures (vessels,
nodules...).
ACKNOWLEDGEMENTS
The authors would like to thank radiologists from
University Hospital Centre of Bordeaux Haut-
L
´
ev
ˆ
eque for providing lung CT images.
REFERENCES
Aykac, D., Hoffman, E. A., McLennan, G., and Reinhardt,
J. M. (2003). Segmentation and analysis of the human
airway tree from three-dimensional x-ray CT images.
Medical Imaging, IEEE Transactions on, 22(8):940–
950.
Bouzidi, S., Baldacci, F., Amar, C. B., and Desbarats, P.
(2016). 3D segmentation of the tracheobronchial tree
using multiscale morphology enhancement filter. In
Proc. of 24th International Conference on Computer
Graphics, Visualization and Computer Vision, pages
207–214.
Fabija
´
nska, A. (2009). Two-pass region growing algo-
rithm for segmenting airway tree from MDCT chest
scans. Computerized Medical Imaging and Graphics,
33(7):537–546.
Fetita, C. I., Grenier, P., et al. (1999). Modeling, segmenta-
tion, and caliber estimation of bronchi in high resolu-
tion computerized tomography. Journal of Electronic
Imaging, 8(1):36–45.
Frangi, A. F., Niessen, W. J., Vincken, K. L., and Viergever,
M. A. (1998). Multiscale vessel enhancement filter-
ing. In Medical Image Computing and Computer-
Assisted Interventation MICCAI98, pages 130–137.
Springer.
Irving, B., Taylor, P., and Todd-Pokropek, A. (2009). 3D
segmentation of the airway tree using a morphology
based method. In Proceedings of 2nd international
workshop on pulmonary image analysis, pages 297–
07.
VISAPP 2017 - International Conference on Computer Vision Theory and Applications
96

Kitasaka, T., Mori, K., Suenaga, Y., Hasegawa, J.-i., and
Toriwaki, J.-i. (2003). A method for segmenting
bronchial trees from 3Dchest x-ray ct images. In In-
ternational Conference on Medical Image Computing
and Computer-Assisted Intervention, pages 603–610.
Springer.
Krissian, K., Malandain, G., Ayache, N., Vaillant, R., and
Trousset, Y. (2000). Model-based detection of tubular
structures in 3D images. Computer vision and image
understanding, 80(2):130–171.
Lo, P., Sporring, J., Pedersen, J. J. H., and de Bruijne, M.
(2009). Airway tree extraction with locally optimal
paths. In Medical Image Computing and Computer-
Assisted Intervention, MICCAI 2009, pages 51–58.
Springer.
Lo, P., Van Ginneken, B., Reinhardt, J. M., Yavarna, T.,
De Jong, P. A., Irving, B., Fetita, C., Ortner, M.,
Pinho, R., Sijbers, J., et al. (2012). Extraction of air-
ways from CT (exact’09). Medical Imaging, IEEE
Transactions on, 31(11):2093–2107.
Montaudon, M., Desbarats, P., Berger, P., De Dietrich, G.,
Marthan, R., and Laurent, F. (2007). Assessment of
bronchial wall thickness and lumen diameter in hu-
man adults using multi-detector computed tomogra-
phy: comparison with theoretical models. Journal of
anatomy, 211(5):579–588.
Mori, K., Hasegawa, J.-i., Toriwaki, J.-i., Anno, H., and
Katada, K. (1996). Recognition of bronchus in three-
dimensional x-ray CT images with applications to
virtualized bronchoscopy system. In Pattern Recog-
nition, 1996., Proceedings of the 13th International
Conference on, volume 3, pages 528–532. IEEE.
Otsu, N. (1975). A threshold selection method from gray-
level histograms. Automatica, 11(285-296):23–27.
Pisupati, C., Wolff, L., Zerhouni, E., and Mitzner, W.
(1996). Segmentation of 3D pulmonary trees using
mathematical morphology. In Mathematical morphol-
ogy and its applications to image and signal process-
ing, pages 409–416. Springer.
Pu, J., Gu, S., Liu, S., Zhu, S., Wilson, D., Siegfried, J. M.,
and Gur, D. (2012). CT based computerized identifi-
cation and analysis of human airways: a review. Med-
ical physics, 39(5):2603–2616.
Sato, Y., Nakajima, S., Atsumi, H., Koller, T., Gerig, G.,
Yoshida, S., and Kikinis, R. (1997). 3D multi-scale
line filter for segmentation and visualization of curvi-
linear structures in medical images. In CVRMed-
MRCAS’97, pages 213–222. Springer.
Weibel, E. R. and Gomez, D. M. (1962). Architecture of the
human lung. Science, 137(3530):577–585.
Weinheimer, O., Achenbach, T., and D
¨
uber, C. (2008).
Fully automated extraction of airways from CT scans
based on self-adapting region growing. Computerized
Tomography, 27(1):64–74.
Combining Different Reconstruction Kernel Responses as Preprocessing Step for Airway Tree Extraction in CT Scan
97
