
Approaches and Challenges in the
Visual-interactive Comparison of Human Motion Data
J
¨
urgen Bernard
1
, Anna V
¨
ogele
2
, Reinhard Klein
2
and Dieter Fellner
1,3
1
Interactive Graphics Systems Group (GRIS), TU Darmstadt, Darmstadt, Germany
2
Institute of Computer Graphics, University of Bonn, Bonn, Germany
3
Fraunhofer IGD, Darmstadt, Germany
Keywords:
Visual Comparison, Human Motion Capture Data, Motion Capture Analysis, Human-Computer Interaction,
Information Visualization, Visual Analytics, Information Retrieval, Data Mining, Machine Learning.
Abstract:
Many analysis goals involving human motion capture (MoCap) data require the comparison of motion patterns.
Pioneer works in visual analytics recently recognized visual comparison as substantial for visual-interactive
analysis. This work reflects the design space for visual-interactive systems facilitating the visual comparison
of human MoCap data, and presents a taxonomy comprising three primary factors, following the general
visual analytics process: algorithmic models, visualizations for motion comparison, and back propagation of
user feedback. Based on a literature review, relevant visual comparison approaches are discussed. We outline
remaining challenges and inspiring works on MoCap data, information visualization, and visual analytics.
1 INTRODUCTION
Data has long become one of the greatest scientific
assets. Almost any application field gathers huge
amounts of data, e.g., to conduct data-driven research.
In a variety of research and application fields such as
medicine, sports, or animation data recorded of hu-
man motion is collected and stored and made publicly
available. This human motion capture (MoCap) data
can be regarded as an instance of multivariate time se-
ries consisting of many numeric attributes depending
on time. A variety of systems and devices has become
available for recording MoCap data, e.g., for record-
ing motion by tracking body positions optically in a
markered (Peak, 2005) or marker-less setup (Zhang,
2012), as well as by tracking accelerations, angular
velocities (Roetenberg et al., 2009), and muscle acti-
vation (De Luca, 2003). All of these will be referred
to as MoCap data, representing unique characteristics
of human movement with respect to specific seman-
tics and their analysis applications.
Additionally, based on the different sources of MoCap
data, there are frequently applied established strate-
gies to derive representations of the primary data re-
sulting in deduced or secondary data. One of the most
often applied strategies is the extraction of features.
Extending the primary data the MoCap analysis do-
mains have created specific methods and techniques
focused on exposing and extracting as much of the
semantics as possible. Representative of these are de-
scriptors and segmentation methods that typically ex-
ploit both temporal and spatial information.
The increase of both primary and secondary Mo-
Cap data has created a need for efficient methods for
processing and analysis. Typical analytical fields are
data mining, machine learning and information re-
trieval. Recently, pioneer approaches in the visual-
interactive analysis of MoCap data have emerged in
the fields of information visualization and visual ana-
lytics (Bernard et al., 2013; Ragan et al., 2016; Wil-
helm et al., 2015; Bernard et al., 2016). These ini-
tial approaches clearly indicate that visualization can
be beneficial for analyzing MoCap data by empha-
sizing cognition and generating insight. In particu-
lar, the techniques used to visually compare the data
proved beneficial for supporting envisioned analysis
goals and tasks.
Obviously, these inspiring approaches provide only
initial assessment of what visual comparison can be
used to ease the analysis of MoCap data. Many data
mining, machine learning and retrieval approaches
can be enhanced with visual comparison techniques
to ‘open the black box’. Examples are the validation
of model results or even the integration of visual com-
parison techniques within the analytical workflow.
Altogether, visual comparison can support tradi-
Bernard J., VÃ˝ugele A., Klein R. and Fellner D.
Approaches and Challenges in the Visual-interactive Comparison of Human Motion Data.
DOI: 10.5220/0006127502170224
In Proceedings of the 12th International Joint Conference on Computer Vision, Imaging and Computer Graphics Theory and Applications (VISIGRAPP 2017), pages 217-224
ISBN: 978-989-758-228-8
Copyright
c
2017 by SCITEPRESS – Science and Technology Publications, Lda. All rights reserved
217

Table 1: Overview of the analytical tasks that benefit from
visual comparison.
Task References
Retrieval (M
¨
uller, 2007; Lew et al., 2006)
Tracking (Moeslund et al., 2006)
Cleansing (Gschwandtner et al., 2012)
Wrangling (Kandel et al., 2011)
Reconstruction (Hu et al., 2004)
Similarity search (Kr
¨
uger et al., 2010)
Feature analysis (M
¨
orchen, 2006)
Descriptor analysis (Keogh and Kasetty, 2003)
Pattern/anomaly detection (Sakurai et al., 2015)
Rule discovery (M
¨
orchen, 2006)
Recognition (Moeslund et al., 2006)
Classification (M
¨
uller and R
¨
oder, 2006)
Clustering (Warren Liao, 2005)
Segmentation (Fu, 2011)
Prediction (M
¨
orchen, 2006)
Monitoring (Lin et al., 2004)
Exploratory Search (Bernard, 2015)
tional analytical tasks — such as listed in Table 1 —
that benefit from visual comparison.
It can also be assumed that visual comparison of
MoCap data would further advance the analysis of
human motion in many applications. Physicians can
express, combine, and validate their observations of
human movement, e.g., towards the quantification of
observed progress in rehabilitation, by relying on Mo-
Cap data. Visual comparison can also help identify
and prevent patient behavior leading to injury and de-
terioration. In professional sports, trainers would be
able to assess the physical fitness of sportsmen by vi-
sually comparing MoCap data of individuals to oth-
ers in the team or against reference athletes. In ex-
ploratory applications, experts may seek differences
between individuals or groups to categorize, organize,
or structure large unknown data sets. In summary, vi-
sual comparison can facilitate various analysis goals
and tasks involving human motion patterns. Hence, a
variety of experts in a number of domains can be sup-
ported in performing their analysis tasks, e.g. in data-
driven research to generate and validate hypotheses.
However, supporting the visual comparison of
MoCap data is not an easy task. At a glance, we iden-
tify three primary challenges aggravating the design
of visual-interactive analysis systems. The first chal-
lenge comes with the classical problem of assembling
multiple algorithmic models in the right order with
the right parameters. As an upstream task in the pro-
cess, the input data need to be cleansed in order to
meet the quality requirements of algorithms. In addi-
tion, adequate features and similarity measures need
to be defined. At heart of the first problem is the def-
inition of pattern abstraction algorithms to cope with
the complexity of the temporal domain. The second
challenge refers to the characterization of appropriate
visualization designs to support visual comparison.
At least three aspects need to be taken into consid-
eration. MoCap patterns can be compared at different
levels of granularity including single dimensions (fea-
tures), single patterns (elementary level), and groups
of pattern (synoptic level) (Andrienko and Andrienko,
2006). In addition, we distinguish between the com-
parison of a single object at different times (e.g.,
stages of a recovery process) and the comparison be-
tween subjects or groups of subjects. Finally, the dis-
tinction between comparing original MoCap patterns
and derivatives of patterns (delta-visualization) is an
issue by itself. The third primary challenge is asso-
ciated with the matter of integrating a feedback loop,
i.e., facilitating a ’human-in-the-loop‘ process, allow-
ing the adaption and improvement of analytical mod-
els and outcomes. Providing meaningful interaction
designs is one part of this challenge. Back propaga-
tion of feedback triggering algorithms to adapt results
towards users’ information needs is another.
Based on a review of related works in the fields
of human MoCap analysis, information visualization,
and visual analytics, we contribute an overview of ap-
proaches and challenges in the visual-interactive com-
parison of human MoCap data. To this end, we char-
acterize the problem space according to three main
factors reflecting the algorithmic workflow of the vi-
sual analytics process (Keim et al., 2010). At a
glance, this space covers challenges of algorithmic
models, designing comparative visualizations, and
closing the feedback loop. For each of the three fac-
tors, we discuss a series of related technical obsta-
cles and survey related works as far as proposed yet.
The characterization of the problem space can be used
as a light-weight taxonomy for the design of visual-
interactive analysis approaches using visual compari-
son as a means to support analysis goals and tasks.
2 APPROACHES AND
CHALLENGES
This section provides an overview of approaches and
remaining challenges in the visual comparison of Mo-
Cap data. The problem space is structured by three
prior factors with interactions highlighted in Figure 1.
2.1 Algorithmic Models
2.1.1 Pre-Processing
Techniques employed for cleansing, tracking and
wrangling ensure that data are in a state they can be
used for further processing. The works of Gschwandt-
ner et al. (Gschwandtner et al., 2012) and Kandel et
al. (Kandel et al., 2011) provide taxonomies of ‘dirty’
IVAPP 2017 - International Conference on Information Visualization Theory and Applications
218

Analysis GoalsMoCap Data
Pattern Extraction
Visual Comparison
Preprocessing,
Transformation
Mapping
Data
Mining,
Machine
Learning
Model
Building
Model
Visualization
User Interaction
Parameter
Renement
Automated MoCap Data Analysis
Visual MoCap Data Exploration
Feedback Loop
Figure 1: Interplay between MoCap data, extracted pat-
terns, and visual pattern comparison, adopted from the
visual analytics process (Keim et al., 2010). The feed-
back loop can trigger data transformations, model building,
model visualization, and parameter refinement.
time series and cleansing strategies, Bernard et al.
present a visual-interactive tool for preprocessing uni-
variate time series (Bernard et al., 2012a). Specif-
ically for MoCap data, the survey of Moeslund et
al. (Moeslund et al., 2006) discusses advances in the
state of the art in pre-processing records of articulated
motion. MoCap data often have to undergo further
specific pre-processing steps such as re-sampling and
filtering in order to meet the quality requirements of
downstream algorithms. As MoCap data carry unique
semantic information, the pre-processing has to en-
sure this structure is preserved (cf. Bruderlin and
Williams (Bruderlin and Williams, 1995)). The gen-
eral role of descriptors in mining time series data is
discussed in the survey of Keogh and Kassety (Keogh
and Kasetty, 2003), particularly, with a focus on the
biases caused by implementation and experimental
data. MoCap data encode a spectrum of semantic in-
formation ranging from task-oriented (gross sensory)
to gestures and communication (fine-motor). The
choice of meaningful descriptors for different full-
body setups is one challenging aspect (Tautges et al.,
2011). As the representation of fine motor movement
in associated applications and use cases is a highly
specific and complex task, there is yet no general so-
lution for the design of descriptors and features. Sev-
eral works discuss how to face the challenge of infor-
mation and semantics preservation when defining fea-
ture spaces for motion data (M
¨
uller and R
¨
oder, 2006;
Kr
¨
uger, 2012).
2.1.2 Pattern Extraction
Extraction of patterns from time series data is a topic
that has been addressed in a variety of contexts. The
explosion of interest in time series segmentation and
mining has raised many interesting research topics
from the representation of input data to clustering,
and classification algorithms. An earlier overview of
advances in the analysis of time series data bases is
found in the survey of Keogh et al. (Keogh et al.,
2004). Motion data segmentation has since seen
rapid development, both in the context of detect-
ing activities and detecting motion primitives (Barbi
ˇ
c
et al., 2004; Zhou et al., 2013; Wang et al., 2015;
V
¨
ogele et al., 2014). As a recent development, visual-
interactive toolkits applying a variety of general seg-
mentation algorithms on MoCap data have been pro-
posed (Bernard et al., 2016). Identification of cyclic
and periodic behavior is of specific interest in pro-
cessing MoCap data for the repetitive nature of human
motion. This is reflected by the findings of Wang et
al. and V
¨
ogele et al. (Wang et al., 2015; V
¨
ogele et al.,
2014). Segmentation tasks are typically embedded in
the more general analysis task of investigating MoCap
patterns. Generally, relating sub-sequences of time
series to one another allows for outlier and anomaly
detection, as well as for frequent pattern analysis. An
overview of the most important tools in pattern recog-
nition is found in the Sakurai et al. (Sakurai et al.,
2015). For motion data, the analysis of frequent pat-
terns and anomalies comprises processes such as de-
tection, segmentation, recognition, classification and
identification. Surveys on pattern and anomaly de-
tection are found in the works of Wang et al. (Wang
et al., 2003) and Chen et al. (Chen et al., 2013). The
analysis of time series data depends on the similarity
measures employed, for a review see, e.g., the work
of Aghabozorgi et al. (Aghabozorgi et al., 2015). The
choice of adequate similarity measures for MoCap
data is discussed in detail in the works of Kr
¨
uger et
al. (Kr
¨
uger et al., 2010; Kr
¨
uger et al., 2015). In this
connection the concept of self-similarity has proven
to be beneficial. However, it remains a challenge to
integrate representations of self-similarity into visual-
interactive systems as a means of visual comparison.
2.2 Visualizations for Motion
Comparison
We survey approaches and challenges related to the
visualization of patterns to be compared. The three
issues rely on the granularity of the patterns, the scope
of users in their application, as well as on the class of
visual comparison technique.
2.2.1 Different Levels of Granularity
The visual comparison of MoCap patterns basically
comes with three different levels of granularity, i.e.,
features, single objects, and groups of objects.
The visual comparison of features (dimensions) is
a popular field of research in general. More specifi-
cally, techniques for the visual comparison of univari-
Approaches and Challenges in the Visual-interactive Comparison of Human Motion Data
219
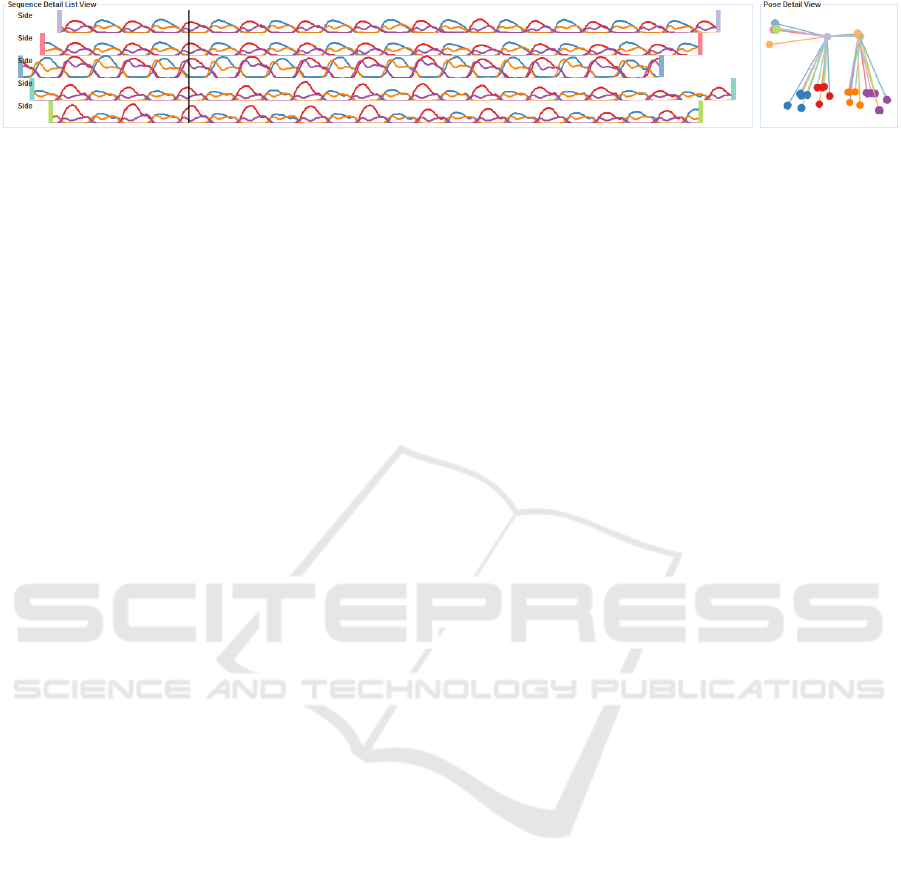
Figure 2: Visual comparison of horse gaits (Wilhelm et al., 2015). Four features of hoofes are represented with time series
visualizations (red, blue, orange, purple curves). Moreover, the features of six individual horses visualized in a line-based
visualization. User interaction allows the temporal synchronization and visual comparison of feature progressions.
ate time series can be seen as an instance of compar-
ing individual features. We refer to the book of Aigner
et al. for an overview of time series analysis ap-
proaches including visual comparison tasks (Aigner
et al., 2011). The LiveRac approach supports the
visual comparison of multivariate time series fea-
tures (McLachlan et al., 2008), the challenge of visual
scalability is solved by prioritizing features depend-
ing on their interestingness (McLachlan et al., 2008).
The creation of trajectories is one technique applied
for the visual comparison of features or sets of fea-
tures (Kr
¨
uger et al., 2010; Tautges et al., 2011). As an
alternative multiple linecharts can be used to represent
and compare multiple features (Bernard et al., 2016).
However, one remaining problem of this class of tech-
niques is the pure number of dimensions causing vi-
sual overplotting. This problem can be addressed by
supporting the selection of interesting feature subsets,
as provided in the FuryExporer approach where users
can select features reflecting horse body positions for
a detailed comparison (Wilhelm et al., 2015). An ex-
ample is depicted in Figure 2 showing four selected
hoofes (red, blue, orange, purple). It becomes ap-
parent that the visual comparison of features needs
to address at least three degrees of freedom: temporal
offset, feature normalization, and motion speed.
The visual comparison of individual MoCap pat-
terns can support elementary (Andrienko and An-
drienko, 2006) analysis tasks, i.e., the comparison of
single or several individual objects. In general a va-
riety of approaches exist supporting the comparison
of patterns, e.g., for analysts seeking periodic behav-
ior, frequent patterns, or anomalies. Again, we refer
to the book of Aigner et al. for an overview of ap-
proaches related to general time series data (Aigner
et al., 2011). For MoCap data we refer to a mo-
tion pattern as a small (sub-)sequence worth to be
analyzed as an individual data object. Since mo-
tion patterns can have different characteristics with
respect to the temporal and the value domain one
challenge for the visual comparison is emphasizing
aspects that contribute to the differentiation of pat-
terns while reducing less important information for
the visual comparison. One visual approach for the
comparison of MoCap segmentation results preserves
the length of the patterns (here: segments) while ab-
stracting the multivariate value domain to similarity-
preserving colors (Bernard et al., 2016). Other ap-
proaches abstract from the temporal domain by pro-
jecting the multivariate MoCap data into 2D, yield-
ing path metaphors allowing the visual comparison of
patterns (Hu et al., 2010; Bernard et al., 2012b; Wil-
helm et al., 2015), see, e.g., Figure 4. In these cases
patterns may not even be explicit, but may be iden-
tified by analyzing path distributions in the 2D out-
put space. One class of visual comparison approaches
considering both the temporal and the value domain is
based on self-similarity, often represented with matrix
visualizations (V
¨
ogele et al., 2014), see Figure 3.
The visual comparison of groups of patterns sup-
ports analysis tasks at a synoptic (Andrienko and An-
drienko, 2006) level. Presumed that upstream chal-
lenges in extracting patterns are addressed, challenges
exist in visualizing clusters (bundles) of patterns, ide-
ally including information about their variance. Lin
et al. avoid this problem by transforming time se-
ries into an alphabet of symbols, yet leading to a vi-
sually scalable solution (Lin et al., 2005). Another
way to represent the variance of patterns is to apply
visual metaphors known from uncertainty visualiza-
tion (Gschwandtner et al., 2016). Examples for Mo-
Cap patterns are slope visualizations (Min and Chai,
2012) or bundling techniques for clusters of human
poses (Bernard et al., 2013), see Figure 5. In addi-
tion, projection-based techniques reveal variances in
the value domain of motion patterns by spatial dis-
tributions of path metaphors in 2D (Hu et al., 2010;
Bernard et al., 2012b; Wilhelm et al., 2015).
2.2.2 Scope of Compared Objects
The review of related works in MoCap analysis re-
vealed that approaches can be differentiated in within-
subject and between-subject analyses, see Figure 6.
Within-subject analyses focus on individual subjects
that are observed over absolute time. Between-subject
analyses often abstract from absolute time and com-
pare different subjects or groups of subjects. From a
visualization point of view taking the absolute time
IVAPP 2017 - International Conference on Information Visualization Theory and Applications
220

Figure 3: Examples for the visual comparison of a series
of poses. Left: the 2.5D visualization represents the per-
formed motion, overplotting remains a challenge. Right:
self-similairty matrix showing periodic motion over 1,150
tracked frames (V
¨
ogele et al., 2014; Kr
¨
uger et al., 2015).
into account causes additional challenges. Represen-
tatives of such within-subject scenarios make use of
absolute time are found in rehabilitation and physi-
cal performance improvement (Zhou and Hu, 2008;
Payton and Bartlett, 2007). Many exploratory data
analysis scenarios are based on between-subject com-
parison. Exploration may also reveal interesting indi-
viduals to be analyzed in a within-subject scenario.
2.2.3 Comparing Data or Derivates
The third challenge in the scope of designing visu-
alizations for the comparison of MoCap data refers
to the comparison concept. According to Gleicher
et al. (Gleicher et al., 2011) visual comparison tech-
niques in general can be differentiated into three
classes. First, the class of juxtaposed visualizations
showing different objects side-by-side (see, e.g., Fig-
ure 4). Second, the class of superimposed visualiza-
tions where multiple layers are used to represent mul-
tiple objects (see, e.g., bundles in Figure 5). Both
classes use the original data to support the visual com-
parison task. In contrast, the third class of techniques
is referred to as explicit encoding showing not original
data but differences between objects or details about
their (co-)relations. A classical example from time
series analysis combining superposition and juxtapo-
sition is the calender view approach presented by van
Wijk et al. (Van Wijk and Van Selow, 1999) show-
ing differences between clusters of daily time series
patterns. A frequently applied technique based on
juxtaposition is showing small multiples of a given
type of object side-by-side, e.g, in the context of uni-
variate time series patterns (Fuchs et al., 2013). Ex-
plicit encoding of differences can, e.g., be achieved
with glyphs, allowing the visual representation of a
set of abstract data attributes in a compact and repre-
sentative way (Borgo et al., 2013). Considering Mo-
Cap data, superimposed techniques exist for the vi-
Figure 4: Visual comparison of two individuals performing
a motion class (Kr
¨
uger et al., 2015). Dimension reduction
is applied to make the highdimensional spatial domain vi-
sually comparable. This type of vector space representation
comes with the cost of loosing semantical information.
sual comparison of clusters of human poses (Bernard
et al., 2013; Jang et al., 2016), allowing the anal-
ysis of variances, i.e. style variations of individual
poses. Similarly, multiple cluster visualizations can
be used to compare patterns in a juxtaposed way, e.g.
aligned with respect to the high-dimensional structure
of the data, structured as a result of projection algo-
rithms (Bernard et al., 2013) or sequence visualiza-
tions (Jang et al., 2016). One specific characteristics
of MoCap data is the visualization of directions and
accelerations of human poses to represent the tempo-
ral domain (Tautges, 2012). While this property adds
to the challenge of comparing motion patterns visu-
ally, it can be seen as a type of explicit encoding.
2.3 Integrating the Feedback Loop
Any user interaction can be considered as potential
feedback for the system. Interaction in visual analysis
systems enables users to adapt the visual representa-
tion, the visual encoding of data, but also algorithmic
models to improve analysis results, successively. We
discuss challenges regarding user interaction in com-
bination with MoCap data analysis, an overview of in-
teractive visual analysis approaches for multifaceted
scientific data in general is, e.g., presented by Kehrer
and Hauser (Kehrer and Hauser, 2013).
2.3.1 Synchronization of MoCap Patterns
Apart from general interaction designs MoCap data
analysis can benefit from techniques supporting the
interactive synchronization of MoCap patterns with
the goal to optimize the visual representation of in-
dividual temporal domains for the visual comparison.
In this way, users can focus on specific features, pat-
terns, or groups of patterns that are particularly in-
teresting for visual comparison. One example where
interaction is used to synchronize MoCap patterns is
provided with the FuryExplorer approach (Wilhelm
Approaches and Challenges in the Visual-interactive Comparison of Human Motion Data
221
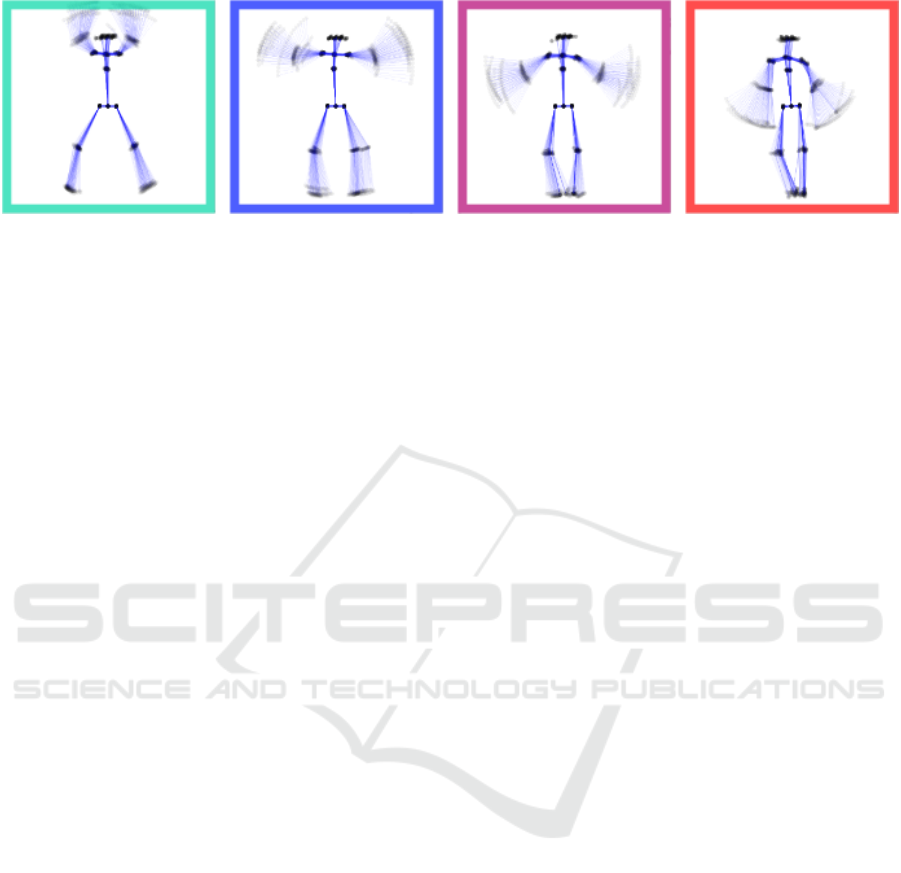
Figure 5: Visual comparison of groups of MoCap patterns (Bernard et al., 2013). In the example the result of clustered poses
is compared visually. The hip was used to align different poses at center of the visualization, i.e., to foster visual comparison
in an intuitive way. The example indicates that color can be an effective means to communicate orderdness or even similarity.
et al., 2015). To improve synchronization, user in-
teraction applies affine transformations on single Mo-
Cap patterns which can visually be compared in a jux-
taposed horizontal arrangement. One associated chal-
lenge refers to the tedious process of aligning individ-
ual MoCap patterns, leading to the research question
on how to generalize local synchronization results for
the entire data set. One approach borrowed from time
series analysis is the idea of identifying local points of
interest (Schreck et al., 2012). These points of inter-
est can be a basis to automate pattern synchronization
tasks, similar to approaches matching point clouds in
the visual computing domain (Goesele et al., 2010).
2.3.2 Histories of User Interaction
One primary challenge associated with the use of in-
teraction is to provide the history of user interaction,
which represents one type of provenance information.
While providing provenance information has come to
attention in information visualization (Ragan et al.,
2016) in general, it has hardly been considered for
the visual analysis of MoCap data. Challenges are the
visual representation of interaction states, as well as
the identification of ‘interaction mile stones’ (cf. (Ra-
gan et al., 2016)). Depending on the granularity of the
analysis (cf. Section 2.2.1) limitations in the available
display space need to be considered.
2.3.3 Back Propagation of User Feedback
A core principle of visual analytics is to support user
interactions that trigger algorithmic models for result
adjustment and successive improvement. Being able
to compare different analytical results in a visual way
is key to conduct effective analysis approaches. The
visual comparison of data objects and clusters was ex-
ploited in various visual analytics approaches includ-
ing multiple classes of algorithms. For MoCap data
feedback loops were implemented for clustering and
projection (Bernard et al., 2013), visual abstraction
and aggregation (Jang et al., 2016), and segmenta-
tion (Bernard et al., 2016). However, the majority
of algorithmic models and workflows in the MoCap
data analysis domain is grounded on ‘blackbox’ ap-
proaches, which can be enhanced by putting the user
in the loop. The specificity of algorithms and the com-
plexity of workflows may pose additional challenges
for MoCap data (cf. Section 2.1). Example models
that could be accessed by the feedback loop are algo-
rithms for data cleansing, normalization, feature se-
lection, descriptor choice, and similarity search. In
addition, active learning approaches and other con-
cepts based on machine learning could be integrated
to capture user feedback and improve the analytical
outcome. In summary, coping with the huge design
space defined by the different algorithmic models by
including the back propagation of user feedback re-
mains subject of future work.
3 CONCLUSION
In this work, we presented an overview of approaches
and challenges in the visual-interactive comparison of
human motion capture data. The characterization of
the problem space grounded on three essential fac-
tors, i. e., algorithmic models, designing compara-
tive visualizations, and enabling analytical feedback
loops. For each of the three factors, we identified a
series of challenges and surveyed related approaches
concerned with each of them. We identified vari-
ous gaps in scientific literature regarding the problem
space and associated challenges. Pursuing collabo-
rative approaches can be one way to mitigate these
gaps. Specialists involved in the analysis of human
motion capture data could contribute their domain
knowledge and elaborate novel approaches together
with experts in information visualization and visual
analytics. While this type of collaboration can con-
tribute to answering basic research questions, the in-
volvement of users working on real-world problems
IVAPP 2017 - International Conference on Information Visualization Theory and Applications
222
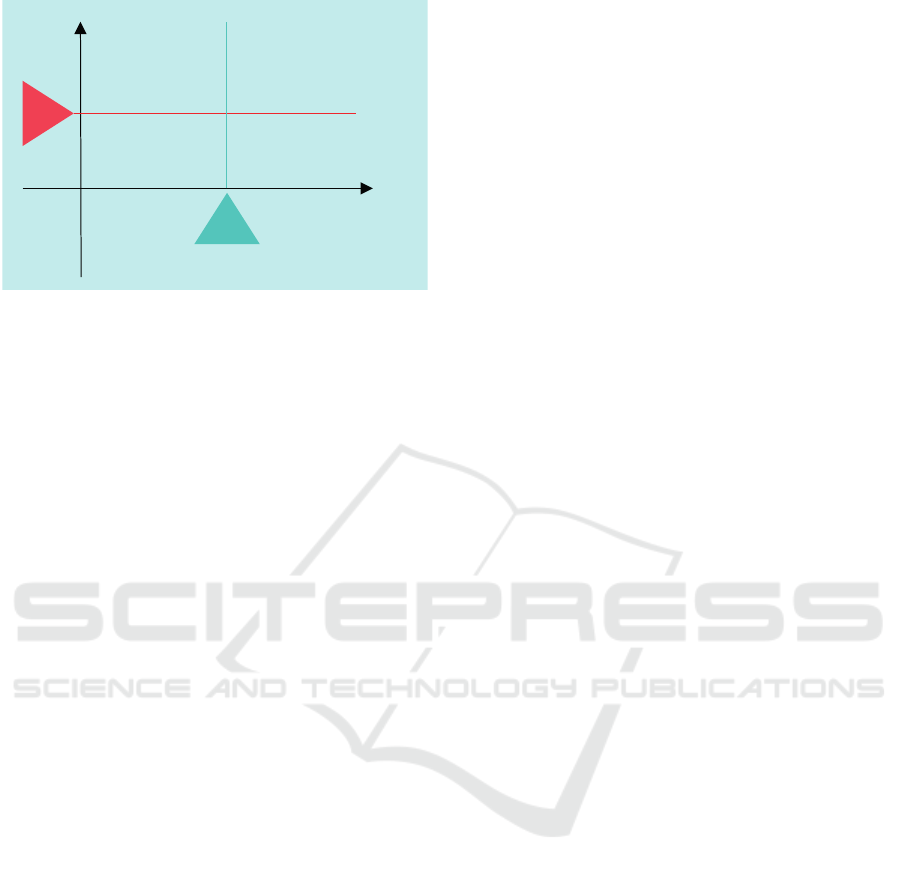
me
subject
One subject over me
Groups of subjects at me x
Figure 6: Two abstract analysis tasks often applied in the
analysis of human motion. Comparison of a single subject
at different times and multiple subjects at a given time.
would lead to relevant and useful applications.
REFERENCES
Aghabozorgi, S., Shirkhorshidi, A. S., and Wah, T. Y.
(2015). Time-series clustering–a decade review. In-
formation Systems, 53:16–38.
Aigner, W., Miksch, S., Schumann, H., and Tominski, C.
(2011). Visualization of Time-Oriented Data. Human-
Computer Interaction. Springer Verlag, 1st edition.
Andrienko, N. and Andrienko, G. (2006). Exploratory
Analysis of Spatial and Temporal Data: A Systematic
Approach. Springer-Verlag New York, Inc., Secaucus,
NJ, USA.
Barbi
ˇ
c, J., , Pan, J.-Y., Faloutsos, C., Hodgins, J. K., and
Pollard, N. (2004). Segmenting motion capture data
into distinct behaviors. In Graphics Interface 2004,
pages 185 – 194.
Bernard, J. (2015). Exploratory search in time-oriented pri-
mary data. PhD thesis, Technische Universit
¨
at, Darm-
stadt.
Bernard, J., Dobermann, E., Bgl, M., Rhlig, M., Vgele, A.,
and Kohlhammer, J. (2016). Visual-Interactive Seg-
mentation of Multivariate Time Series. In EuroVis
Workshop on Visual Analytics (EuroVA). Eurograph-
ics.
Bernard, J., Ruppert, T., Goroll, O., May, T., and Kohlham-
mer, J. (2012a). Visual-interactive preprocessing
of time series data. In SIGRAD, volume 81 of
Link
¨
oping Electronic Conference Proceedings, pages
39–48. Link
¨
oping University Electronic Press.
Bernard, J., Wilhelm, N., Kr
¨
uger, B., May, T., Schreck,
T., and Kohlhammer, J. (2013). Motionexplorer:
Exploratory search in human motion capture data
based on hierarchical aggregation. IEEE Transactions
on Visualization and Computer Graphics (TVCG),
19(12):2257–2266.
Bernard, J., Wilhelm, N., Scherer, M., May, T., and
Schreck, T. (2012b). TimeSeriesPaths: Projection-
Based Explorative Analysis of Multivariate Time Se-
ries Data. Journal of WSCG, 20(2):97–106.
Borgo, R., Kehrer, J., Chung, D. H., Maguire, E.,
Laramee, R. S., Hauser, H., Ward, M., and Chen, M.
(2013). Glyph-based visualization: Foundations, de-
sign guidelines, techniques and applications. In EG
State of the Art Reports, EG STARs, pages 39–63. Eu-
rographics.
Bruderlin, A. and Williams, L. (1995). Motion signal pro-
cessing. In Computer Graphics and Interactive Tech-
niques (SIGGRAPH), pages 97–104. ACM.
Chen, L., Wei, H., and Ferryman, J. (2013). A survey of
human motion analysis using depth imagery. Pattern
Recogn. Lett., 34(15):1995–2006.
De Luca, G. (2003). Fundamental concepts in emg signal
acquisition. Copyright Delsys Inc.
Fu, T.-c. (2011). A review on time series data mining. Eng.
Appl. Artif. Intell., 24(1):164–181.
Fuchs, J., Fischer, F., Mansmann, F., Bertini, E., and Isen-
berg, P. (2013). Evaluation of alternative glyph de-
signs for time series data in a small multiple setting. In
SIGCHI Conf. on Human Factors in Computing Sys-
tems (CHI), pages 3237–3246. ACM.
Gleicher, M., Albers, D., Walker, R., Jusufi, I., Hansen,
C. D., and Roberts, J. C. (2011). Visual comparison
for information visualization. Information Visualiza-
tion, 10(4):289–309.
Goesele, M., Ackermann, J., Fuhrmann, S., Haubold, C.,
Klowsky, R., Steedly, D., and Szeliski, R. (2010). Am-
bient point clouds for view interpolation. ACM Trans-
actions on Graphics (TOG), 29(4):95:1–95:6.
Gschwandtner, T., B
¨
ogl, M., Federico, P., and Miksch, S.
(2016). Visual encodings of temporal uncertainty: A
comparative user study. IEEE Transactions on Visual-
ization and Computer Graphics, 22:539 – 548.
Gschwandtner, T., G
¨
artner, J., Aigner, W., and Miksch, S.
(2012). A taxonomy of dirty time-oriented data. In
LNCS 7465: Multidisciplinary Research and Practice
for Information Systems, pages 58 – 72. Springer.
Hu, W., Tan, T., Wang, L., and Maybank, S. (2004). A
survey on visual surveillance of object motion and be-
haviors. IEEE Transactions on Systems, Man, and Cy-
bernetics, Part C (App. and Reviews), 34(3):334–352.
Hu, Y., Wu, S., Xia, S., Fu, J., and 0001, W. C. (2010).
Motion track: Visualizing variations of human motion
data. In PacificVis, pages 153–160. IEEE.
Jang, S., Elmqvist, N., and Ramani, K. (2016). Motion-
flow: Visual abstraction and aggregation of sequential
patterns in human motion tracking data. IEEE Trans.
Vis. Comput. Graph., 22(1):21–30.
Kandel, S., Heer, J., Plaisant, C., Kennedy, J., van Ham,
F., Riche, N. H., Weaver, C., Lee, B., Brodbeck, D.,
and Buono, P. (2011). Research directions in data
wrangling: Visualizations and transformations for us-
able and credible data. Information Visualization,
10(4):271–288.
Kehrer, J. and Hauser, H. (2013). Visualization and vi-
sual analysis of multifaceted scientific data: A sur-
vey. IEEE Transactions on Visualization and Com-
puter Graphics (TVCG), 19(3):495–513.
Approaches and Challenges in the Visual-interactive Comparison of Human Motion Data
223

Keim, D., Kohlhammer, J., Ellis, G., and Mansmann,
F., editors (2010). Mastering the Information Age:
Solving Problems with Visual Analytics. VisMaster,
http://www.vismaster.eu/book/.
Keogh, E., Chu, S., Hart, D., and Pazzani, M. (2004). Seg-
menting time series: A survey and novel approach.
Data mining in time series databases, 57:1–22.
Keogh, E. and Kasetty, S. (2003). On the need for time se-
ries data mining benchmarks: A survey and empirical
demonstration. Data Mining and Knowledge Discov-
ery, 7(4):349–371.
Kr
¨
uger, B. (2012). Synthesizing Human Motions. Disserta-
tion, Universit
¨
at Bonn.
Kr
¨
uger, B., Tautges, J., Weber, A., and Zinke, A. (2010).
Fast local and global similarity searches in large mo-
tion capture databases. In ACM SIGGRAPH/EG
Symp. on Comp. Anim., pages 1–10. Eurographics.
Kr
¨
uger, B., V
¨
ogele, A., Willig, T., Yao, A., Klein, R.,
and Weber, A. (2015). Efficient unsupervised tem-
poral segmentation of motion data. arXiv preprint
arXiv:1510.06595.
Lew, M. S., Sebe, N., Djeraba, C., and Jain, R. (2006).
Content-based multimedia information retrieval: State
of the art and challenges. ACM Trans. Multimedia
Comput. Commun. Appl., 2(1):1–19.
Lin, J., Keogh, E., and Lonardi, S. (2005). Visualizing
and discovering non-trivial patterns in large time se-
ries databases. Information Visualization, 4(2):61–82.
Lin, J., Keogh, E., Lonardi, S., Lankford, J. P., and Nys-
trom, D. M. (2004). Visually mining and monitor-
ing massive time series. In ACM SIGKDD Knowledge
Discovery and Data Mining, pages 460–469. ACM.
McLachlan, P., Munzner, T., Koutsofios, E., and North, S.
(2008). Liverac: Interactive visual exploration of sys-
tem management time-series data. In SIGCHI Confer-
ence on Human Factors in Computing Systems (CHI),
pages 1483–1492. ACM.
Min, J. and Chai, J. (2012). Motion graphs++: A compact
generative model for semantic motion analysis and
synthesis. ACM Trans. Graph., 31(6):153:1–153:12.
Moeslund, T. B., Hilton, A., and Kr V. (2006). A survey of
advances in vision-based human motion capture and
analysis. Computer Vision and Image Understanding,
104(2 - 3):90 – 126.
M
¨
orchen, F. (2006). Time series knowledge mining. PhD
thesis, University of Marburg.
M
¨
uller, M. (2007). Information Retrieval for Music and
Motion. Springer-Verlag New York, Inc.
M
¨
uller, M. and R
¨
oder, T. (2006). Motion templates for au-
tomatic classification and retrieval of motion capture
data. In ACM SIGGRAPH/EG Symposium on Com-
puter Animation (SCA), pages 137–146. Eurograph-
ics.
Payton, C. and Bartlett, R. (2007). Biomechanical evalu-
ation of movement in sport and exercise: the British
Assoc. of Sport and Exercise Sciences guide. Rout-
ledge.
Peak, V. (2005). Vicon motion capture system.
Ragan, E. D., Endert, A., Sanyal, J., and Chen, J. (2016).
Characterizing provenance in visualization and data
analysis: An organizational framework of provenance
types and purposes. IEEE Trans. Vis. Comput. Graph.,
22(1):31–40.
Roetenberg, D., Luinge, H., and Slycke, P. (2009). Xsens
mvn: full 6dof human motion tracking using minia-
ture inertial sensors. Xsens Motion Technologies BV,
Tech. Rep.
Sakurai, Y., Matsubara, Y., and Faloutsos, C. (2015). Min-
ing and forecasting of big time-series data. In ACM
SIGMOD International Conference on Management
of Data, pages 919–922. ACM.
Schreck, T., Sharalieva, L., Wanner, F., Bernard, J., Rup-
pert, T., von Landesberger, T., and Bustos, B. (2012).
Visual exploration of local interest points in sets of
time series. In IEEE Conf. on Visual Analytics Sci-
ence and Technology (VAST, Poster), pages 239–240.
Tautges, J. (2012). Reconstruction of Human Motions
Based on Low-Dimensional Control Signals. Disser-
tation, Universit
¨
at Bonn.
Tautges, J., Zinke, A., Kr
¨
uger, B., Baumann, J., Weber,
A., Helten, T., M
¨
uller, M., Seidel, H.-P., and Eber-
hardt, B. (2011). Motion reconstruction using sparse
accelerometer data. ACM Trans. Graph., 30(3):18:1–
18:12.
Van Wijk, J. J. and Van Selow, E. R. (1999). Cluster and
calendar based visualization of time series data. In
IEEE Symposium on Information Visualization (Info-
Vis, pages 4–. IEEE Computer Society.
V
¨
ogele, A., Kr
¨
uger, B., and Klein, R. (2014). Efficient
unsupervised temporal segmentation of human mo-
tion. In ACM SIGGRAPH/EG Symposium on Com-
puter Animation (SCA). Eurographics.
Wang, L., Hu, W., and Tan, T. (2003). Recent develop-
ments in human motion analysis. Pattern recognition,
36(3):585–601.
Wang, Q., Kurillo, G., Ofli, F., and Bajcsy, R. (2015). Un-
supervised temporal segmentation of repetitive human
actions based on kinematic modeling and frequency
analysis. In International Conference on 3D Vision
(3DV), pages 562–570. IEEE.
Warren Liao, T. (2005). Clustering of time series data-a
survey. Pattern Recogn., 38(11):1857–1874.
Wilhelm, N., V
¨
ogele, A., Zsoldos, R., Licka, T., Kr
¨
uger,
B., and Bernard, J. (2015). Furyexplorer: visual-
interactive exploration of horse motion capture data.
In IS&T/SPIE Electronic Imaging, pages 93970F–
93970F.
Zhang, Z. (2012). Microsoft kinect sensor and its effect.
MultiMedia, IEEE, 19(2):4–10.
Zhou, F., la Torre, F. D., and Hodgins, J. K. (2013). Hierar-
chical aligned cluster analysis for temporal clustering
of human motion. IEEE Trans. on Pattern Analysis
and Machine Intelligence, 35(3):582–596.
Zhou, H. and Hu, H. (2008). Human motion tracking for
rehabilitationa survey. Biomedical Signal Processing
and Control, 3(1):1–18.
IVAPP 2017 - International Conference on Information Visualization Theory and Applications
224
