
Model-based Segmentation of 3D Point Clouds for Phenotyping
Sunflower Plants
William G
´
elard
1,2,3
, Michel Devy
1
, Ariane Herbulot
1,2
and Philippe Burger
3
1
CNRS, LAAS, 7 Avenue du Colonel Roche, F-31400 Toulouse, France
2
Univ de Toulouse, UPS, LAAS, F-31400 Toulouse, France
3
INRA, AGIR, 24 Chemin de Borde Rouge, F-31326 Castanet-Tolosan, France
{wgelard, devy, herbulot}@laas.fr, pburger@toulouse.inra.fr
Keywords:
3D Plant Phenotyping, Structure from Motion, Clustering, Labeling, Nurbs Fitting, Sunflowers.
Abstract:
This article presents a model-based segmentation method applied to 3D data acquired on sunflower plants. Our
objective is the quantification of the plant growth using observations made automatically from sensors moved
around plants. Here, acquisitions are made on isolated plants: a 3D point cloud is computed using Structure
from Motion with RGB images acquired all around a plant. Then the proposed method is applied in order to
segment and label the plant leaves, i.e. to split up the point cloud in regions corresponding to plant organs:
stem, petioles, and leaves. Every leaf is then reconstructed with NURBS and its area is computed from
the triangular mesh. Our segmentation method is validated comparing these areas with the ones measured
manually using a planimeter: it is shown that differences between automatic and manual measurements are
less than 10%. The present results open interesting perspectives in direction of high-throughput sunflower
phenotyping.
1 INTRODUCTION
Thanks to the rapid development of high throughput
genotyping methods during the last decade, plant sci-
entists have now access to a huge amount of data on
genome sequences and genes with new avenues for
increasing production and secure food demand. With
the perspective of a sustainable agriculture and issues
raised by climate change, a better understanding of re-
lationships between genotype (DNA) and phenotype
(visual characteristics) in a given environment be-
came the main issue in agricultural research (Dhondt
et al., 2013; Fiorani and Schurr, 2013). Currently,
most plant phenotyping methods are manual, inva-
sive, sometimes destructive, do not allow to obtain
high throughput results and slow down the research.
The French National Institute for Agricultural Re-
search (INRA) is working on the Sunrise project,
a joint research program on sunflower adaptation to
drought in Toulouse at the interface of ecophysiology
and genetics. To fill the gap of phenotyping, a plat-
form has been built, allowing to monitor up to 1300
sunflower pots and control the water stress of each
plant. This paper puts the emphasis on the develop-
ment of tools that allow to characterize from 3D data
acquired on isolated plants, information for each leaf,
making possible a temporal analysis of leaf expansion
and senescence of sunflower plants.
In this study, a model-based segmentation of 3D
point clouds acquired on isolated sunflower plants, is
proposed with an attention given on the labeling of
each leaf in order to be able to compute leaf area dy-
namics. The following terms will be used in this arti-
cle (see figure 1):
• Main stem, the primary plant axis that starts from
the soil (here in a pot) and supports the leaves.
• Leaf: an unstructured thin and more or less elon-
gated object, the area of the upper (adaxial) side
must be estimated from 3D points assigned to its
surface.
• Petiole: a thin stalk from the main stem to a leaf.
The petioles insertion positions on the stem allow
to label leaves: for all varieties of sunflower, a
widely adopted rule for numbering the leaves is
used so that each leaf is given a unique label.
• Top: the crown of the plant, at the stem extremity,
where young leaves appear around the capitulum.
Leaf area is computed only when the leaf is more
than 6cm long; the capitulum is not considered in
computations.
Gelard W., Devy M., Herbulot A. and Burger P.
Model-based Segmentation of 3D Point Clouds for Phenotyping Sunflower Plants.
DOI: 10.5220/0006126404590467
In Proceedings of the 12th International Joint Conference on Computer Vision, Imaging and Computer Graphics Theory and Applications (VISIGRAPP 2017), pages 459-467
ISBN: 978-989-758-225-7
Copyright
c
2017 by SCITEPRESS – Science and Technology Publications, Lda. All rights reserved
459
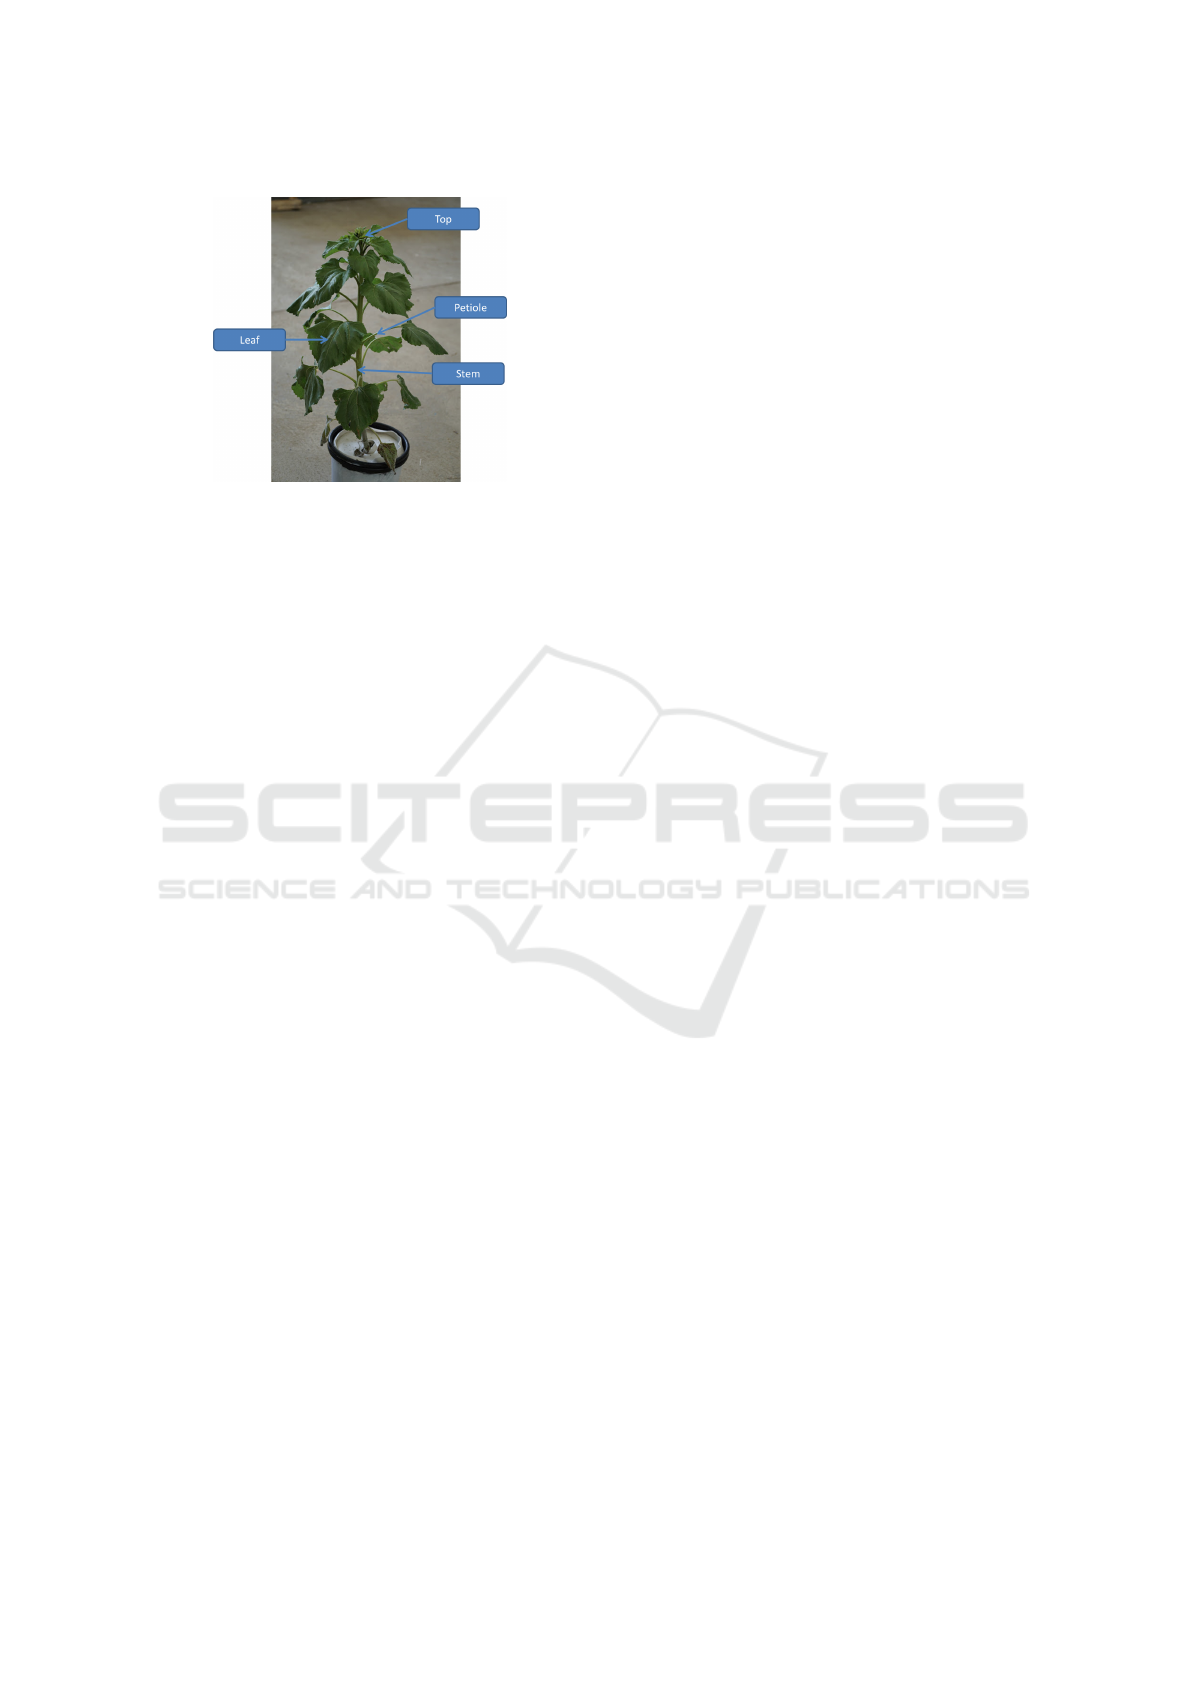
Figure 1: Description of a sunflower plant.
Biologists require an automatic method in order
to characterize the plant state, typically the total plant
leaf area, here computed by summing all the individ-
ual leaf areas. Moreover they are interested in moni-
toring the individual leaf expansion all along the veg-
etative phase and green leaf area decline after flower-
ing to study dynamics of plant variables.
This paper is organized as follows: section 2
presents the acquisition method used to obtain a 3D
point cloud on a sunflower plant, section 3 presents
the different studies on 3D plant phenotyping, section
4 presents the proposed method for the model-based
segmentation of a 3D point cloud, providing the re-
construction of each leaf. Section 5 shows the results
with a comparison of the computed leaves areas with
the manually acquired ground truth. Finally, the sec-
tion 6 draws conclusions on the use of this method
for sunflowers phenotyping and provides guidelines
for further works.
2 3D ACQUISITION ON THE
PLANT
Our first aim was to find a way to obtain the leaf area
of a whole sunflower plant with a non-destructive,
non-invasive and automated method. To do that, re-
cent studies trend towards the use of 3D data (Louarn
et al., 2012; Santos and Oliveira, 2012; Lou et al.,
2014; Jay et al., 2015). By now, what emerges from
those papers is that the 3D model of a plant could be
exploited for 3D plant phenotyping, i.e. for the es-
timation of the main parameter of our phenotyping
problem which is the leaf area.
The problem looks into which kind of sensors or
techniques could be used to acquire a 3D model of
a sunflower. Like presented in (Paulus et al., 2014),
since few years, a multitude of sensors and technolo-
gies have seen the day, like Time of Flight (ToF) cam-
era, laser scanner, depth camera, stereovision, etc.
Some of those sensors are expensive and do not re-
ally increase the performance for our kind of ap-
plication. Moreover, like presented in (Santos and
Oliveira, 2012) the use of low cost sensors like single
hand-held cameras combine with Structure from Mo-
tion (SfM) technique are well adapted for plant dig-
itizing. In this way, the work made in (Quan et al.,
2007) allows to obtain a 3D model from a single
hand-held camera based on the work of (Lhuillier and
Quan, 2005); it built a fully 3D point cloud for a poin-
settia plant but required the interaction of a user in or-
der to combine 3D and 2D informations with an eye to
segment leaves and to reconstruct them. So in order to
avoid user interaction, and with the recent progress in
Structure from Motion, the effort made to obtain a 3D
model of a sunflower was concentrated on the usage
of Bundler (Snavely et al., 2006), a Structure from
Motion system applied on unordered image collec-
tions. This system takes as input a set of images taken
around the plant and provides a sparse point cloud.
Then a dense point cloud is provided from the CMVS
(Furukawa et al., 2010) and PMVS2 (Furukawa and
Ponce, 2010) software, a multi-view stereo software
(MVS) that takes as input the spare point cloud pro-
duced by Bundler. Moreover, during the acquisition
process, a chessboard pattern is placed on the ground
in order to retrieve the scale of the cloud. Outliers are
manually removed with Meshlab and the cloud is then
scaled with CloudCompare.
An example of a 3D point cloud acquired on a sun-
flower with Bundler+CMVS/PMVS after the filtering
and scaling steps, is given in figure 2. As visible in
this figure, the 3D point cloud gives a faithful recon-
struction of the sunflower. The resolution could be
yet increased by taking advantage of other packages
like Micmac, used in (Jay et al., 2015) but less user
friendly. Another solution is to use commercial pack-
ages, like Agisoft PhotoScan, which allows to acquire
denser and more accurate 3D point clouds, but it in-
creases the overall cost of the workflow.
VISAPP 2017 - International Conference on Computer Vision Theory and Applications
460
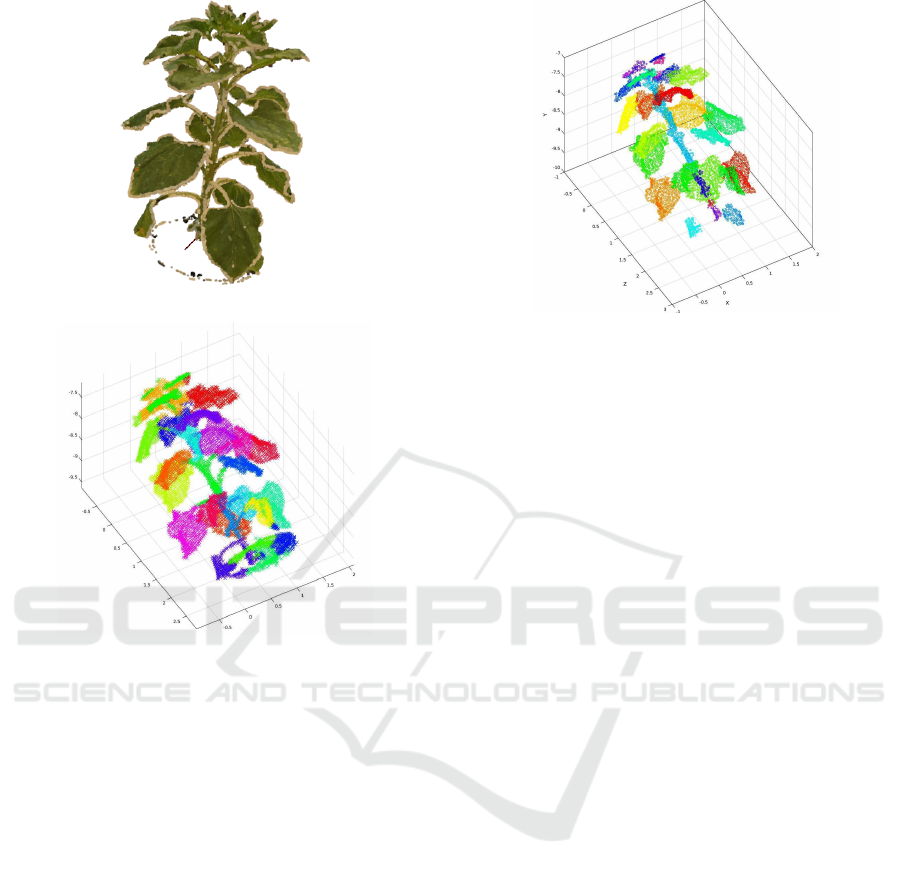
Figure 2: 3D point cloud given by Bundler+CMVS/PMVS.
Figure 3: Result of K-means algorithm with k=25.
3 RELATED WORK ON PLANT
SEGMENTATION
Once the 3D model of a plant is acquired, different pa-
rameters need to be extracted. To do that, it is impor-
tant to separate each part of a plant, namely, the main
stem, each leaf and the top. In (Santos et al., 2015), it
was shown that it is possible to separate the main stem
from leaves by using a spectral clustering algorithm
(Ng et al., 2002). The problem is that the number of
clusters must be given as input, what requires the in-
teraction of a user. In the same optic, the K-means
algorithm (J. A. Hartigan, 1979) was tested and the
result (see figure 3) was correct, except that the main
stem was segmented in several parts and leaves under
the top were merged with it.
With the aim to avoid user interaction, the DB-
SCAN algorithm (Ester et al., 1996), a density-based
algorithm was tested. This algorithm can achieve the
leaves segmentation without specifying the number of
clusters. In general, this algorithm meets the same
problem as K-means for the main stem and the top.
Furthermore, the parameters required by this algo-
Figure 4: Result of DBSCAN algorithm.
rithm are quite a bit difficult to tune for a multitude
of varieties. An example of result produced by this
algorithm is shown in figure 4.
Another approach consists in working with the
3D mesh built from the point cloud, like (Paproki
et al., 2012). To obtain such a mesh of a plant, they
use 3DSOM, a commercial 3D digitization software.
They first apply a coarse segmentation with a con-
strained region-growing algorithm which allows to
identity the main stem and leaves. Then, a tubular
shape fitting provides a precise stem segmentation,
the petioles, their inter-nodes and finally they proceed
to the leaf segmentation. While this method requires
a strong knowledge about the model of the plant; it
allows to realize a temporal analysis but requires to
build first a 3D mesh from the point cloud. Here, the
problem is that it is very difficult to obtain the 3D
mesh of the whole sunflower plant from the SfM re-
sults. We have evaluated several methods: a fast tri-
angulation of unordered point clouds (Marton et al.,
2009), poisson reconstruction (Kazhdan et al., 2006)
and ball pivoting (Bernardini et al., 1999), but none
of them gave exploitable results, probably due to the
low resolution of the point cloud.
An alternative approach to address the issue of 3D
plant segmentation was developed by (Paulus et al.,
2013). The main idea making profit of the model
of the plant, is that a plant is made up of leaves at-
tached to a main stem. So the key issue was to find
a way to pull apart those two clusters. Here the
method was based on the use of Point Feature His-
tograms (PFH) descriptor (Rusu et al., 2009), that en-
codes a point’s k-neighbourhood geometrical proper-
ties based on normal and curvature around the point.
This descriptor was adapted into Surface Feature his-
tograms (SFH) in order to make a better distinction
between leaves and stem. This new kind of descrip-
tor were used as features for a Support Vector Ma-
Model-based Segmentation of 3D Point Clouds for Phenotyping Sunflower Plants
461

Figure 5: Result of K-means on SFH with K=2.
chine (SVM) classification, i.e. a supervised method
that requires an a priori manual learning of the model.
So a user is needed to manually label the point cloud
and to give the machine what is a stem and what
is a leaf. Triggered by the motivation of obtaining
a fully automated method, (Wahabzada et al., 2015)
also used the Surface Feature Histogram but used a
K-means algorithm instead of SVM in order to seg-
ment those two clusters. This method works well
with grapevine, wheat and barley and was tested with
our sunflower point cloud. To achieve this, the im-
plementation of PFH available in the Point Cloud Li-
brary (PCL) (Rusu and Cousins, 2011) (a great tool
for 3D point cloud development) was adapted in or-
der to obtain SFH. The implementation works pretty
well but the specific shape of a sunflower leaf prevents
us from segmenting the leaves and the main stem as
presented in the figure 5. The problem is also due to
the 3D point cloud itself, indeed, the 3D reconstruc-
tion is incomplete and some leaves have 3D points
on each side whereas other ones have 3D points only
on one side. The SFH computation requires the esti-
mation of the normal and curvature on each 3D point
from its neighbourhood; disparities between normals
of neighbour points belonging to opposite sides of a
leaf, lead on a bad segmentation.
So the main challenge for plant phenotyping is the
segmentation process: like methods presented in sec-
tion 3 do not allow us to segment a sunflower, our
idea is to rely more on the knowledge of the sunflower
model, like in (Paproki et al., 2012). This model is di-
rectly exploited during the segmentation process; the
method is presented in the rest of this paper.
4 PROPOSED METHOD
The proposed method deals with the segmentation
of a 3D point cloud acquired on a sunflower with
Bundler+CMVS/PMVS, as explained in section 2. A
sunflower is composed of a main stem, a top, leaves
and petioles. We assumed that the smaller leaves (un-
der 6cm of length) did not contribute strongly to light
interception and plant functioning and were not con-
sidered in the phenotyping method.
The proposed model-based segmentation method
aims mainly to obtain plant leaf area in an automatic
way; each leaf must be individually extracted and re-
constructed, so that its area can be computed. To
achieve the leaf extraction, we have shown that the
known segmentation method gave results that were
not accurate enough for our application case. In order
to simplify the problem, we first start by looking for
the stem and we remove it from the cloud. It allows
us to perform the leaf segmentation only based on a
geometrical constraint. Then, we can find the petioles
insertions of each leaf and used it to label the leaves
according to the known botanical sunflower model.
Finally, the leaves are reconstructed by NURBS fit-
ting and their area are computed from the associated
triangular mesh.
All the implementation was done in C++ with PCL.
4.1 Main Stem Extraction
Our first idea was to localize the main stem by a cylin-
der fitting and to remove all points located along this
cylinder. The consequence of this is the filtering of all
points belonging to the main stem, to the top, and to
all leaves (and petioles) located above the top, which
are the leaves that are under 6cm of width. To do that,
we apply the procedure given in PCL (Rusu, 2009) in
order to estimate parameters of a cylinder fitted to the
main stem, i.e. the axis and the radius. We next lo-
cate all the points included in this cylinder and prop-
agate them from the bottom of the 3D point cloud to
the top. This method works well with straight stem
but met some difficulties with curved stem, hence our
more tricky method for the main stem extraction.
The second idea, we considered a ring with an
a priori known radius (based on a botanical sun-
flower model) that starts from the bottom of the
plant and climbs along the stem by using both a
neighbourhood constraint as well as a normal con-
straint. Indeed, each point of the cloud produced by
Bundler+CMVS/PMVS are defined by:
- Coordinate (X,Y,Z)
- Colour (R,G,B)
- Normal direction (X,Y,Z)
The normal direction of the points contained in the
ring are used to compute the direction of the ring
(along the stem), then, each point in the neighbour-
hood of this ring is tested and if its normal direction is
perpendicular (with a certain flexibility) to the stem it
VISAPP 2017 - International Conference on Computer Vision Theory and Applications
462
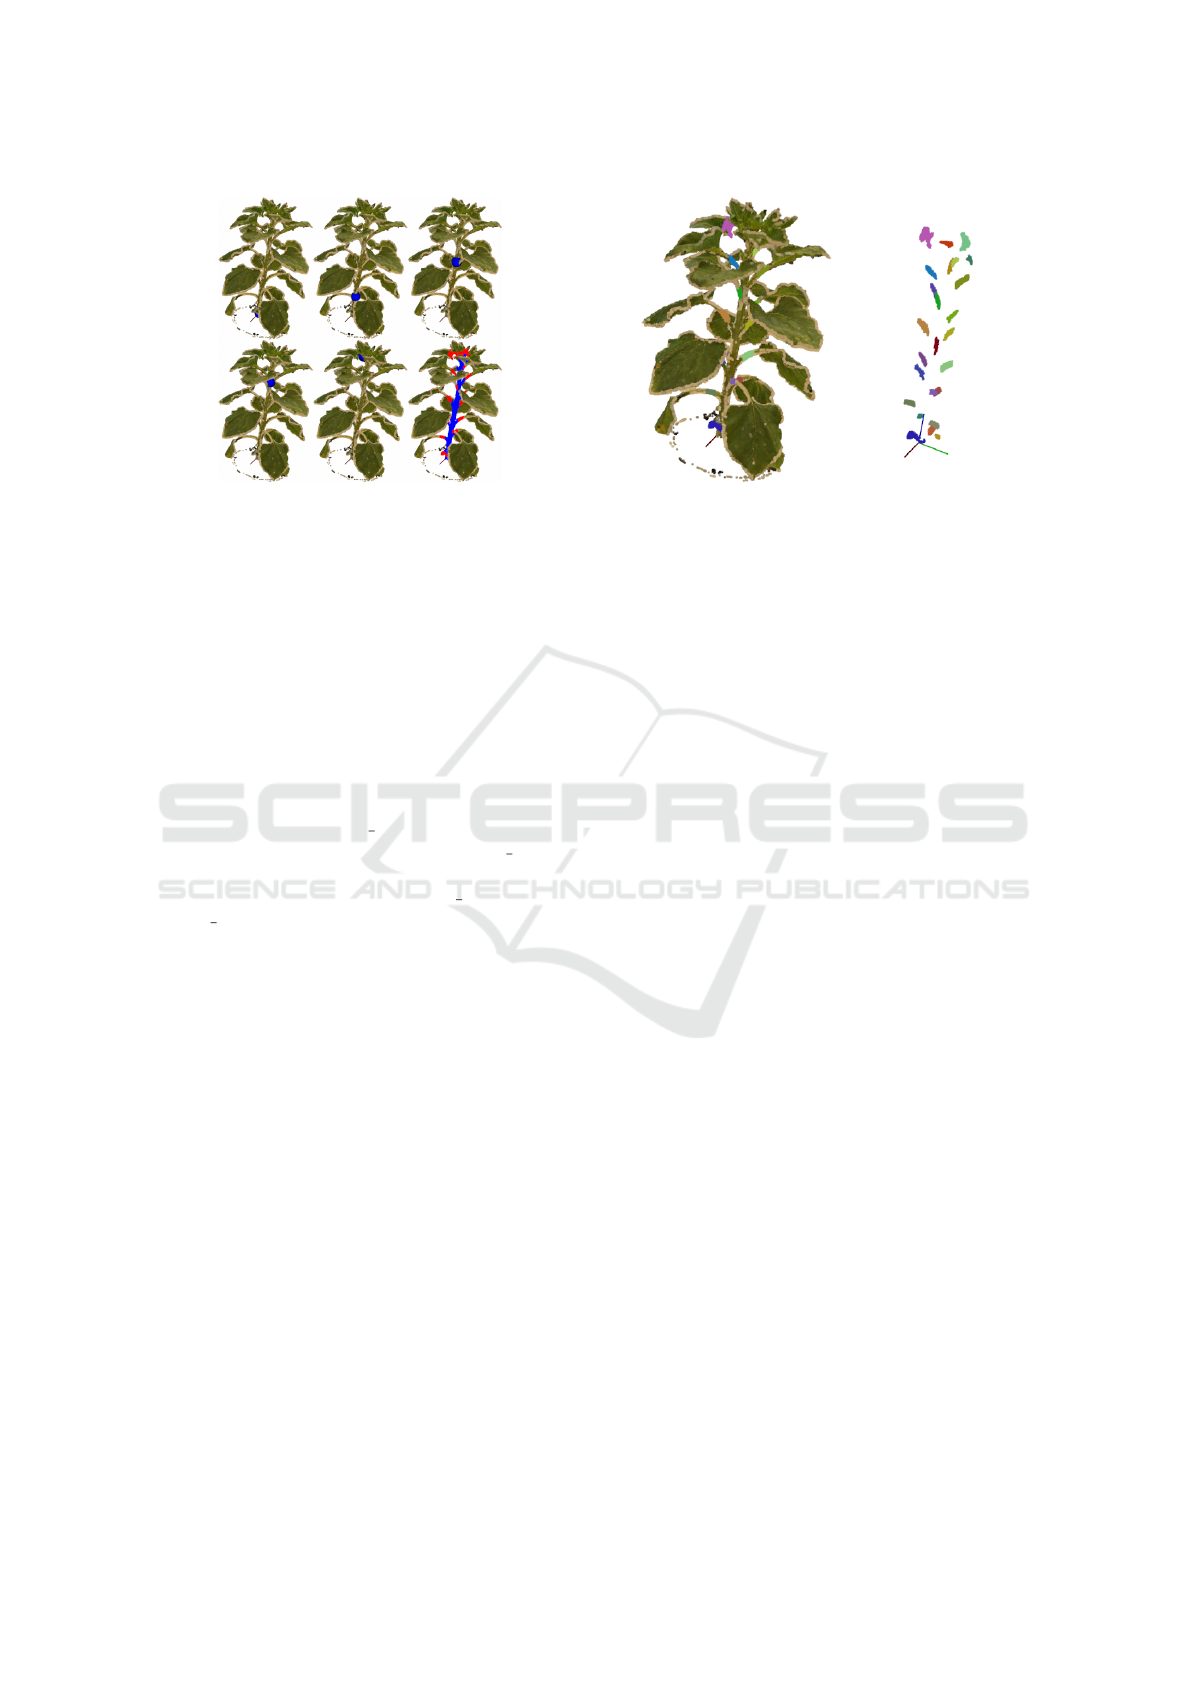
Figure 6: Example of the ring climbing along the stem.
is added to the ring while the first ones are removed.
The fusion of all rings climbing along the stem, de-
fines a generalized cylinder, i.e. a ring with a fixed
radius, moving along a curved axis.
4.2 Petioles Insertions on the Stem
The next step is the localisation of the petioles inser-
tion points on the stem. Here the idea was to extend
the radius of the ring that models the stem at a given
heigth, defining a cylindrical crown, i.e. two general-
ized cylinders of same axis but with different radius.
So a radius (called petioles radius) is selected larger
than the one used for the ring (called stem radius).
While the ring is climbing along the stem, the points
located in the crown (between the stem radius and the
petioles radius) are segmented as petioles insertions
while the ones located in the ring are segmented as
stem. In the figure 6, we can see in blue, the ring
climbing along the stem and, bottom right, the fusion
of all rings. We can also observe that some petioles
insertions are labelled as stem; but this is not a prob-
lem because we only want to be able to remove the
stem in order to exploit a geometrical constraint for
the leaf extraction as explained hereafter.
4.3 Petioles Insertions Clustering and
Labelling
We used the petioles insertions to segment and label
each leaf individually. First a cloud only composed
of the petioles insertions is extracted, and analysed
by an Euclidean Cluster Extraction (ECE), a cluster-
ing method relying on a geometrical constraint as ex-
plained in (Rusu, 2009). A result is given in figure
7. Once we get these clusters, the botanical sunflower
model is used to label them. Labels affected to each
leaf rely both on their insertion order along the stem
and their phyllotaxic angles, i.e. angles between two
Figure 7: Result of ECE on the petioles insertions cloud.
successive leaves, defining the arrangement of leaves
around a plant stem. In sunflower, the first leaves
have opposite orientations while the remaining con-
secutive leaves have relative orientations around 137
◦
as described in (Rey et al., 2008). Table 1 presents
the computed phyllotaxic angles and shows that the
botanical model is well respected except for the leaves
11, 12 and 13 where the angles between the leaves
11 & 12 and 13 & 14 are around 90
◦
. Neverthe-
less, we can see that the height insertion of the leaves
12 and 13 are very close (abs(0.346902-0.35354) =
0,006638m ≤ 1cm). If we switch the position of these
two leaves and compute the new phyllotaxic angles
we can observe that they better fit the model as shown
in table 1. From this result, we have designed our
method to only check the phyllotaxic angle between
two leaves only if they are close and to correct the
labeling only if it does not respect the model.
4.4 Leaf Segmentation
The next step consists in segmenting each leaf in-
dividually, starting from the 3D point cloud without
stem. From that, we can perform a segmentation
based on a geometrical constraint. Here, we also ap-
ply the Euclidean Cluster Extraction and the result of
which is shown in figure 8. In this figure, it is pos-
sible to see that most of the leaves have been well
segmented, except for a few of them on the top of the
sunflower (however less than 6cm of length) and the
label can be assigned from their petioles insertions.
After that, and with the aim of compute only the leaf
area, we have to separate the leaves from their peti-
oles. Here, we also used a ring moving along the peti-
ole but now, starting from the petiole insertion on the
stem and stopping when it reaches the leaf as shown
in figure 9.
Model-based Segmentation of 3D Point Clouds for Phenotyping Sunflower Plants
463

Table 1: Phyllotaxic angles without label correction.
Leaves Height Phyllotaxic
label insertion (m) angle (
◦
)
1-2 (0.0169748-0.0301619) 174.024
2-3 (0.0301619-0.0560179) 109.427
3-4 (0.0560179-0.0847796) 148.132
4-5 (0.0847796-0.126075) 131.256
5-6 (0.126075-0.155893) 137.634
6-7 (0.155893-0.190812) 125.147
7-8 (0.190812-0.205754) 153.823
8-9 (0.205754-0.249005) 117.355
9-10 (0.249005-0.268278) 146.015
10-11 (0.268278-0.288003) 141.211
11-12 (0.288003-0.346902) 87.3252
12-13 ((0.346902-0.35354)) 133.72
13-14 (0.35354-0.392951) 95.4497
14-15 (0.392951-0.439372) 158.087
15-16 (0.439372-0.44903) 118.78
16-17 (0.44903-0.49663) 133.166
17-18 (0.49663-0.514729) 147.763
18-19 (0.514729-0.525278) 126.322
19-20 (0.525278-0.557437) 145.613
Table 2: Phyllotaxic angles after label correction.
Leaves Height Phyllotaxic
label insertion (m) angle (
◦
)
... ...
from 1 to 11 idem idem
... ...
11-13 (0.288003-0.35354) 138.955
13-12 (0.35354-0.346902) 133.72
12-14 (0.346902-0.392951) 130.83
... ...
from 14 to 20 idem idem
... ...
4.5 Leaf Reconstruction
Finally for every segmented and labeled leaf, we have
to compute its area. To achieve this, we need a sur-
facic representation. As presented in (Santos et al.,
2015), we can use the NURBS fitting (Non Uniform
Rational B-Splines) (Piegl and Tiller, 1997). The im-
plementation and the procedure of NURBS fitting is
described in (Morwald, 2012) and is available in PCL.
These NURBS are then triangulated and the surface
of a leaf can be obtained by summing the areas of
each triangle that composes the NURBS. The area of
a triangle is obtained with the Heron’s formula, which
consists in computing a triangle area by knowing the
coordinates of its 3 vertices. Moreover, these NURBS
can be more or less refined: an example of NURBS
fitting applied on a single leaf with different levels of
Figure 8: Result of leaf clustering.
Figure 9: Example of ring reaching a leaf.
(a) 3D point cloud (b) Low refine-
ment
(c) High refine-
ment
Figure 10: Comparison of NURBS fitting on a point cloud.
refinement is given in figure 10.
In the next section, the results of the segmentation
will be commented, and the leaf area will be evalu-
ated through a comparison with a manually obtained
ground truth.
5 RESULTS AND VALIDATION
We have performed tests on a set of 10 plants from
6 different varieties to evaluate our method accuracy,
repeatability and sensitivity to different sunflower va-
riety. We performed an acquisition on each plant be-
fore cutting all leaves to estimate their area using a
planimeter (a classical destructive phenotyping tool),
to use this data as ground truth.
5.1 Acquisition
Evaluation experiments were made on isolated plant
with images acquired under controlled illumination
VISAPP 2017 - International Conference on Computer Vision Theory and Applications
464

conditions. It showed that the acquisition method is
well adapted for 3D sunflower reconstruction and can
be used for 3D plant phenotyping. This method is
time-consuming due to the number of required pic-
tures and to the effort required to isolate the plant.
This time can be reduced by using a mobile turntable,
which could provide a medium-throughput phenotyp-
ing protocol.
5.2 Model-based Segmentation
The removal of the main stem in the 3D point cloud
allows us to use the Euclidean Cluster Extraction to
segment each leaf individually except for a few of
them located under the top. This is due to:
• the resolution of the point cloud
• the proximity/contact between leaves on the top
The tests show that 83% of leaves available in the
point cloud and longer than 6cm have been well seg-
mented, as well as the use of the botanical sunflower
model leads to a correct leaves labeling.
5.3 Leaf Reconstruction
After performing the tests, we can say that the
NURBS fitting is well adapted for the reconstruction
of flat leaves like the sunflower’s leaves. Moreover,
we compared the leaf area with the ground truth ac-
cording to the refinement: results are given in table 3.
This comparison shows that (1) the computed area is
larger than the measured one, and (2) it is not useful to
refine interpolation of the NURBS. The main reason
is that the ground truth is obtained from a planime-
ter flattened the leaves and the more we refine the
NURBS the more the NURBS fit the real leaf shape.
If we do not increase the refinement, we obtain a flat
shape of a leaf which is closer (in term of computed
area) to a leaf passed through a planimeter.
Table 3: Comparison of the leaf area against the ground
truth, with various NURBS refinement.
Number of Leaf
refinement area
iteration
1 +10%
2 +14.5%
3 +18.4%
4 +22.2%
6 CONCLUSION AND FURTHER
WORKS
This study presents a model-based segmentation of a
3D point cloud for sunflower phenotyping, with first
applications for automated leaf labeling and individ-
ual leaf area estimation. First, a 3D point cloud of
an isolated sunflower plant is obtained from an avail-
able Structure from Motion method, which could be
adapted in order to make the procedure fully auto-
matic. Then the main stem is extracted as well as the
petioles insertions, using an original approach pro-
posed to extract generalized cylinders. After that,
Euclidean Cluster Extraction is applied, first on the
petioles for labeling them and then on the rest of the
point cloud to segment the leaves. This segmentation
gives good results as well as the leaf reconstruction
by NURBS fitting, but it shows also some limitations
due to the acquisition process. However, the recon-
struction is accurate enough to allow ecophysiologi-
cal studies based on this method.
Aiming at fully automatize the acquisition proce-
dure and to better segment the leaves, further investi-
gations will be made in order to build a turntable that
could be installed on a mobile robot. An alternative to
Structure from Motion could be the Microsoft Kinect
V2 which produces directly a 3D point cloud. As it
was presented in (Ch
´
en
´
e et al., 2012; Xia et al., 2015),
the use of the Microsoft Kinect V1 allows to pro-
ceed plant phenotyping. The problem is that only one
Kinect was used to perform top views’ acquisitions; it
does not allow the system to obtain a full model of a
plant. Using at least 3 or 4 Kinect acquiring images si-
multaneously from different view points might allow
to obtain a full 3D model of a sunflower, eventually
by relying on the Microsoft Kinect Fusion software
(Izadi et al., 2011). The resolution and the density
of the outcome point cloud should be better than the
one obtained by SfM with Bunlder+CMVS/PMVS
but mostly the acquisition should be faster.
In addition, a temporal analysis will be performed
in order to monitor the plant growth of the leaf area of
a sunflower; it will determine if the labeling method
could allow us to associate leaves extracted from
the same plant at different periods and to perform a
growth tracking on the leaves.
ACKNOWLEDGEMENTS
The authors would like to thank C
´
eline Colom-
bet, Philippe Debaeke, Nicolas Langlade and Pierre
Casadebaig from INRA, Toulouse, for their participa-
tion to this work, through a joint project about high
Model-based Segmentation of 3D Point Clouds for Phenotyping Sunflower Plants
465

throughput phenotyping of sunflowers and the French
National Research Agency (ANR) through the project
SUNRISE.
REFERENCES
Bernardini, F., Mittleman, J., Rushmeier, H., Silva, C., and
Taubin, G. (1999). The ball-pivoting algorithm for
surface reconstruction. IEEE Transactions on Visual-
ization and Computer Graphics, 5(4):349–359.
Ch
´
en
´
e, Y., Rousseau, D., Lucidarme, P., Bertheloot, J.,
Caffier, V., Morel, P.,
´
Etienne Belin, and Chapeau-
Blondeau, F. (2012). On the use of depth camera for
3d phenotyping of entire plants. Computers and Elec-
tronics in Agriculture, 82:122 – 127.
Dhondt, S., Wuyts, N., and Inz
´
e, D. (2013). Cell to whole-
plant phenotyping: the best is yet to come. Trends in
Plant Science, 18(8):428 – 439.
Ester, M., Kriegel, H.-P., Sander, J., and Xu, X. (1996).
A density-based algorithm for discovering clusters in
large spatial databases with noise. AAAI Press.
Fiorani, F. and Schurr, U. (2013). Future Scenarios for Plant
Phenotyping. Annual review of plant biology, 64:267
– 291.
Furukawa, Y., Curless, B., Seitz, S. M., and Szeliski, R.
(2010). Towards internet-scale multi-view stereo. In
CVPR.
Furukawa, Y. and Ponce, J. (2010). Accurate, dense, and
robust multi-view stereopsis. IEEE Trans. on Pattern
Analysis and Machine Intelligence, 32(8):1362–1376.
Izadi, S., Kim, D., Hilliges, O., Molyneaux, D., Newcombe,
R., Kohli, P., Shotton, J., Hodges, S., Freeman, D.,
Davison, A., and Fitzgibbon, A. (2011). Kinectfusion:
Real-time 3d reconstruction and interaction using a
moving depth camera. In ACM Symposium on User
Interface Software and Technology, UIST ’11, pages
559–568, New York, NY, USA. ACM.
J. A. Hartigan, M. A. W. (1979). Algorithm as 136:
A k-means clustering algorithm. Journal of the
Royal Statistical Society. Series C (Applied Statistics),
28(1):100–108.
Jay, S., Rabatel, G., Hadoux, X., Moura, D., and Gor-
retta, N. (2015). In-field crop row phenotyping from
3d modeling performed using structure from motion.
Computers and Electronics in Agriculture, 110:70 –
77.
Kazhdan, M., Bolitho, M., and Hoppe, H. (2006). Poisson
Surface Reconstruction. In Sheffer, A. and Polthier,
K., editors, Symposium on Geometry Processing. The
Eurographics Association.
Lhuillier, M. and Quan, L. (2005). A Quasi-Dense Ap-
proach to Surface Reconstruction from Uncalibrated
Iages. IEEE Transactions on Pattern Analysis and
Machine Intelligence, 27(3):418–433.
Lou, L., Liu, Y., Han, J., and Doonan, J. H. (2014). Ac-
curate Multi-View Stereo 3D Reconstruction for Cost-
Effective Plant Phenotyping, pages 349–356. Springer
International Publishing, Cham.
Louarn, G., Carr
´
e, S., Boudon, F., Eprinchard, A., and
Combes, D. (2012). Characterization of whole plant
leaf area properties using laser scanner point clouds.
In Fourth International Symposium on Plant Growth
Modeling, Simulation, Visualization and Applications,
Shanghai, China.
Marton, Z. C., Rusu, R. B., and Beetz, M. (2009). On
Fast Surface Reconstruction Methods for Large and
Noisy Datasets. In Proceedings of the IEEE In-
ternational Conference on Robotics and Automation
(ICRA), Kobe, Japan.
Morwald, T. (2012). Fitting trimmed b-splines to unordered
point clouds.
Ng, A. Y., Jordan, M. I., and Weiss, Y. (2002). On spectral
clustering: Analysis and an algorithm. In Dietterich,
T. G., Becker, S., and Ghahramani, Z., editors, Ad-
vances in Neural Information Processing Systems 14,
pages 849–856. MIT Press.
Paproki, A., Sirault, X., Berry, S., Furbank, R., and Fripp,
J. (2012). A novel mesh processing based technique
for 3d plant analysis. BMC Plant Biology.
Paulus, S., Behmann, J., Mahlein, A.-K., Plmer, L., and
Kuhlmann, H. (2014). Low-cost 3d systems: Suitable
tools for plant phenotyping. Sensors, 14(2):3001.
Paulus, S., Dupuis, J., Mahlein, A.-K., and Kuhlmann, H.
(2013). Surface feature based classification of plant
organs from 3d laserscanned point clouds for plant
phenotyping. BMC Bioinformatics, 14(1):1–12.
Piegl, L. and Tiller, W. (1997). The NURBS Book (2Nd
Ed.). Springer-Verlag New York, Inc., New York, NY,
USA.
Quan, L., Tan, P., Zeng, G., Yuan, L., Wang, J., and
Kang, S. B. (2007). Image-based plant modeling.
ACM SIGGRAPH and ACM Transactions on Graph-
ics, 25(3):772778.
Rey, H., Dauzat, J., Chenu, K., Barczi, J.-F., Dosio, G.
A. A., and Lecoeur, J. (2008). Using a 3-d virtual
sunflower to simulate light capture at organ, plant and
plot levels: Contribution of organ interception, impact
of heliotropism and analysis of genotypic differences.
Ann Bot, 101(8):1139–1151. 18218705[pmid].
Rusu, R. B. (2009). Semantic 3D Object Maps for Ev-
eryday Manipulation in Human Living Environments.
PhD thesis, Computer Science department, Technis-
che Universitaet Muenchen, Germany.
Rusu, R. B., Blodow, N., and Beetz, M. (2009). Fast point
feature histograms (fpfh) for 3d registration. In Pro-
ceedings of the 2009 IEEE International Conference
on Robotics and Automation, ICRA’09, pages 1848–
1853, Piscataway, NJ, USA. IEEE Press.
Rusu, R. B. and Cousins, S. (2011). 3d is here: Point cloud
library (pcl). In International Conference on Robotics
and Automation, Shanghai, China.
Santos, T. T., Koenigkan, L. V., Barbedo, J. G. A., and Ro-
drigues, G. C. (2015). Computer Vision - ECCV 2014
Workshops: Zurich, Switzerland, chapter 3D Plant
Modeling: Localization, Mapping and Segmentation
for Plant Phenotyping Using a Single Hand-held Cam-
era, pages 247–263. Springer.
VISAPP 2017 - International Conference on Computer Vision Theory and Applications
466

Santos, T. T. and Oliveira, A. A. (2012). Image-based 3D
digitizing for plant architecture analysis and pheno-
typing. In Sa
´
ude, A. V. and Guimar
˜
aes, S. J. F., edi-
tors, Workshop on Industry Applications (WGARI) in
SIBGRAPI 2012 (XXV Conference on Graphics, Pat-
terns and Images), Ouro Preto, MG, Brazil.
Snavely, N., Seitz, S. M., and Szeliski, R. (2006). Photo
tourism: Exploring photo collections in 3d. ACM
Trans. Graph., 25(3):835–846.
Wahabzada, M., Paulus, S., Kersting, K., and Mahlein,
A.-K. (2015). Automated interpretation of 3d laser-
scanned point clouds for plant organ segmentation.
BMC Bioinformatics, 16(1):1–11.
Xia, C., Wang, L., Chung, B.-K., and Lee, J.-M. (2015). In
situ 3d segmentation of individual plant leaves using
a rgb-d camera for agricultural automation. Sensors,
15(8):20463.
Model-based Segmentation of 3D Point Clouds for Phenotyping Sunflower Plants
467
