
An Artificial Stock Market with Interactions Network and Mimetic
Agents
Sadek Benhammada
1
, Frédéric Amblard
2
and Salim Chikhi
1
1
MISC Laboratory, University of Constantine 2, Constantine, Algeria
2
UMR 5505 CNRS-IRIT, Université Toulouse 1 Capitole, Toulouse, France
Keywords: Agent-based Models, Computational Economics, Artificial Stock Markets, Social Networks, Mimetism.
Abstract: Agent-based artificial stock markets attracted much attention over the last years, and many models have
been proposed. However, among them, few models take into account the social interactions and mimicking
behaviour of traders, while the economic literature describes investors on financial markets as influenced by
decisions of their peers and explains that this mimicking behaviour has a decisive impact on price dynamics
and market stability. In this paper we propose a continuous double auction model of financial market,
populated by heterogeneous traders who interact through a social network of influence. Traders use different
investment strategies, namely: fundamentalists who make a decisions based on the fundamental value of
assets; hybrids who are initially fundamentalists, but switch to a speculative strategy when they detect an
uptrend in prices; noise traders who don’t have sufficient information to take rational decisions, and finally
mimetic traders who imitate the decisions of their mentors on the interactions network. An experimental
design is performed to show the feasibility and utility of the proposed model.
1 INTRODUCTION
In financial market, traders can be influenced by
decisions of their peers. This phenomenon is called
herd (or mimetic) behaviour, and attracted much
attention for several decades. The reason for this
interest is that mimicking behaviour has a decisive
impact on price dynamics, and it might offer an
explanation of excessive volatility and creation of
bubbles (e.g. (Manahov, 2013) and (Chang, 2014)).
In the literature we distinguish three main
reasons for mimicking behaviour to occur in
financial markets, i.e., when a decision of an
investor can be influenced by observing the actions
of other investors: (1) incomplete information, (2)
concern for reputation and (3) compensation
structures (Bikhchandani, 2000).
The information based models, such as in
(Banerjee, 1992) and (Scharfstein, 1990 assume that
individuals have private (but imperfect) information
about the course of action, they can also observe
each other’s actions but not the private information
or signals that each player receives. Investors may
consider optimal to follow the behaviour of the
preceding individual disregarding his own
information. Other models such as in (Chang, 2014),
are based on herding caused by compensation. In
fact, performance evaluation of a fund manager that
invests for his employers is often based on relative
(not absolute) performance, i.e., his compensation
increases with his own performance, and decreases
if he produces a performance below than other fund
managers. This leads him to conform his investment
decisions to those of other professionals, more than
he would if he was acting on his own account. Also,
reputational concerns of fund managers can also
provide a motivation to be mimetic. Indeed, when
managers take the same decisions, even if the result
of the investment is poor, observers may conclude
that there is a high probability that managers are of
good quality and that the bad result is accidental.
Thus, many proposed models are based on
reputation concerns (Scharfstein, 1990).
However, it is difficult to test those theoretical
models directly (Manahov, 2013), because it is
difficult to access at a time t to private information
of traders, their investment strategies and
interactions among them. Therefore, it is difficult to
determine whether traders make similar decisions as
they neglect their own information and imitate
others, or because they have access to the same
information they use to make their decisions.
390
Benhammada S., Amblard F. and Chikhi S.
An Artificial Stock Market with Interactions Network and Mimetic Agents.
DOI: 10.5220/0006118803900397
In Proceedings of the 9th International Conference on Agents and Artificial Intelligence (ICAART 2017), pages 390-397
ISBN: 978-989-758-220-2
Copyright
c
2017 by SCITEPRESS – Science and Technology Publications, Lda. All rights reserved

To overcome this problem, we can use artificial
stock markets (ASM) which are computer models of
real stock markets; they are based on modelling
market actors by agents, and supposed have the
essential properties of real financial markets with the
aim of reproducing analyse or understand the
dynamics of stock markets, and this by computing
experiences (Derveeuw, 2007). In literature, there is
a little work that uses ASMs to study the
phenomenon of mimicking behaviour on financial
markets. In (Manahov, 2013), we propose the study
of herd behaviour through the use of an artificial
financial market, where the market is populated by
agents who are with learning behaviour represented
by the genetic programming algorithm. Therefore, as
in real markets, authors use statistical measures of
price series generated by the experiments to quantify
mimicking behaviour on the market. This limits the
ability of the model to study the phenomenon.
In this paper we propose a continuous double
auction ASM with heterogeneous traders. The
proposed ASM is populated by heterogeneous
traders which are bound by interaction network.
Traders use different investment strategies, among
them, the mimetic traders which are able to imitate
the decisions of their successors in the interactions
network. To test the model we perform a series of
experiments, and we analyse their results.
This paper is organized as follows. Section 2
presents a description of the proposed model, in
section 3 we perform a series of experiments and we
discuss the results. Finally, Section 4 concludes and
outlines open research directions.
2 STRUCTURE OF THE ASM
In this section we introduce a continuous double
auction model with heterogeneous traders. The
proposed ASM has four main components (see
Figure 1): (i) Market which allows buyers and
sellers to exchange assets; (ii) Traders who exchange
assets in the market; (iii) External-world that is the
source of information used by traders to estimate the
fundamental value of assets; and (iv) social network
that allows traders to interact and learn about the
decisions of their predecessors.
2.1 The Market
The role of Market is to receive and process orders
placed by traders. An order submitted by one trader
is described by a direction (buy or sell), a quantity of
assets to buy or sell, and a quoted price. The quoted
price of a buy (sell) order is the maximum
(minimum) limit price above (under) which the
order should not be executed. Unexecuted orders are
placed in the order book. The order book is
described by two lists, the list of buy orders, and the
list of sell orders. The list of buy orders is arranged
in decreasing order of prices, while the list of sell
orders is arranged in increasing order. If a submitted
order finds a matching order of the opposite side in
the book, a trade is generated. When a trade is
generated, the Market deletes satisfied orders from
the order book, an orders can be satisfied completely
or partially (depending on quantity), if order is
satisfied partially, the unsatisfied order part is
replaced in the book.
Figure 1: The structure of an artificial stock market.
2.2 External World
The fundamental value of the asset is the expected
discounted sum of its future dividends. It represents
the true value of asset. To estimate it, analysts use
information of external world, such as balance sheet
of company and overall state of the economy.
The role of External world is to generate the
signal representing the fundamental value of asset
that will be received by traders with an error margin.
We will use two jump processes to simulate
fundamental values. To generate fundamental value
without trend, we use the following process:
( + 1)= () +
(1)
Where
∽(0,) is a white noise from a
normal distribution with mean 0 and variance
= 1.
To have an uptrend of prices over a period, and
stimulate speculative behaviour of hybrid agents
(see section 3.4), we will generate a fundamental
value with increasing trend during the first
transactions, and without trend (equation 1) during
the rest of simulation. To generate a fundamental
An Artificial Stock Market with Interactions Network and Mimetic Agents
391

value with increasing trend we use the following
process:
(
+ 1
)
=
(
)
++
(2)
>0 is a positive constant.
2.3 Interactions Network
To study the mimicking behaviour, we need to
model the social network of interactions of traders in
the market, through which, they can access to
actions of each other, and eventually imitate them.
Thus, the interactions network is represented by
a directed graph, where the nodes represent the
traders, while edges represent the interactions among
them. The interactions are assumed unidirectional
(i.e., agent j-th influences agent i-th, but the reverse
isn't necessarily correct). Interactions are
characterized by a weight
,
, assumed a positive
real number, and it represents the degree of
confidence of trader i, in the decisions of trader j.
To produce a realistic social network, we use the
“small-world” model of Watts-and-Strogatz (Watts,
1998). Creating a Watts-Strogatz network is carried
out at two steps:
(1) Create a ring network with N nodes; each
node is connected to the same number k of nearest
neighbours in the two sides.
(2) Remove each edge with uniform probability
p and rewire it to one of nodes that are chosen
uniformly at random.
2.4 Traders
The market is populated by traders who exchange
(buy and sell) assets. According to the used strategy
to make decision, we use different types of traders:
2.4.1 Noise Traders
Noise traders represent traders who don’t have
sufficient access to information and/ or don’t have
sufficient competence to use information in decision
making. So, he makes a decision to submit a buy
order, a sell order or wait with corresponding
probabilities
,
and
.
2.4.2 Fundamentalist Traders
Fundamentalists estimate the fundamental value of
the asset with a small error margin, and use it to
make decisions. Thus, to make a decision, a
fundamental trader i estimates a fundamental value
() and compares it with current price in
Market(). If
(
)
<
(), trader i considers
that assets are undervalued, and so decides to submit
a buy order. If
(
)
>
(), he consider that asset
is overestimated and he place a sell order.
2.4.3 Hybrid Traders
Hybrid traders are initially fundamentalists, but can
switch to the speculative behaviour when they detect
a sufficient uptrend in prices history and sufficient
liquidity.
A hybrid trader i stand initially in fundamental
strategy. It has a desire D
(t) to become speculative,
initialized by InitD
. It continuously observes prices
trend using moving average (equation 3) (Martinez,
2009) and market liquidity with Effective Spread
(ES
(
t
)
) (Bessembinder, 2009) (equation 4).
(
,
)
=
(
)
∑
()
∑
()
(3)
t is the current time and L is a period length.
(
)
=
(
)
(
)
(
)
(4)
(
)
is the last price of asset at time t,
(
)
is
the estimated fundamental value by trader i at time t.
Once it observes a sufficient uptrend
(
(
,
)
>ℎ
) associated with sufficient
liquidity (
(
)
<ℎ
), it can switch to technical
behaviour with a probability proportional to its
desire
(). If it persists in fundamentalist
behavior, it increases his desire of speculation
( + 1) as follows:
(
+1
)
=
(
)
+
(5)
When trader i adopts technical (speculative)
strategy, he continuously observes prices trend and
market liquidity. If price tends to decline
(
(
,
)
<−ℎ
) or market liquidity is
insufficient (
(
)
≥ℎ
), it return to the
fundamental strategy.
2.4.4 Mimetic Traders
Mimetic traders represent traders who consider that
their own information is incomplete to making
decision, and take their decision by imitating others.
A mimetic trader i can access to actions of its
successors in the interaction network (see section
3.3), thus, to make a decision, mimetic trader i
imitates the last decision of one of its successor’s j.
Imitated successor j is chosen using roulette-wheel
selection, i.e., proportionally to the weights of
interactions
,
which represents the degree of
confidence of trader i in decisions of his successor j
ICAART 2017 - 9th International Conference on Agents and Artificial Intelligence
392

(see Figure 2.). Mimetic trader has a learning
mechanism for updating weights of its interactions
(see Figure 3); the aim is to foster imitation of
predecessors who are able to make correct decisions
based on the analysis of the price trend. Thus, each
mimetic trader keeps the list
of
imitated decisions, to be able to evaluate them later,
and thus updates the weights of its interactions with
the imitated successors according to this evaluation.
Figure 2: Make a decision algorithm of mimetic trader.
An imitated decision can be described as a triplet
=(
,
,
) , while:
is the type of
imitated decision (buy or sell),
the time when
decision is imitated, and
the imitated
successor. To update the weights of interactions with
imitated successors at time t, a mimetic trader i filter
a list of evaluable decisions
(). An
imitated decision is considered evaluable if the time
since its imitation is greater than or equal to a
duration Δ
:
(
)
=
∈
(
)|
−
≥Δ
}
Mimetic trader i retains for each interaction with
trader j a value
,
that we call absolute weight;
,
is used to calculate the interaction weight
W
,
with a sigmoid function as follows:
,
=
∗
,
(6)
a, r are positive real.
Sigmoid function aims to obtain a weight with a
quite slow slope in the beginning, followed by
acceleration, and finally slows down and approaches
(
).
Figure 3: Algorithm for updating interactions weights.
3 EXPERIMENTS & DISCUSSION
We designed a model to study mimicking behaviour
in stock markets. As mentioned in the introduction,
herd behaviour has an important effect on asset
prices in stock markets; it is considered as the first
explanation of the phenomenon of speculative
bubble formation ((Orléan, 1989) and (Chang,
2014)). However, does the model give realistic
prices dynamics? Also, are the mimetic traders
designed able to cause mimetic contagion, and
reproduce a realistic speculative bubble such as
indicated in theoretical assumptions?
3.1 Metrics and Tools
To test the model, we will perform experiments and
analyse the output price series, and the evolution of
the state of traders and interactions network. In order
to verify whether prices dynamics of our model are
realists, we analyse statistic properties (mean,
median, minimum, maximum, kurtosis and
skewness) and we compare it with them of real price
series. To see the formation of realistic bubbles, we
observe measures introduced in experimental
economics literature to analyse bubbles magnitude,
which are the following:
(1) Relative Deviation (RD), is the average deviation
of prices from fundamental value relative to the
average fundamental value (Stöckl, 2010).
=
∑
(
)
()
(7)
Algorithm Make a decision
Parameters:
: The last decision tacked by trader i.
: The last decision tacked by trader j.
,
: Weight of interaction between mimic trader i
and imitated successor.
: Strategy of trader i.
: Strategy of trader j.
Output:
Decision (buy, sell)
Select one successor j of trader i using roulette-wheel,
proportionate to the weights of interactions
,
.
=
=
if (
=)
return buy order
else (
=)
return sell order
end i
f
Algorithm Update Interactions Weights
Parameters:
(
)
: List of evaluable decisions
,
: Weight of interaction with imitated
,
: Absolut weight of interaction between
mimic trader and imitated successor
: Rate used to update
,
.
: Threshold used to determine if price has significantly
increased or decreased.
←(
(
)
−
(
−
)
)/
(
−
)
for each ∈
(
)
:
if (
=)
if ( > ):
,
←
,
+
|
|
;
else :
,
←
,
−
|
|
;
else /* (
=)*/
if ( < −):
,
←
,
+
|
|
;
else:
,
←
,
−
|
|
;
,
=
1+
∗
,
delete decision from
(
)
end for
An Artificial Stock Market with Interactions Network and Mimetic Agents
393

(2) Boom Duration, which equals the greatest
number of consecutive periods when prices
increase relatively to fundamental value
(Füllbrunn, 2012).
(3) Bust Duration which is the greatest number of
consecutive periods when prices decrease
relatively to fundamental value (Füllbrunn,
2012).
(4) Positive Deviation (PD), a deviation of the price
from the fundamental value if prices are above
(below) fundamental value (Füllbrunn, 2012).
=
∑|
(
)
−()
|
()()
(8)
(5) Negative Deviation (ND), defined as deviation of
the price from the fundamental value if prices are
below fundamental value (Füllbrunn, 2012).
=
∑|
(
)
−()
|
(
)
<()
(9)
A bubble is characterized as (1) the positive
Relative Deviation (RD is not below or at zero), (2)
long Boom Duration and short Burst Duration
(Boom> Burst), and (3) high Positive Deviation and
low Negative Deviation (PD>ND) (Füllbrunn,
2012). Thus, to verify these properties, we will test
the corresponding null hypothesis (i.e. (1) ≤ 0,
(2) ≤ , and (3) ≤ ).
Also, given that the decisions of a mimetic trader
are imitations of their successors, and that the choice
of successor to imitate depends on the weights of its
interactions with him (see Figure 2) thus, to be able
to measure the influence of each type of traders on
decisions of mimetic traders, we measure the
average of interactions weights with each type of
traders as follow:
Let
,
,…,
weights of interactions
where: (1) predecessor is mimetic trader, (2)
successor is a trader of type which can be Noise,
Fundamentalist, Hybrid, or Mimic, i.e. ∈
,,,
}
. is the traders number of the type .
=
∑
(10)
Thus, there will be four weight averages:
,
,
and
.
Also, to better understand prices dynamic and
trader’s behaviour, we will interest to the strategies
used by traders to make a decisions on the market.
For fundamentalist and noise traders, the strategy is
obviously fundamentalist and noise respectively. For
hybrid traders, strategy is the one used to take the
last decision (technical or fundamentalist). For
mimetic trader, strategy is the one used by imitated
trader to make imitated decision (see Figure 2).
Finally, we will use social networking
visualization tools to visualize the evolution of the
interactions of traders and their strategies.
3.2 Experimental Settings
Table 1 shows values for general model parameters
of all performed experiments. Given the large
number of model parameters, we content with relate
only general parameters of the experiments, namely
general parameters of market which have the same
values in all experiments, and the same for the
parameters of generated fundamental values. What
will change in performed experiments are the
proportions of different types of traders, except the
noise traders that are set at 10% in all experiments,
and whose role is to ensure market liquidity
(Kobayashi, 2007). First, we test model with
fundamentalists trading (EXP.1), after we will
introduce hybrid traders (EXP.2). Finally, we
introduce the mimetic traders in EXP.3. The aim is
to show that mimetic traders are able to cause a
mimetic contagion of speculative behaviour and a
deviation of prices from the fundamental value, in
the same way as hybrid traders.
Table 1: Experimental design.
EXP.1 EXP.2 EXP.3
General
parameters of
Market
Nbr. of transactions 2000 2000 2000
Number of traders 500 500 500
Open price 1000 1000 1000
Proportions of
traders
Noise traders 10% 10% 10%
Fundamental traders 90% 10% 10%
Hybrid traders 0% 80% 10%
Mimetic traders 0% 0% 70%
Parameters of
generated
fundamental
values
Initial FV 1000 1000 1000
b (eq. 2) 0,5 0,5 0,5
n (section 2.2) 500 500 500
3.3 Analyse of Results
First, we will observe the statistical properties of the
experiments and compared with two real price series
(FTSE100 index and Barclays bank’s (Martinez,
2009)). Table 2 shows that price series generated by
our model have statistical properties that are close to
the real series. For example, it has been found in real
financial market, that prices series exhibit a kurtosis
larger than three, which indicate a leptokurtic
distribution of return. This phenomenon is known as
fat tails (Martinez, 2009). Thus, as real series, the
series generated by experiments have a kurtosis
larger than three, and so exhibit a phenomenon of fat
tails.
ICAART 2017 - 9th International Conference on Agents and Artificial Intelligence
394
After having presented the statistical properties
of performed experiments, now we will analyse and
discuss results of each experiment regarding the
dynamics of prices and its relationship with the
behaviour of traders.
Table 2: Statistical properties of log return in performed
experiments.
Mean Median Min. Max. Kurtosis Skewness
FTSE100
-0,00003 0 -0,059 0,059 5,138 -0,130
Barclays
0,00020 0 -0,090 0,094 4,626 0,113
EXP.1
0,00017 0 -0,067 0,078 5,208 0,219
EXP.2
0,0003 0 -0,035 0,041 9,509 0,586
EXP.3
0,00019 0 -0,035 0,045 4,133 0,460
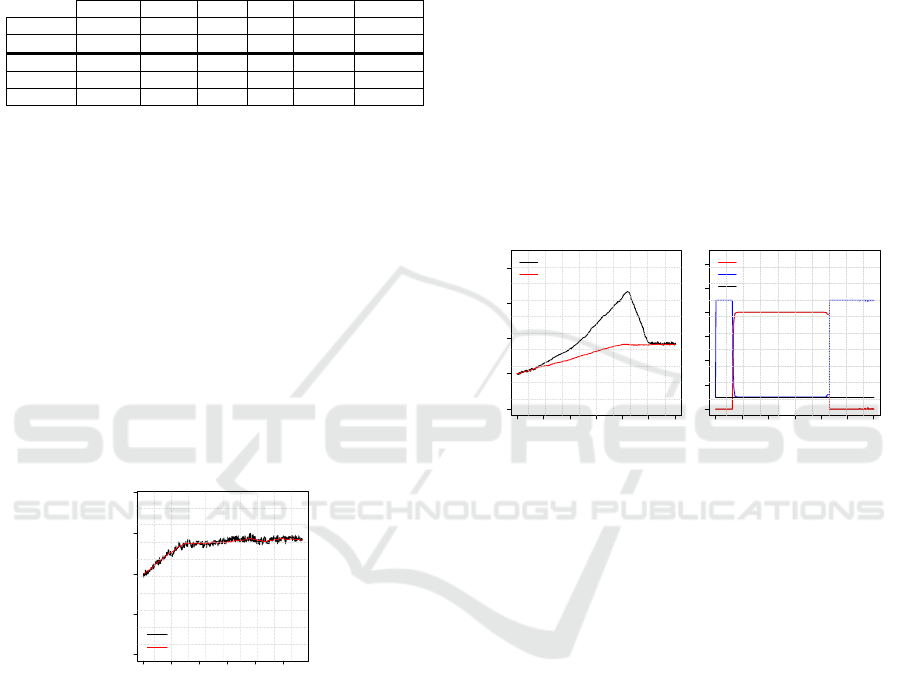
3.3.1 Fundamental Trading
In order to analyse prices dynamics with
fundamentalist traders, we perform EXP.1, with
population composed from 90% of fundamentalists
and 10% of noises (see Table 1). We can see in
Figure 4 that prices fluctuate around the fundamental
value. In Table 3 RD=0.001 is close to 0, also, the
test doesn’t reject a null hypothesis that
≤ 0,
which confirm that prices follow closely
fundamental value (Füllbrunn, 2012). In fact,
fundamentalist traders which represent the majority
of traders submit orders with prices close to
fundamental value, and thus prevent the deviation of
prices from the fundamental.
Figure 4: Evolution of prices and FV in EXP.1.
3.3.2 Introduction of Hybrid Traders
We will observe price dynamics in the presence of
hybrids that can switch between fundamentalist and
speculative strategies. Are they able to cause a
deviation of prices and the formation of bubble by
their speculative behaviour as stated in the
literature?
In EXP.2 when population of traders is
composed from 80% of hybrids and 10% of
fundamentalists, we can see in Figure 5(a) the
deviation of prices from fundamental value that
takes the form of a bubble followed by a crash, also,
the three null hypotheses was rejected, which
indicates a deviation of prices from fundamental
value with the magnitude of a bubble. In fact
RD=0,194 is positive (see Table 3), which indicate
that asset is overvalued. Also, Boom is higher than
Burst and both durations are significantly higher
compared to the number of periods (150). ND=2k
isn’t significant regarding PD=1043k, which
confirms a positive deviation of prices from
fundamental values. A formation of bubble in EXP.2
can explain by the behaviour of hybrid traders which
represent a majority in population. In fact, the
switching of hybrid traders to technical strategy (see
Figure 5(b)) led to a boom phase when prices
increase and deviate from fundamental value, then
return to the fundamentalist behaviour led to a burst
phase when prices decrease and remain close to
fundamental values.
Figure 5: Evolution of prices and the number of traders by
strategies in EXP.2.
3.3.3 Introduction of Mimetic Traders
We will observe price dynamics in the presence of
mimetic traders (section 2.4.4), to see if their
mimetism will lead to diffusion of speculative
behaviour in the market, and formation of bubbles,
such as reported in the literature (e.g. (Orléan, 1989)
and (Chang, 2014)).
In EXP.3 when population of traders is
composed from 70% of mimetic traders and 10% of
noises, fundamentalists and hybrid traders. We can
see in Table 3 that RD=
0,123 is significantly positive
and the same for Boom and Burst duration, which
indicates a significant deviation of price from
fundamental value. The test reject the three null
hypothesis which indicate that a deviation of prices
from fundamental values has the magnitude of
speculative bubble (Figure 6(a)) such as in EXP.2
when population is composed from 80% of hybrids.
0 2000 4000 6000 8000 10000
0 500 1000 1500 2000
Time
Prices/Fund. values
Prices
Fund. values
0 2000 4000 6000 8000 12000
0 1000 2000 3000 4000
Time
Prices/Fund. values
Prices
Fund. values
(a) Prices and Fund. values
0 2000 4000 6000 8000 1200
0
0 100 200 300 400 500 600
Time
Traders by strategy
(b) Traders by strategies
Technicals
Fundamentalists
Noises
An Artificial Stock Market with Interactions Network and Mimetic Agents
395
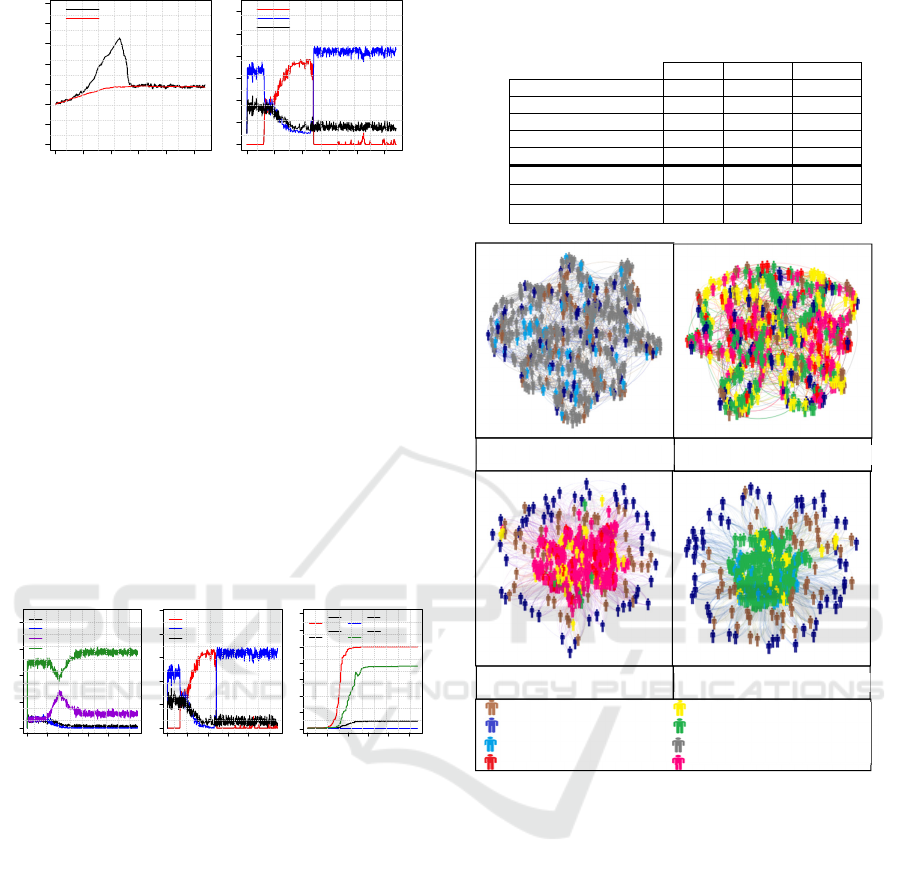
Figure: 6 Evolution of prices and the number of traders by
strategies in EXP.3.
Figure 6 (b) represents the number of traders for
each strategy as function of time. We can see that
the majority of trader’s deviate to speculative
strategy during the period when prices increase, in
fact, 10% of hybrid traders switch to speculative
behaviour due to the uptrend in prices, and then the
vast majority of mimetic imitate speculative
decisions of hybrids, and thus become speculators as
can be seen in
Figure 7
(a) and
Figure 7
(b).
Figure 7
(c) shows that the weights average of mimetic
interactions with hybrids
and mimetic
are
largely greater than those of fundamentalists
and
noises
. This indicates that mimetic traders tend
to imitate hybrids or other mimetic traders.
Figure 7: Evolution of mimetic traders by (a) trader types
(b) strategies, and (c) weight averages of interactions with
mimetic traders in EXP.3.
In other word, speculative behaviour first
contaminates mimetic traders that interact with
hybrid traders, and then gradually contaminates
other mimetic traders which don’t interact directly
with the hybrids. This corresponds exactly to the
mimetic contagion, which causes the phenomenon of
the bubble as described in the literature (e.g.
(Orléan, 1989) and (Chang, 2014)).
Finally, for better understand the behaviour of
traders, and interactions between them, we have
used Gephi tool (Bastian, 2009) to visualize a
traders, their types and investment strategies, and
their interactions in different periods of simulation.
Figure 8 present visualizations of traders and
their interactions in 4 key periods of experiments
EXP.3. A stickman represents a trader; colours
represent their investment strategies. To visualize
Table 3: Means of observed bubble measures, and test of
null hypothesis significance in performed experiments. (*)
indicates that null hypothesis is rejected.
EXP.1 EXP.2 EXP.3
B
oom 241 30
B
urs
t
221 12
R
D 0
,
001 0
,
194 0
,
123
PD 20
k
1043
k
471
k
ND 17 k 2 k 7 k
H0 : ≤ 0
p
>0,05
p
<0,05*
p
<0,05*
H0 : ≤
p>0,05 p<0,05* p<0,05*
H0 : ≤
p>0,05 p<0,05* p<0,05*
Figure 8: Visualization of traders and their interactions
network in EXP.3.
interactions network, we applied the Force Atlas
algorithm, which pulls together nodes connected
with strong interactions, while repelling away all
other nodes. This provides a much more readable
representation of the graph.
Before the start of the simulation, we can see
that the market is populated by a majority of mimics
(grey stickman), with 10% noises (brown stickman),
10% of fundamentalists (blue stickman), and 10% of
hybrids, initially use fundamentalist strategy (sky
blue stickman).
After 300 transactions, all hybrid traders chose
speculative strategy (in red), when mimetic traders
are divided between fundamental strategy (in green),
speculative strategy (in violet) and noise decision (in
yellow). They haven’t preference for a particular
strategy.
0 2000 4000 6000 8000
0 500 1500 2500 3500
Time
Prices/Fund. values
Prices
Fund. values
(a) Prices and Fund. values
0 2000 4000 6000 8000
0 100 200 300 400 500 600
Time
Traders by strateg
y
(b) Traders by strategies
Technicals
Fundamentalists
Noises
0 2000 4000 6000 8000
0 100 200 300 400
Time
Mimics by type o
f
traders
(a) Mimics by imitated traders
Nois es
Fundamentalists
Hybrids
Mim ic s
0 2000 4000 6000 8000
0 100 200 300 400 500
Time
Mimics by strategy
(b) Mimics by strategies
Technical strategy
Fundamental strategy
Nois e strategy
0 2000 4000 6000 8000
0 20 40 60 80 100 120 140
Time
Average Weights
(c) Evolution of average weights
W
M
H
W
M
N
W
M
F
W
M
M
Noise trader
Fundamentalist trader
Hybrid with fundamental strategy
H
y
brid with s
p
eculative strate
gy
In the beginning (time 0)
After 300 transactions (time 1879)
After 500 transactions (time 4219) After 800 transactions (time 5041)
Mimetic with noise strategy
Mimetic with fundamental strategy
Mimetic without strategy
Mimetic with s
p
eculative strate
gy
ICAART 2017 - 9th International Conference on Agents and Artificial Intelligence
396

After 500 transactions, the mimetic approach
each other, and with hybrid traders, indicating a high
weights of interactions between them. Thus, the
majority of mimetic traders imitate speculative
decisions of hybrids, which leads to the formation of
a bubble.
After 800 transactions, mimetic traders always
have strong interactions between them and with
hybrid traders, the majority of mimetic traders
switch to fundamentalist behaviour with hybrids,
which causes the crash.
4 CONCLUSIONS
In this paper we introduced an agent based model of
double auction market with heterogeneous traders
and a social network of interactions. The market is
populated by different types of traders, namely, (1)
noise traders which represent misinformed traders in
the market, (2) fundamental traders which make
their decisions based on their estimate of the
fundamental value, (3) hybrids which represent
traders able to switch to speculative behaviour when
they detect an uptrend in prices, and finally, (4)
mimetic traders which take decisions by imitating
their successors in interactions network.
To test the model, we conducted a series of
experiments and compared statistical properties of
generated prices series with those of real market, and
also, we tested theoretical assumptions which
consider mimetic traders as the first explanation of
the phenomena of speculative bubble. Experiments
have shown that prices series generated have statistic
properties close to those of real prices series. Also,
results of experiments support theoretical
assumption concerning the important role of
mimicking behaviour as an explanation of excess
volatility and bubbles formation. In fact, when
market is populated by a majority of mimetic
traders, they choose to imitate speculative decisions,
resulting in price volatility and the formation of a
bubble.
The proposed model provides access to all the
information concerning the decisions of traders, their
strategies and their interactions; this will have to
provide a more efficient way to study the mimicking
behaviour and its role on financial markets.
Regarding the perspective, we will improve the
model through the development of agents that better
simulate the behaviour of traders in real markets.
REFERENCES
Bikhchandani, S., & Sharma, S. (2000). Herd behaviour in
financial markets. IMF Economic Review, 47(3), 279-
310.
Banerjee, A. V. (1992). A simple model of herd behavior.
The Quarterly Journal of Economics, 797-817.
Scharfstein, D. S., & Stein, J. C. (1990). Herd behaviour
and investment. The American Economic Review, 465-
479.
Derveeuw, J., Beaufils, B., Mathieu, P., & Brandouy, O.
(2007). Testing double auction as a component within
a generic market model architecture. In Artificial
Markets Modeling (pp. 47-61). Springer Berlin
Heidelberg.
Orléan, A. (1989). Mimetic contagion and speculative
bubbles. Theory and Decision, 27(1-2), 63-92.
Martinez-Jaramillo, S., & Tsang, E. P. (2009). An
heterogeneous, endogenous and coevolutionary GP-
based financial market. IEEE Transactions on
Evolutionary Computation, 13(1), 33-55.
Bessembinder, H., & Venkataraman, K. (2009). Bid-ask
spreads: Measuring trade execution costs in financial
markets. Encyclopedia of Quantitative Finance.
Füllbrunn, S., & Neugebauer, T. (2012). Margin Trading
Bans in Experimental Asset Markets. Jena Economic
Research Paper, 58.
Stöckl, T., Huber, J., & Kirchler, M. (2010). Bubble
measures in experimental asset markets. Experimental
Economics, 13(3), 284-298.
Bastian, M., Heymann, S., & Jacomy, M. (2009). Gephi:
an open source software for exploring and
manipulating networks. ICWSM, 8, 361-362.
Chang, S. K. (2014). Herd behavior, bubbles and social
interactions in financial markets. Studies in Nonlinear
Dynamics and Econometrics, 18(1), 89-101.
Watts, D. J., & Strogatz, S. H. (1998). Collective
dynamics of ‘small-world’networks. nature,
393(6684), 440-442.
Kobayashi, S., & Hashimoto, T. (2007). Analysis of
Random Agents for Improving Market Liquidity
Using Artificial Stock Market. In Proceedings of The
Fourth Conference of The European Social Simulation
Association (ESSA 4th’07) (pp. 315-317).
Manahov, V., & Hudson, R. (2013). Herd behaviour
experimental testing in laboratory artificial stock
market settings. Behavioural foundations of stylised
facts of financial returns. Physica A: Statistical
Mechanics and its Applications, 392
(19), 4351-4372.
An Artificial Stock Market with Interactions Network and Mimetic Agents
397
