
Algorithms for Telemetry Data Mining using Discrete Attributes
Roy B. Ofer
1
, Adi Eldar
1
, Adi Shalev
1,2
and Yehezkel S. Resheff
1,2
1
Microsoft ILDC, Herzelyia, Israel
2
Hebrew University of Jerusalem, Jerusalem, Israel
royo@microsoft.com, adieldar@microsoft.com, t-adisha@microsoft.com, yehezkel.resheff@mail.huji.ac.il
Keywords:
Data Mining, Pattern Mining, Software Telemetry, Failure Analysis, Subspace Clustering.
Abstract:
As the cost of collecting and storing large amounts of data continues to drop, we see a constant rise in the
amount of telemetry data collected by software applications and services. With the data mounding up, there
is an increasing need for algorithms to automatically and efficiently mine insights from the collected data.
One interesting case is the description of large tables using frequently occurring patterns, with implications
for failure analysis and customer engagement. Finding frequently occurring patterns has applications both
in an interactive usage where an analyst repeatedly query the data and in a completely automated process
queries the data periodically and generate alerts and or reports based on the mining. Here we propose two
novel mining algorithms for the purpose of computing such predominant patterns in relational data. The
first method is a fast heuristic search, and the second is based on an adaptation of the apriori algorithm. Our
methods are demonstrated on real-world datasets, and extensions to some additional fundamental mining tasks
are discussed.
1 INTRODUCTION
The amount of telemetry data collected from software
services and applications is rising constantly. This
data records the ways users interact with the software,
runtime measurements, exceptions, crashes, and other
failure incidents. A significant part of application and
service telemetry data is obtained in the form of struc-
tured data with many categorical attributes.
In the context of failure or exception analysis, one
important mining task is to isolate the attributes that
are associated with a certain type of event (for exam-
ple: having a large number of exceptions on a website
when it is used with a certain OS and browser versions
in a specific language). This sort of analysis is carried
out routinely by analysts and engineers in order to un-
derstand users, and the behavior of software associ-
ated with failures by interactive query of the data. In
addition to the interactive analysis, there is a growing
need for mining of common attribute values associ-
ated with events that were found by an automated pe-
riodic process such as anomaly detection. The ability
to automatically mine related attributes for common
values enriches the anomaly found by the automated
process with human-readable insights significantly in-
creases the effectiveness of such automated detection.
Essentially, the task is to find a large subset of the
data that shares a large number of attributes. The min-
ing task then is to obtain a subset both of the records
themselves and of the attributes such that the records
in the selected records’ subset share the same value in
each attribute of the selected attributes’ subset.
Since the mining task is motivated by failures and
exceptions analysis, a pattern returned by the mining
algorithm should have the following properties:
1. Be human readable and easy to comprehend
2. Could be directly translated to a query over the
data
3. Its representation size should not depend on the
number of rows it characterizes
These properties distinguish this mining task from
classical clustering methods. In Section 5 we com-
pare some results of clustering methods with the re-
sults of the algorithms presented in this work. A pat-
tern returned by the mining algorithms we present is
a set of (column : value) pairs, the pattern is the in-
tersection of those column = value conditions. This
characterization is easy to comprehend, does not de-
pend on the number of rows it characterizes and can
be directly translated into a query over the data.
The algorithms we present in this work consider
only discrete attributes of the data. Only considering
discrete attributes opens up opportunities that do not
exist when continuous attributes exist, both in the al-
gorithmic methods used and in optimizations.
Ofer, R., Eldar, A., Shalev, A. and Resheff, Y.
Algorithms for Telemetry Data Mining using Discrete Attributes.
DOI: 10.5220/0006117903090317
In Proceedings of the 6th International Conference on Pattern Recognition Applications and Methods (ICPRAM 2017), pages 309-317
ISBN: 978-989-758-222-6
Copyright
c
2017 by SCITEPRESS – Science and Technology Publications, Lda. All rights reserved
309

We propose two novel algorithms for mining of
frequent discrete data segments. The first, a simple
and efficient algorithm, uses a heuristic to search the
segment space, and is shown to produce good results
in practice. The second method is an adaptation of
the apriori algorithm (Agrawal et al., 1994) origi-
nally designed for item-set mining. This method is
guaranteed to find all frequent patterns, and while the
worst-case runtime is exponential, when applied to
real-world data runtime tends to be feasible even for
large data sets.
1.1 Motivation and Applications
Cloud-based computing (see e.g. (Armbrust et al.,
2010; Qian et al., 2009; Wilder, 2012)) is increas-
ingly playing an important role in the software in-
dustry. With the transition of software applications
from on-premises to cloud-based solutions, telemetry
data is collected more than ever and with it a growing
need for log analysis, especially the analysis of fail-
ures. The ability to efficiently mine failure logs could
speed up and improve the analysis process, leading to
improvement in the overall software quality and re-
duced costs.
Applications for mining patterns in discrete data
could exist in a very wide variety of fields and are
not limited to telemetry mining. For example, another
possible application could be for customer segmenta-
tion and cohort analysis which is an important aspect
of business analytics. For failure analysis, there ex-
ist two main applications for pattern mining of failure
logs. One is the fully automatic generation of failure-
patterns reports following an alert. The other is hu-
man guided interactive mining where an analyst or
engineer is trying to understand the root cause behind
many failure records, using the automated mining to
extract patterns and interactively refine the queries
instead of tediously slicing through the data manu-
ally. The methods we present in this paper are already
implemented in several products within Microsoft’s
cloud offering as part of a machine-learning enhanced
software analytics suite. The implemented methods
are used for both types of the above mentioned ap-
plications for mining failures, as part of a completely
automatic alerting process that analyzes failures, and
as part of a human-guided big-data analytics tool.
2 RELATED WORK
In the field of log analytics, several methods have
been proposed for mining frequent patterns (Vaarandi
et al., 2003; Xu et al., 2009; Xu et al., 2008). These
methods are mostly concerned with reconstructing the
templates of error messages in order to mine underly-
ing error causes, and are somewhat redundant when
considering relational data, since their main emphasis
is in converting unstructured log data into a tabular
form.
Methods have also been proposed for mining seg-
ments of relational data associated with an anomalous
outcome variable. The PerfAugur system (Roy et al.,
2015) uses decision trees to search for regions of the
data associated with extreme aggregate values of a tar-
get column. In (El Gebaly et al., 2014), a method is
described for mining of data regions associated with a
particular outcome in a binary target variable. Meth-
ods of this sort are not directly applicable when there
is no target column to direct the search. In effect, the
problem we solve here is the unsupervised counter-
part of these supervised methods.
Subspace clustering (Parsons et al., 2004; Vidal,
2010) is the problem of finding clusters in a dataset,
each of which exists in a subspace of the data. When
considering tabular data, this corresponds to clus-
ters existing each in a projection onto a subset of
the columns. Bottom-up methods (for example see
(Agrawal et al., 1998)) often proceed by finding dense
regions in small-subspaces, and extending them to
larger subspaces. The problem we solve here can
be described as a special case of subspace-clustering
over categorical data, where we are only interested in
point sub-space clusters.
3 PRELIMINARIES
3.1 Notation
We start by listing notation used throughout the paper.
X relational table
r number of rows
c number of columns
R a subset of the rows of X
C a subset of the columns of X
S a data segment of X
P a pattern in X
s scoring function
3.2 Problem Definition
Definition 1. data segment
ICPRAM 2017 - 6th International Conference on Pattern Recognition Applications and Methods
310

A data segment S of a relational table X is a tuple
(R,C) where R is a subset of row indices, C is a subset
of columns, and:
∀r
1
, r
2
∈ R, c ∈ C : X[r
1
, c] = X[r
2
, c],
a data segment is a projection of rows and columns
such that all the rows of the projection are identical.
Definition 2. pattern
A pattern P is a set of tuples (c, v) where c ∈ C and v
is a value corresponding to c. A pattern is a compact
representation of the segment (R,C) where
C = {c|∃
v
(c, v) ∈ P}
and
R = {r |∀
(c,v)∈P
X[r,c] = v}.
The reason we are interested in this sort of structure
which can be understood as a point sub-space cluster,
is that in order for the output to be meaningful and in-
terpretable we need each segment to correspond to a
single pattern (see Table 2 for an example of how this
sort of segment is described in the final output). In ad-
dition, the pattern structure can be directly translated
to a query over the data and its size does not depend
on the number of rows it characterizes, thus comply
with the three properties defined in section 1.
Definition 3. scoring function
let X be a relational table containing r rows and c
columns. A scoring function over X:
s : 2
[r]
× 2
[c]
→ ℜ
+
is a function defined over segments of X, non-
decreasing in the number of rows, and sets of
columns:
|R
1
| ≥ |R
2
| → ∀ C ∈ 2
[c]
: s(R
1
,C) ≥ s(R
2
,C)
C
1
⊇ C
2
→ ∀ R ∈ 2
[r]
: s(R,C
1
) ≥ s(R,C
2
)
The intuition behind this definition of a scoring func-
tion is that we are looking for a segment that covers as
many of the rows in the table as possible, regardless
of their identity. The columns, however, do not get
the same treatment; some columns may be more im-
portant than others, and the marginal value of an addi-
tional column can depend on the existing ones (for in-
stance, if a column is duplicated exactly, the marginal
value of adding the second copy should naturally be
zero). The flexibility of the score is an important as-
pect of the algorithms. Since the constraints on the
score leave a relatively high degree of freedom for
different score variants, it allows a very simple cus-
tomization for the specific problem at hand, changing
the desired result by customizing the score function
without changing the algorithm itself.
Table 1: Example synthetic data table.
idx os browser country exception
1 Win10 Chrome USA null ref.
2 Win7 Firefox USA null ref.
3 OSX Chrome USA timeout
4 OSX Firefox UK timeout
5 OSX Chrome UK null ref.
6 Win10 Firefox France null ref.
7 OSX Firefox France null ref.
8 Win10 Firefox USA null ref.
9 Win7 Firefox France null ref.
10 Win10 Firefox USA null ref.
11 Win10 Chrome USA null ref.
12 Win7 Firefox France null ref.
13 Win7 Chrome UK timeout
14 Win7 Firefox UK timeout
15 Win7 Chrome UK timeout
Table 2: Example segment output.
idx os browser country exception #
1 * Firefox France null pointer 4
2 * * UK timeout 4
Our problem statement can now be formulated as
follows: Let X be a relational table, and s a scor-
ing function over X, we are looking for a segment
(R
∗
,C
∗
) with maximal score.
R
∗
,C
∗
=
argmax
R,C
s(R,C)
where (R,C) is a segment in X
(1)
in practice one is likely to use the top n scoring seg-
ments, rather than the top 1, since in real-world ap-
plications there is likely more than a single pattern to
discover in the data, corresponding to several under-
lying causes.
The score we use throughout the evaluation in this
paper is the simplest possibility, namely the propor-
tion of the table that is covered by a segment:
s(R,C) =
|R| × |C|
r × c
(2)
this score assumes all columns are equal and non-
redundant. This is almost never the case in practice,
however, we find that even this simple score function
is relatively efficient in discovering important seg-
ments.
More complex scores are likely to take into ac-
count the information structure of the columns, in a
way that help eliminate duplicate (or near-duplicate)
columns, or at least assign them a lower value. Such
scores are especially important when the data under
consideration is known to include many redundant
columns, as is often the case with software telemetry.
Algorithms for Telemetry Data Mining using Discrete Attributes
311

4 MINING ALGORITHMS
Let (R,C) be a segment in X, C
1
⊂ C a subset of the
segment’s columns, and R
1
⊇ R the maximal set such
that R
1
,C
1
is a segment (that is, all the rows in the ta-
ble that ’agree’ with the original segment on the sub-
set C
1
of columns). There are now two opposite ef-
fects on the score. Since we keep only a subset of the
columns, the score is reduced. On the other hand, a
larger number of rows are now included in the seg-
ment, leading to an increase in the score.
Ideally, we would want to check all subsets of
columns and values and choose the maximal-score
subset. The first algorithm we propose is an iterative
local-search heuristic for optimizing objective (1), by
maximally increasing the number of rows included in
the segment at each stage, dropping one column at a
time. The greedy approach, we call seed-expand al-
lows us to remain linear in the number of columns for
each iteration.
The second algorithm we propose is an adaptation
of the apriori algorithm, it considers (column : value)
pairs as items and returns a complete enumeration of
the frequent patterns (item sets) in a data-table. The
tradeoff cost is an exponential worst-case runtime, but
as our experiments show (section 5), in most cases the
behavior on real world data is quite different. This
result mirrors what is known about the apriori algo-
rithm in the original application for item-set mining.
In section 4.4.3 we further discuss cases which are rel-
atively common in telemetry mining and could lead to
exponential runtime.
4.1 Data Preparation
Like many other data mining processes, the schema
we present can be viewed as a 3 phases flow:
1. Data preparation and pre-processing
2. Mining
3. Results post-processing and filtering
Since the focus of the mining is to extract patterns
from discrete attributes, the data preparation and pre-
processing has a significant role for both the quality
of the results (for the seed-expand algorithm) and the
performance efficiency of the mining.
The first step in preparing the data is to filter out
non-discrete attributes, analyzing each attribute inde-
pendently. This filtering can be done by putting a
threshold on the ratio between the distinct count of at-
tribute values and the total count of rows in the table.
Typically, the filtering step would eliminate attributes
with unique or near unique values such as keys and
indexes as well as continuous attributes that are not
binned into range categories such as timestamps.
The second step takes the filtered table and applies
a group by all the columns. This is a standard proce-
dure in relational tables, and while in the worst case
could have not effect on the size of the data (mean-
ing there are no row duplicates, even after the column
filtering), in practice it reduces the size of real-world
data considerably.
4.2 Seed Expand
Algorithm 1: Iter Seeds.
input:
X datatable
k number of seeds to start from
s scoring function
output:
R,C subsets of the rows and columns attaining the
max score
1: Aggregate X as duplicate-counts; sort by count
descending.
2: score ← 0; R,C ← null
3: for i := 1, ..., k do
4: seed ← record i of X
5: candidates = seed-expand(seed, X)
6: for each R
0
,C
0
in candidates do
7: if s(R
0
,C
0
) > score then
8: R,C,score ← R
0
,C
0
, s(R
0
,C
0
)
9: end if
10: end for
11: end for
12: return: R,C
The algorithm is divided into three parts. First,
the filtered-aggregated table from the data preparation
step is sorted by the descending order of row-counts.
The top k aggregated rows are the designated seeds
and used for further processing. The seeds are the
starting points for the greedy local-search. The logic
behind taking the top k row-counts from the filtered-
aggregated table is that those are the best of patterns
containing all the attributes with respect to objective
(1) and are good heuristic starting points. Other meth-
ods for picking initial starting points, such as random
selection, could also be applied.
Next, each seed is expanded to locally increase the
number of rows. For each seed, at each stage one
column is dropped in a greedy selection, the dropped
column is the one that maximizes the number of rows
captured by the expanded pattern (Algorithm 2).
ICPRAM 2017 - 6th International Conference on Pattern Recognition Applications and Methods
312

Algorithm 2: Seed Expand.
input:
X datatable
seed initial seed to start from
output:
L List of candidates
1: C ← all columns in seed
2: R ← all rows of X in the seed segment
3: L ← empty list
4: while C is not empty do
5: Add (R,C) to L
6: for each column c in C do
7: value(c) ← the number of rows in X
agreeing with seed on columns C \ {c}
8: end for
9: c
∗
← argmax value(c)
10: C ← C \ {c
∗
}
11: R ← rows of X agreeing with seed on
columns C
12: end while
13: return: L
Finally, the segments defined by sets of rows and
columns in each stage of each seed-expansion pro-
cess are scored and the segment attaining the maximal
score is returned (Algorithm 1).
This algorithm may be extended in a straight for-
ward fashion to return a pre-defined number of seg-
ments, rather than the highest scoring one (see Table
2 for an example of the output table).
4.2.1 Runtime Complexity
For each of the k seeds, the seed-expansion pro-
cess checks at each iteration the value of eliminating
each of the O(c) columns, using O(r) row retrieving
queries and O(c) equality comparisons, repeating for
c iterations (Alternatively, this can be described as k
seeds, c columns to eliminate and a |X| = rc size table
we have to scan at each step). This leads to an overall
complexity of:
O(k × r × c
3
).
Since for most applications r >> c, the bottleneck is
related to the linear (in the number of rows) query
stage, and hence that is the target for further optimiza-
tion, we discuss such optimizations in section 4.4.
4.3 Column-value-set
The second algorithm we propose for the frequent
pattern mining is an extension of the apriori algorithm
for item-set mining. The key idea here is that given a
frequent segment defined by k (column: value) pairs,
any l < k of the pairs also defines a frequent segment.
This property allows a sequential approach for
finding all the frequent patterns. First, we find all size
1 patterns, corresponding to all the (column: value)
pairs appearing in over p% of the rows. Next, we iter-
atively find all size n patterns in the Cartesian product
of the set of size n − 1 patterns and the set of size
1 patterns, while filtering out patterns appearing in
less than p% of the rows of the table (Algorithm 3).
This algorithm corresponds to apriori (Agrawal et al.,
1994) with ’items’ defined as the (column: value)
pairs in the table, and hence rows are the equivalent
of ’baskets’.
Once all frequent patterns are found, a scoring
method is needed in order to pick the most interesting
frequent patterns. The importance of this step is even
greater here, since a large number of output patterns
is expected (depending obviously on the value of p),
and this has to be reduced drastically in order to meet
the requirement of providing a number of patterns on
a scale manageable by the end user.
4.3.1 Runtime
There is an extensive literature on the complexity of
the apriori algorithm for frequent item-set mining,
both worst case and various average case analyses
(see e.g. (Hegland, 2005; Purdom et al., 2004) and
(Tan et al., 2006, Chapter 6)). While the average case
for most real-world data is significantly better, in the
worst case the complexity is O(Nw2
k
) where w is the
largest transaction (basket) width, N is the number of
transactions and k is the number of items.
Correlating to the frequent pattern mining, trans-
actions are rows, the width is fixed and is the number
of columns. The items could be correlated to distinct
values in the table, however, the case of frequent pat-
tern mining has additional constraints which allow a
better upper bound for the worst case. Remember that
each pattern represents a slice of the table, that means
that each column can be included in at most one ele-
ment in non-empty slices (patterns). Thus, non-empty
patterns’ width is limited to c and can contain at most
one value from each column. Consequently, we can
bound the number of non-empty patterns in the fol-
lowing manner: each row can belong to at most 2
c
patterns, thus, the number of non-empty patterns can
be bounded by r2
c
. The non-empty patterns can be
enumerated in a single pass over the table where each
row adds to all the 2
c
it belongs to. This leads to an
overall worst-case complexity of:
O(r × c × 2
c
).
The average case runtime for real-world teleme-
Algorithms for Telemetry Data Mining using Discrete Attributes
313

try data tends to be significantly faster than the worst
case, similar to the average case of item-set mining,
except for a specific case which is common in teleme-
try data which we discuss in section 4.4.3.
Algorithm 3: Apriori for frequent pattern mining.
input:
X datatable
p minimal frequency
output:
L List of frequent patterns
1: L ← empty list
2: for each column c in C do
3: for each unique value v in c do
4: if v appears in over p% of column c then
5: Add (c, v) to L
6: end if
7: end for
8: end for
9: for n = 2, 3... do
10: Let L
1
be the set of patterns of size 1 in L
11: Let L
n−1
be the set of patterns of size n − 1 in
L
12: for each patterns l
1
, l
n−1
in L
1
× L
n−1
do
13: if the frequency of l
1
∪l
n−1
is ≥ p% then
14: Add l
1
∪ l
n−1
to L
15: end if
16: end for
17: end for
18: return: L
4.4 Performance Optimizations
This section deals with tricks for speeding up the
and reducing the number of queries performed by the
seed-expand and apriori algorithms.
4.4.1 Aggregation and Tail Folding
Since in practice telemetry data is often characterized
by highly dense regions in the data space, meaning
that many rows are exact duplicates over the set of
relevant columns, the first stage of the pre-processing
is to compute the aggregate table of duplicate row
counts (See row 1 in Algorithm 1). Once this is com-
puted, the complexity is reduced from linear in the to-
tal number of rows, to linear in the number of distinct
filtered rows. We find that this is often several orders
of magnitude smaller, in section 5.2 we present a dis-
tribution of the compression ration achieved by this
step on real-world data.
Like many other types of real-world data, teleme-
try data and especially failure telemetry data tends to
have a long tail distribution. Attributes with a long
tail distribution that pass the initial pre-processing fil-
tering lead to inefficient aggregation (resulting aggre-
gated table is not much smaller than the original ta-
ble). In order to overcome this issue and further in-
crease the compression ratio achieved by the aggre-
gation, a tail folding procedure could be used. In
tail folding, each value which appears in less than
a threshold of the rows is replaced with some pre-
defined ’other’ value. The tail folding process sig-
nificantly increases the efficiency of the aggregation
compression ratio.
4.4.2 Indexing and Caching
The next optimization is by indexing of all columns
of the table. By maintaining a mapping from each
(column: value) pair to the set of rows that fit it, a
query over the table for a specific value per column
in some (or all) of the columns, is reduced to a se-
ries of set-intersections with complexity linear in the
maximal number of rows per value, in the aggregated
table, instead of the total number of rows in it.
Finally, since the algorithm may retrace itself
starting from different seeds, caching all query results
leads to a significant improvement in runtime. This
optimization leads naturally to a memory-runtime
trade-off and the size of the cache can be determined
on a per-usage basis.
4.4.3 Apriori Optimization
The underlying assumption behind the apriori algo-
rithm is that by putting a minimal support threshold
on what is considered a frequent set, the consequent
pruning of the search space is significant enough to
transform the problem of frequent item-set mining
from an exponential worst case to polynomial or bet-
ter average case. When considering this assumption
in telemetry data, and especially in failures teleme-
try, running on real-world data has highlighted a case
in which this assumption doesn’t hold. The case is
when a single source is generating enough telemetry
records to pass the minimal support threshold and the
records are identical on most of the columns resulting
in a runtime which has a close order of magnitude to
the exponential worst case. An example for this case
is when an automated process on a single machine
generates enough telemetry to pass the threshold.
In order to overcome cases of an exponential run-
time due to many records coming from the same
source, we introduce an optimization to the apriori
iterations. In each iteration, each generated pattern
is added to a mapping between the hash value of the
row indices defined by the pattern to the pattern itself.
ICPRAM 2017 - 6th International Conference on Pattern Recognition Applications and Methods
314

Pattern 1 (19%): [(OsVer, ”Windows 10”), (Resolu-
tion, ”1920X1080”), (Type, ”Invalid character”)]
Pattern 2 (17%): [(Type, ”Unexpected token”),
(Browser, ”Chrome”), (Continent, ”Europe”)]
Figure 1: Seed-Expand results for Exceptions data in an
internal large software company’s cloud service.
If the mapping already contains the hash value then
the corresponding patterns (the existing and the newly
found) are unified to a single larger pattern. Since
the scoring of a pattern is non-decreasing in the set of
columns, the score of the unified pattern is equal or
greater than the score of each of the sub-patterns and
the objective defined in (1) is consistent with this opti-
mization. The unification of patterns within each iter-
ation allows a significant pruning of the search space,
especially for sets generated from the same source.
It is worth noting that this optimization does not im-
prove the worst case scenario in which a very large
pattern exist that defines a segment which passes the
minimal support threshold but any pair of its sub-
patterns slightly differ in the rows they define.
5 RESULTS
In this section we present experimental results of
running the algorithms on real-world datasets and
comapring them with other known methods.
5.1 Datasets
The datasets used in the experiments that follow are
various telemetry datasets that were collected by Mi-
crosoft’s cloud services. Microsoft’s Azure offers
telemetry collection for many types of applications,
including services, client and browser applications,
mobile applications and more. We randomly selected
applications in a way that represents all types of ap-
plications.
5.2 Experiments
First, we investigate a dataset of exceptions in an in-
ternal Microsoft’s cloud service, the records in this
dataset include the following attributes: TimeStamp,
Type, Browser, Operating System, Screen Resolution,
Continent, Country, Session id. We use this data
to demonstrate the power of the seed-expansion ap-
proach and show why traditional clustering methods
are ill-suited to this task.
The seed-expand method resulted in 25 patterns,
each covering up to 19% of the data rows. The first
two patterns (shown in Fig. 1) demonstrate the read-
able and interpretable nature of the representation of
patterns as a list of (column, value) tuples.
We contrast this result with the output of k-means
using the Hamming distance (see (Couto, 2005) for
use of hamming distance in k-means for categorical
data). Table 3 shows 9 rows from a single cluster ob-
tained using k-means (k=5). It is evident that while
rows show a family resemblance, there is no natural
way of interpreting the cluster in a way that will be
useful for root cause analysis; this is clearest when
examining the first column (Exception type), where
we see many different exceptions in the same cluster.
Next, we investigate the runtime of the seed-
expand and apriori based algorithms on varying num-
ber of columns and application sizes. The effect of
application size is however mediated by the aggrega-
tion step in the data preprocessing. Figure 2 presents
the distribution of compression ratio (computed as:
aggregated size
raw size
) for small, medium, and large apps.
The results show an overall high compression rate
(mean aggregated size of 13%). Furthermore, there is
a grading of the compression with respect to the app
size; small apps (n=1840) have an average aggregate
size of 13.7% while medium and large apps (n=277,
85 respectively) have average aggregate sizes of 9.9%
and 8.0% respectively. The main importance of this
property is that if the aggregate tables can be expected
to grow sub-linearly, then mining algorithms such as
seed-expand can scale effectively and thus be appli-
cable for data collected by large apps.
Finally, we investigate the runtime effect of the
number of columns in the raw data, in the seex-
expand and apriori based methods. For the seed-
expand algorithm (Fig. 3) the rise of runtime as a
function of number of columns is in line with the run-
time analysis is section 4.2.1. As expected, the apri-
ori based algorithm (Fig. 4) shows a steeper increase
in runtime as the number of columns increases. How-
ever, the overall comparable runtimes even with real-
istic sized data indicates the suitability and applica-
bility of the exhaustive apriori based option for real
world applications.
6 EXTENSIONS AND FUTURE
WORK
In this section we present an extension of the seed-
expand algorithm and apriori adaptation to a different
but related mining task. Consider a case where two
data-tables exist, referring, for instance, to telemetry
data from two time windows. In this case, it may
be useful to find segments that change in volume be-
Algorithms for Telemetry Data Mining using Discrete Attributes
315
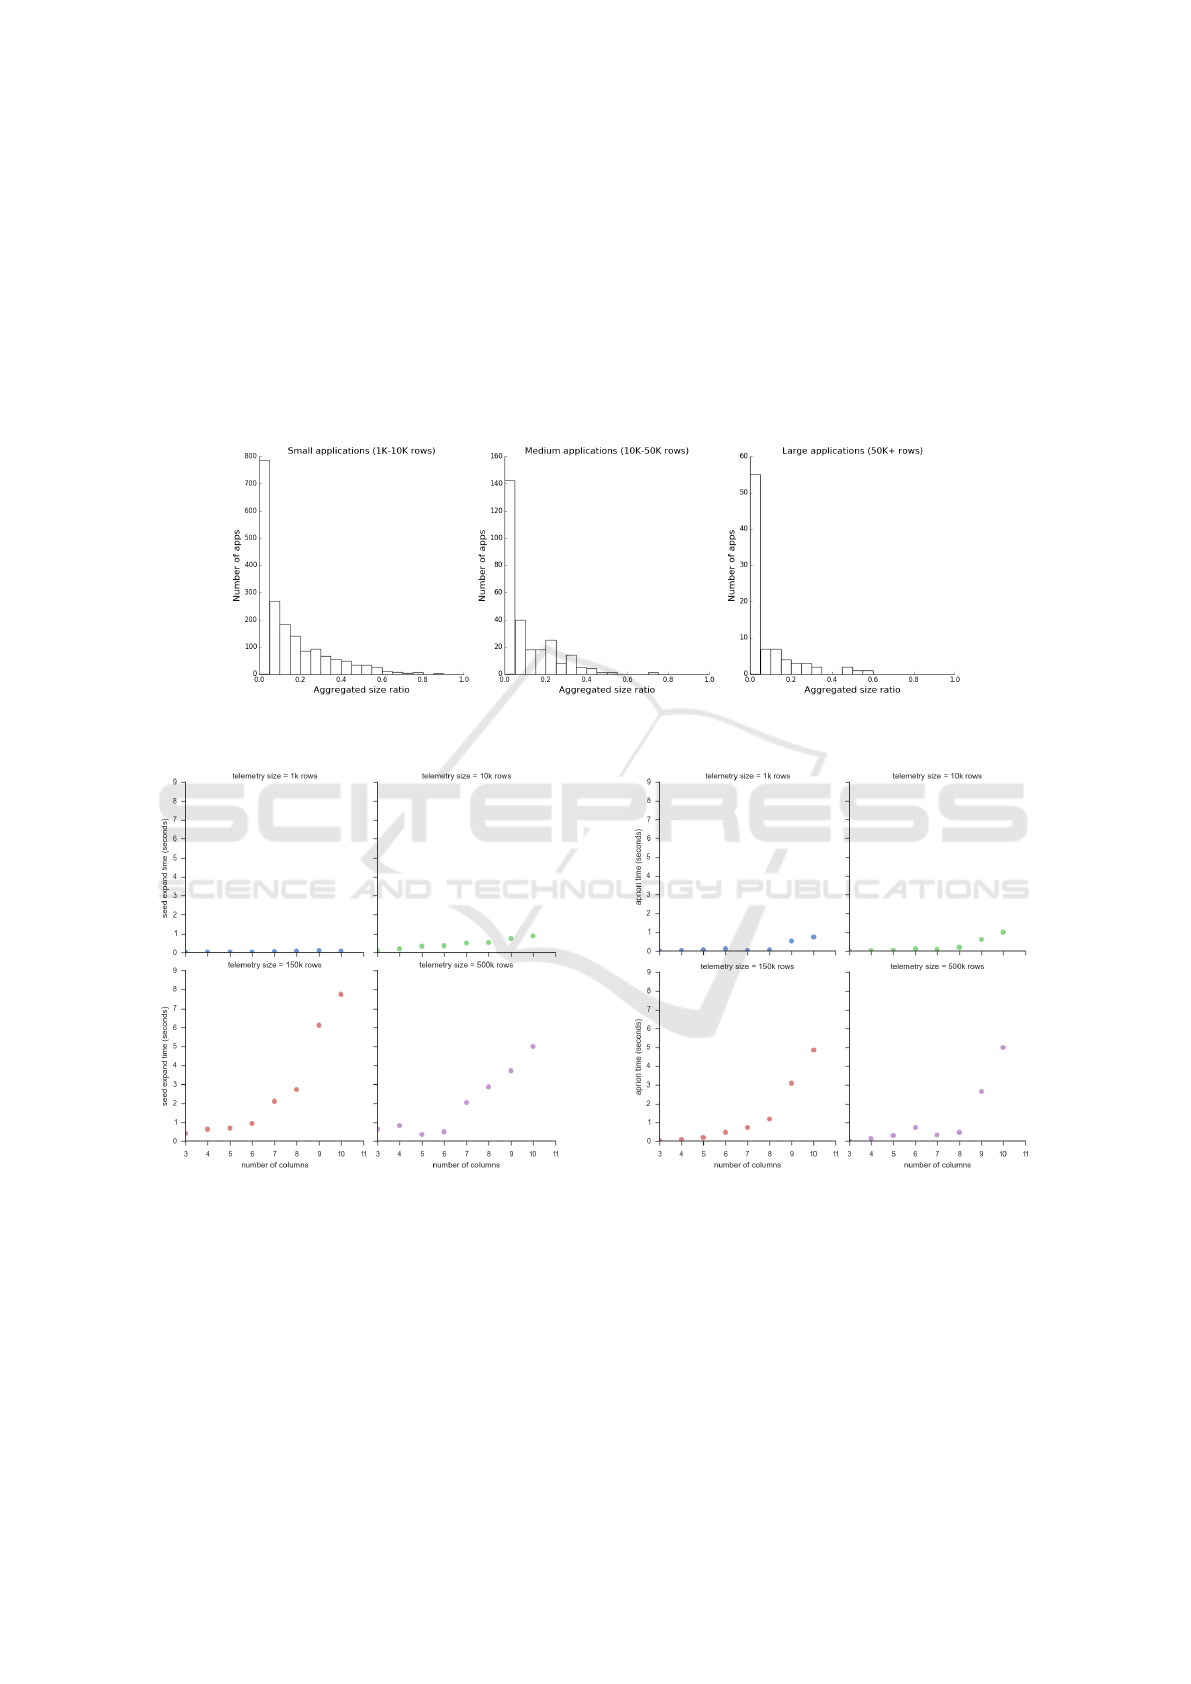
Table 3: K-means clustering results for Exception data in an internal large software company’s cloud service (using Hamming
distance and k=5). This table contains rows from a single cluster.
Unexpected token u Chrome 45.0 Mac OS X 10.9 1920X1080 Europe Ireland
JSON.parse: unexpected Firefox 41.0 Ubuntu 1920X1080 Europe Netherlands
JSON Parse error Safari 8.0 Mac OS X 10.10 1280X800 North America United States
Unexpected token u Chrome 45.0 Mac OS X 10.9 1920X1080 Europe Ireland
Unexpected token u Chrome 45.0 Windows 8.1 1920X1080 North America United States
System.Web.HttpException Chrome 45.0 Mac OS X 10.11 North America United States
Unexpected token u Chrome 45.0 Windows 8.1 1920X1080 Oceania New Zealand
Script error. Chrome 45.0 Windows 8.1 1920X1080 Europe Denmark
Unexpected token u Chrome 45.0 Windows 7 1280X1024 Europe Ireland
Figure 2: Distribution of aggregation size (compression ratio) for small, medium, and large apps.
Figure 3: Runtime of the Seed-Expansion phase as a func-
tion of number of columns used, for various app sizes.
tween the tables, rather than dense segments in each
table alone.
In the seed-expand algorithm, the rows with top
k proportion differences are designated as the seeds.
The seed-expansion stage proceeds as in the one-table
case; iteratively, a column is discarded in order to lo-
cally maximize the number of rows in the segment,
conditioned on the between-table proportion differ-
Figure 4: Runtime of the apriori based miner as a function
of number of columns used, for various app sizes.
ence being maintained. Unlike the single-table case,
the process may be terminated before removing all
the columns, if the local search gets stuck at a point
where removing any column breaks the proportion-
difference condition.
The extension for the apriori adaptation for
change mining is to run the apriori adaptation twice,
once for each table, then unify the results of the pat-
ICPRAM 2017 - 6th International Conference on Pattern Recognition Applications and Methods
316

terns from both runs to include the proportion differ-
ence of each pattern between the two tables.
Finally, the scoring and choosing of the winning
segment(s) remains unchanged (however, the score
functions best suited for this task are naturally slightly
different than the single table case). We defer the rest
of the details of this variant to further research.
7 CONCLUSION
This paper describes the mining task of finding dense
segments in application and service telemetry data,
corresponding to interesting regions to be further an-
alyzed by the user. We propose a novel heuristic
method that locally searches for segments in order
to optimize a segment scoring function, as well as
an adaptation of the apriori algorithm guaranteed to
find all frequent segments, rank and filter them ac-
cording to the scoring. Requiring only lenient con-
straints from the scoring function leaves a relatively
large degree of freedom for score variants and allow
an easy way of customizing the end results for the
specific mining task without changing the algorithms
themselves.
The main contribution of this paper is in defining
and solving the mining task, which helps close the gap
between the reality of increasing amounts of data be-
ing collected on the one hand, and the relative lack
of tools to automatically and efficiently mine it on
the other. The two methods demonstrate the tradeoff
between a heuristic fast search approach and a com-
prehensive and potentially worst-case exponential ap-
proach. In practice, as shown in the experiments, both
methods are applicable for real-world telemetry min-
ing when combined with the right pre-processing.
REFERENCES
Agrawal, R., Gehrke, J., Gunopulos, D., and Raghavan, P.
(1998). Automatic subspace clustering of high dimen-
sional data for data mining applications, volume 27.
ACM.
Agrawal, R., Srikant, R., et al. (1994). Fast algorithms for
mining association rules. In Proc. 20th int. conf. very
large data bases, VLDB, volume 1215, pages 487–
499.
Armbrust, M., Fox, A., Griffith, R., Joseph, A. D., Katz,
R., Konwinski, A., Lee, G., Patterson, D., Rabkin, A.,
Stoica, I., et al. (2010). A view of cloud computing.
Communications of the ACM, 53(4):50–58.
Couto, J. (2005). Kernel k-means for categorical data. In
Advances in Intelligent Data Analysis VI, pages 46–
56. Springer.
El Gebaly, K., Agrawal, P., Golab, L., Korn, F., and Srivas-
tava, D. (2014). Interpretable and informative expla-
nations of outcomes. Proceedings of the VLDB En-
dowment, 8(1):61–72.
Hegland, M. (2005). The apriori algorithm–a tutorial.
Mathematics and computation in imaging science and
information processing, 11:209–262.
Parsons, L., Haque, E., and Liu, H. (2004). Subspace clus-
tering for high dimensional data: a review. ACM
SIGKDD Explorations Newsletter, 6(1):90–105.
Purdom, P. W., Van Gucht, D., and Groth, D. P. (2004).
Average-case performance of the apriori algorithm.
SIAM Journal on Computing, 33(5):1223–1260.
Qian, L., Luo, Z., Du, Y., and Guo, L. (2009). Cloud com-
puting: an overview. In Cloud computing, pages 626–
631. Springer.
Roy, S., K
¨
onig, A. C., Dvorkin, I., and Kumar, M.
(2015). Perfaugur: Robust diagnostics for perfor-
mance anomalies in cloud services. ICDE - 31st In-
ternational Conference on Data Engineering.
Tan, P.-N., Steinbach, M., Kumar, V., et al. (2006). Intro-
duction to data mining, volume 1. Pearson Addison
Wesley Boston.
Vaarandi, R. et al. (2003). A data clustering algorithm for
mining patterns from event logs. In Proceedings of the
2003 IEEE Workshop on IP Operations and Manage-
ment (IPOM), pages 119–126.
Vidal, R. (2010). A tutorial on subspace clustering. IEEE
Signal Processing Magazine, 28(2):52–68.
Wilder, B. (2012). Cloud architecture patterns: using mi-
crosoft azure. ” O’Reilly Media, Inc.”.
Xu, W., Huang, L., Fox, A., Patterson, D., and Jordan,
M. I. (2009). Detecting large-scale system problems
by mining console logs. In Proceedings of the ACM
SIGOPS 22nd symposium on Operating systems prin-
ciples, pages 117–132. ACM.
Xu, W., Huang, L., Fox, A., Patterson, D. A., and Jordan,
M. I. (2008). Mining console logs for large-scale sys-
tem problem detection. SysML, 8:4–4.
Algorithms for Telemetry Data Mining using Discrete Attributes
317
