Relative Direction Change
A Topology-based Metric for Layout Stability in Treemaps
Sebastian Hahn
1
, Joseph Bethge
2
and J
¨
urgen D
¨
ollner
1
Hasso-Plattner-Institut, Potsdam, Germany
Keywords:
Layout Stability, Treemaps, Evaluation.
Abstract:
This paper presents a topology-based metric for layout stability in treemaps—the Relative Direction Change
(RDC). The presented metric considers the adjacency and arrangement of single shapes in a treemap, and
allows for a rotation-invariant description of layout changes between two snapshots of a dataset depicted
with treemaps. A user study was conducted that shows the applicability of the Relative Direction Change in
comparison and addition to established layout metrics, such as Average Distance Change (ADC) and Average
Aspect Ratio (AAR), with respect to human perception of treemaps. This work contributes to the establishment
of a more precise model for the replicable and reliable comparison of treemap layout algorithms.
1 INTRODUCTION
Treemaps represent hierarchical data by means of
space-constrained, recursively nested sets of convex
polygons that express hierarchy nodes. Their sizes
are proportional to per-node weights (Johnson and
Shneiderman, 1991). Data associated with nodes,
the attributes, can be mapped by the visual variables
(Bertin, 1983; Carpendale, 2003) of treemaps such as
polygon size, color, texture, and shading. Variants of
treemaps are applied in a large number of applications
and systems to interactively display, explore and an-
alyze multivariate, hierarchical data of, e.g., file sys-
tems (Shneiderman, 1992), software systems (Wettel
and Lanza, 2008), business data (Vliegen et al., 2006),
or stock markets (Wattenberg, 1999). Treemap imple-
mentations can be mainly distinguished according to
the underlying layout algorithm they apply (Schulz,
2011). Various approaches have been developed over
the last decades, e.g., layout algorithms that optimize
the aspect ratio of the visual representations, preserve
a specific order of the data items and depict this or-
der in the visual counterparts or offer non-rectangular
shapes such as polygons. In addition to those proper-
ties, the stability of the layout represents a key quality
of a treemap implementation. A layout is called stable
if small changes of the data only cause small changes
of the arrangement and positions of the visual item
representations. If treemaps should be used in a con-
sistent and continuous way in applications (e.g., as a
visual data interface), layout stability becomes a key
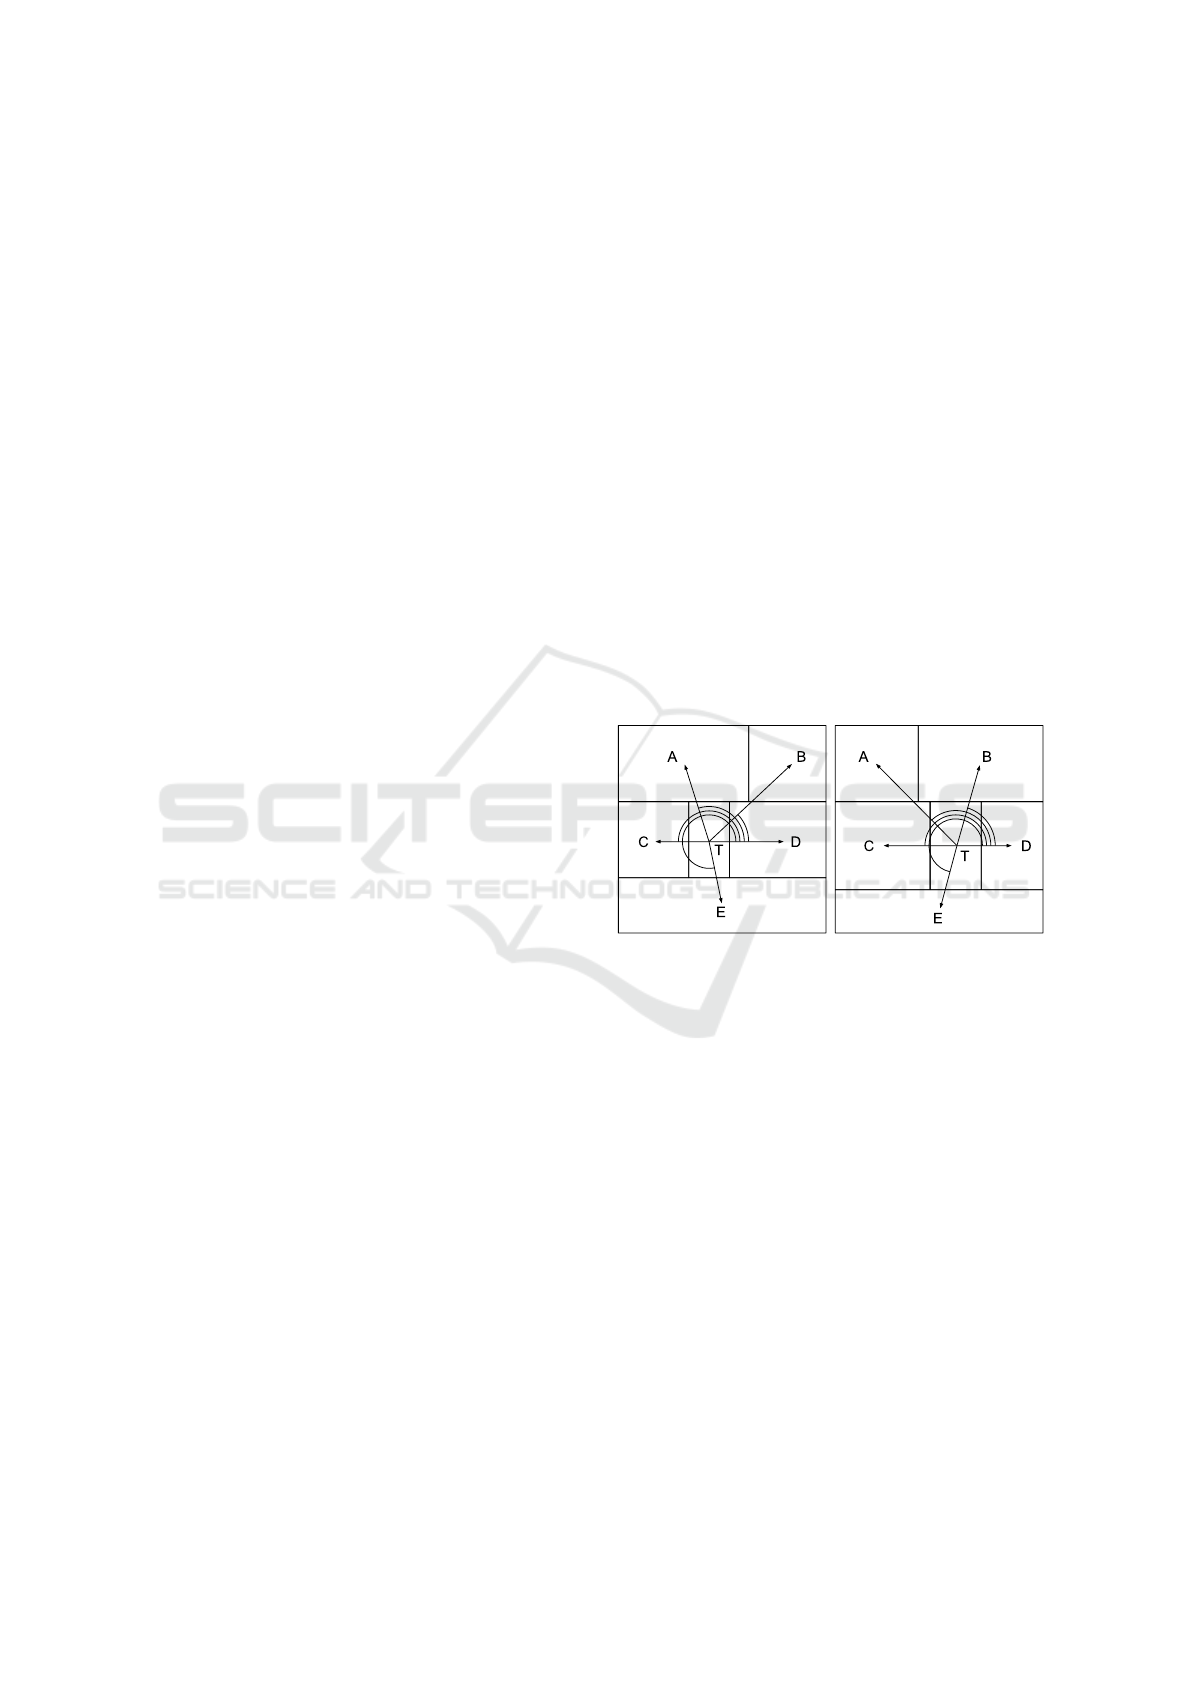
Figure 1: Relative Direction Change presents a topology-
based metric for layout stability that takes into account the
adjacencies of treemap items.
requirement because an instable layout would distort
the users mental map. For detailed definitions of the
term layout stability we refer to the literature (Table
1). Measuring the stability of a treemap layout algo-
rithm is done either by an image-based comparison of
the resulting depictions, or by computing layout met-
rics that focus on specific properties of the individual
treemap items such as position changes.
In this paper, we propose a layout metric that fo-
cuses on the topology of treemaps and their items
adjacency — the Relative Direction Change (RDC)
(Figure 1). It extends the idea of the Average Angu-
lar Displacement (AAD) (Wood and Dykes, 2008) by
adding an invariance against rotations. We present re-
sults from a user study showing the usefulness of the
proposed metric in comparison to well known metrics
such as the Average Distance Change (ADC).
88
Hahn S., Bethge J. and DÃ˝ullner J.
Relative Direction Change - A Topology-based Metric for Layout Stability in Treemaps.
DOI: 10.5220/0006117500880095
In Proceedings of the 12th International Joint Conference on Computer Vision, Imaging and Computer Graphics Theory and Applications (VISIGRAPP 2017), pages 88-95
ISBN: 978-989-758-228-8
Copyright
c
2017 by SCITEPRESS – Science and Technology Publications, Lda. All rights reserved
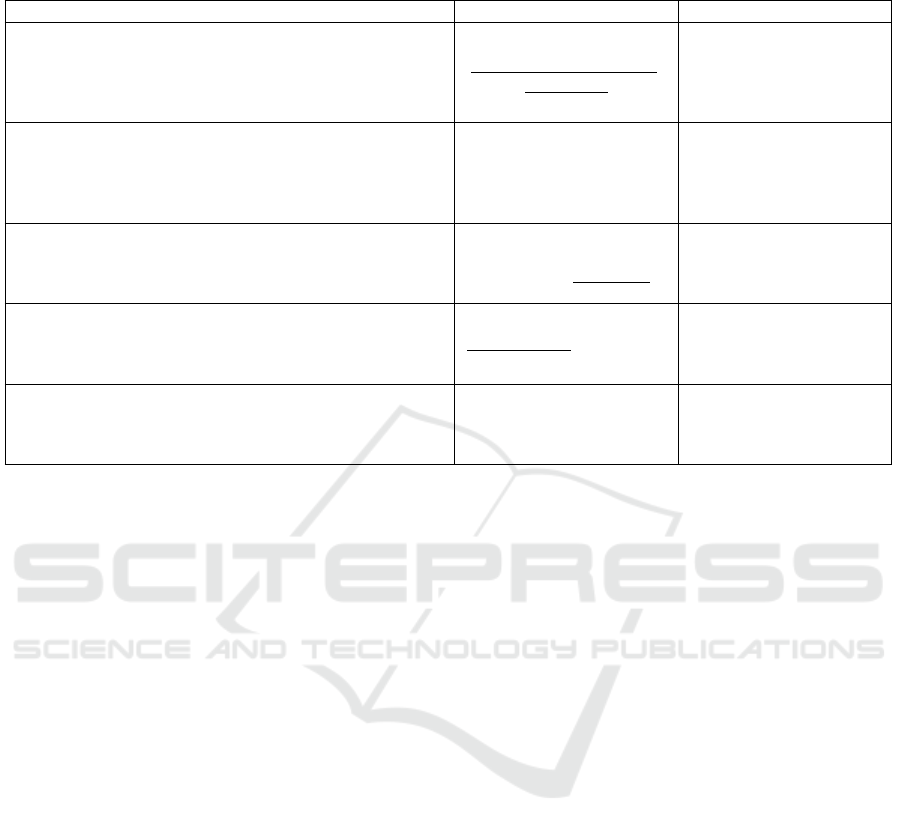
Table 1: Definitions of layout stability, publishing year, and used metric(s) for the evaluation of the layout algorithm. Under-
lined metrics were first introduced in the respective publication.
Quote Evaluation Metric(s)
Ref.
While these algorithms do improve visibility of small items
in a single layout, they introduce instability over time in the
display of dynamically changing data, fail to preserve order
of the underlying data, and create layouts that are difficult
to visually search.
Average Distance Change,
Readability
(Bederson et al., 2002)
Stability with regard to changing leaf values, stability with
regard to changing tree structure, and preservation of or-
dering information. [...] ensure that small changes in the
underlying data will lead to small changes in the corre-
sponding layout.
Mathematical Proof
(Wattenberg, 2005)
The stability of the layout is mainly reflected by Average
Distance Change, for which the spiral layout is better than
the strip layout in most cases, except for the case where the
aspect ratio is large.
Average Distance Change,
Readability, Continuity
(Tu and Shen, 2007)
We demonstrate that stability is not fully captured by the
commonly used ”distance change“ metric. To address this
shortcoming we introduce a new ”location drift“ metric
that better encapsulates stability.
Average Distance Change,
Location Drift, Readability,
Continuity
(Tak and Cockburn, 2013)
In other words, we refer to such a layout algorithm’s ”toler-
ance“ against changes in varying input hierarchy-data with
respect to the arrangement and layout of resulting visual
representations as layout stability.
Image-based Comparison
(Hahn et al., 2014)
2 RELATED WORK
Treemap Layout Algorithms are published for more
than two decades (Schulz, 2011). The initial Slice
and Dice treemap (1991) used a linear subdivision
of a rectangle in alternating, horizontal and vertical,
directions based on the tree depth of an hierarchy item
(Johnson and Shneiderman, 1991). This approach,
especially if used for sub-hierarchies with a large
number of items, results in shapes with high aspect
ratios and, therefore, poor readability. Bruls et al. put
a high focus on readability with Squarified treemaps
(2000), using a treemap algorithm that creates
square-like shapes and, hence, it allows for Average
Aspect Ratios near one, but as a trade-off shows poor
layout stability (Bruls et al., 1999). The trade-off
between nicely-shaped regions and layout stability
was first mentioned by Bederson et al., introducing
the Strip treemap (2002) and a first evaluation that
takes into account the change of positions for varying
hierarchical data sets (Bederson et al., 2002). Tu
and Shen tried to overcome the challenge of layout
instability by using a spiral-shaped space-filling
curve, Spiral treemap (2007) (Tu and Shen, 2007),
that also allows for preserving a specific order of
data in the depiction. Tak and Cockburn (Tak and
Cockburn, 2013) also use a space-filling curve to
compute the initial item positions; their Hilbert &
Moore treemaps (2013) create low mean aspect ratio
and high stability. They also introduced a new layout
metric, the location drift, which overcomes some
of the disadvantages of the distance change metric.
Nevertheless, the evaluation of this algorithm against
other common ones did not consider hierarchical data
sets. In addition to the common rectangular treemap
approaches, Balzer and Deussen present generalized
Voronoi- (or Power-)diagrams to create Voronoi
treemaps (2005), using random initial positions for
items (Balzer and Deussen, 2005). The algorithm
was extended by Hahn et al. to allow for stable
distributions, resulting in treemaps that create items
with low Average Aspect Ratios and a high visual
stability (Hahn et al., 2014). Although they show
an image-based comparison, an actual metric-based
evaluation of the stability is missing.
The Perception of Treemaps with respect to layout
stability is highly connected to the research in men-
tal maps. Misue et al. define the mental map for
graphs with a model consisting of three different as-
pects: orthogonal ordering, proximity relations, and
topology (Misue et al., 1995). Their definition of
topology focuses on the connections between graph
nodes is not directly applicable to implicit hierarchi-
cal visualization techniques like treemaps. Neverthe-
less, the orthogonal ordering and proximity relations
propose a direction on how to evaluate the changes in
a layout with respect to a user’s mental map. Wood
and Dykes seize the idea of topology preservation
within the abstract depiction of geo-related data by
Relative Direction Change - A Topology-based Metric for Layout Stability in Treemaps
89
a treemap algorithm (Wood and Dykes, 2008). The
ability to preserve the topology of the depicted items
in their geo-space and treemap-space was evaluated
by using the Average Angular Displacement metric
(Ghoniem et al., 2015). Another common metric for
evaluating treemap layout stability is the Average Dis-
tance Change introduced by Bederson et al. (Beder-
son et al., 2002), which only takes into account the
change in the Euclidean distance of the absolute posi-
tion and aspect ratio of depicted items. Several eval-
uations were performed showing that their respective
layout algorithm performs best with respect to layout
stability. However, either they introduced algorithm
specific metrics or used artificial or non-hierarchical
data sets (Bederson et al., 2002; Tu and Shen, 2007;
Tak and Cockburn, 2013). Kong et al. evaluate as a
prerequisite for a good area estimation in treemaps,
the rule of nicely-shaped regions and item orienta-
tions (Kong et al., 2010) In a controlled experiment
they found, that users can hardly estimate high aspect
ratios especially with different orientations, but did
not focus on the stability of different treemap algo-
rithms.
3 RELATIVE DIRECTION
CHANGE
The mapping stage of the visualization pipeline gen-
erates the visual representations of the data items. For
each data item a shape (rectangle or convex polygon)
is created and positioned with respect to the hierar-
chy position in the data set. Typically, an attribute
of the data item is mapped to the ground area of the
visual artifact that represents the proportion with re-
spect to its siblings. In a treemap this step is han-
dled by the layout algorithm. By this, each visual
representation of a node has some properties defining
the topography of the whole treemap. Those prop-
erties are the position of the artifact inside the rep-
resentation of the root node, the width and height,
and consequently the aspect ratio. We refer to met-
rics that use those properties as intra-node metrics
because measuring the change of them would only
include each node itself. Since the human percep-
tion of maps — and the cognition of mental maps —
is not only based on the recognition of single item
shapes (Misue et al., 1995; Kaas, 1997), but also on
the arrangement of sub-structures, the Relative Direc-
tion Change is introduced. This inter-node metric
also takes into account the adjacency of nodes from
each sub-tree. The concept of orthogonal ordering
as described by Misue et al. (Misue et al., 1995)
and the Average Angular Displacement (Wood and
Dykes, 2008) serve as a basis for this metric. Each
visual element that occurs in both treemaps has a po-
sition p in the first one (p
0
for the second) defined
by its center (or centroid for polygonal shapes) with
cartesian coordinates x
p
and y
p
(x
0
p
and y
0
p
). Here,
directions are expressed as angles, computed by the
arctangens (atan2(∆y, ∆x)) of the differences between
the centers (Equation 1). Computing the direction of
each items’ center towards the other items’ center re-
sults in a direction matrix M (Equation 2). This results
in two direction matrices (M and M
0
), one for each hi-
erarchical depiction. The absolute difference between
two of these matrices shows the absolute change in
the treemap. The change between two corresponding
elements of these matrices is written as ∆
i, j
for brevity
(Equation 3. Further the change between two angles
is normalized into the range of (−π, π] (Equation 4).
Computing the average change of a row, results in the
average change of one item with respect to all other
items (Equation 5). The average of all rows finally
results in the Relative Direction Change of the two
depictions (Equation 6). To make the Relative Di-
rection Change rotation-invariant, the average of all
values in a row is subtracted from each single value
of the row (Equation 7). With this approach a metric
is shown that allows for the computation of similarity
between two treemaps based on the actual topography
(Figure 2). To ensure comprehensive computation of
the RDC metric for non-rectangular shapes the center
of a treemap item is defined by the shapes centroid.
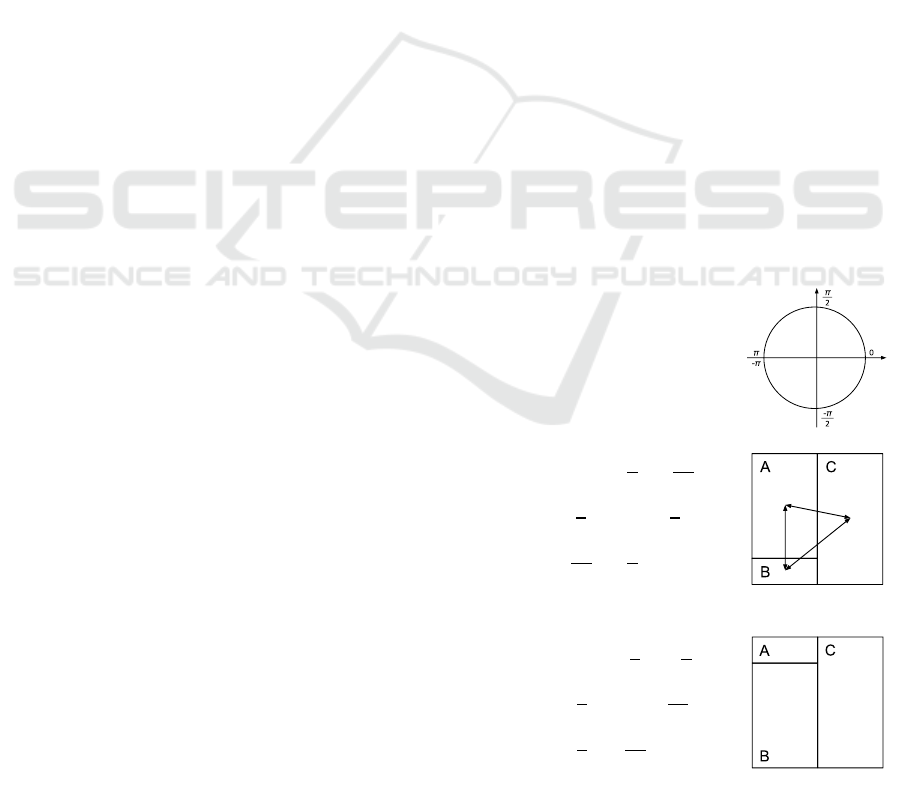
Figure 2: Exemplary computation of the Relative Direc-
tion Change (RDC). The resulting AAD is 0.318 and the
rotation-invariant RDC is 0.159.
IVAPP 2017 - International Conference on Information Visualization Theory and Applications
90

(a) Strip (b) Squarified (c) Slice and Dice (d) Hilbert (e) Voronoi
Figure 3: Depictions of the first snapshot of the dataset that was used for the controlled study by each layout algorithm.
d
p,p
0
= atan2(y
p
0
− y
p
, x
p
0
− x
p
) (1)
M
i, j
=
d
1,1
d
1,2
··· d
1,n
d
2,1
d
2,2
··· d
2,n
.
.
.
.
.
.
.
.
.
.
.
.
d
n,1
d
n,2
··· d
n,n
(2)
∆
i, j
= M
i, j
− M
0
i, j
(3)
kαk =
α − 2 π, if α > π
α + 2 π, if α ≤ −π
α, otherwise
(4)
AV G
i
=
1
n − 1
n
∑
j=1
i6= j
(k∆
i, j
k) (5)
RDC =
1
n
n
∑
i=1
|AV G
i
| (6)
RDC
RI
=
1
n
2
− n
n
∑
i=1
n
∑
j=1
i6= j
|(k∆
i, j
k − AV G
i
)|(7)
4 EVALUATION
The main goal is to investigate mathematical rela-
tions between layout metrics and completion times for
item-recovering tasks in different treemap layout al-
gorithms and a hierarchical dataset that changes over
time. Based on the independent variables Algorithm
and Year, the task completion time was measured for
both, gaze fixations and mouse interaction. The com-
pletion time, measured in two ways (time until click
at certain element, time until first fixation of an ele-
ment), serves as a result for the prediction of different
models. The relation to different layout metrics and
their interaction was tested by using (multiple) linear
models. Since Relative Direction Change is designed
to also take into account the topology of treemaps we
expect an improvement of the predictions when Rela-
tive Direction Change is used in addition to the other
layout metrics.
4.1 Data Set
The dataset that was used to create the treemap lay-
outs needed to fulfill a set of requirements. First,
it should be a small-sized non-artifical dataset, that
could be understood easily, to achieve small tasks
completion times. Second, main operations for hi-
erarchical datasets that change over time should be
included such as changing attributes associated to the
hierarchy data items, as well as adding or removing
such items from one snapshot to another. For the at-
tribute changes any values are acceptable, since they
are mapped to the input weights for the treemap algo-
rithms. Last, the dataset should also remain a stable
basis, meaning the amount of changes should not be
too large. This requirement is motivated by the main
goal of creating layout stable treemap algorithms —
to achieve high spatial coherence in the resulting im-
ages while small changes in the underlying data oc-
cur. A suitable dataset was found in the annual (each
year) population measure of the Munich Zoo
1
. The
population size of animals from different species were
extracted for seven consecutive years from 2008 to
2014 from a public business report. The hierarchical
structure of the data was given by the taxonomy of
the living animals. The results were aggregated and
summed up to the second hierarchy level (order), re-
sulting in 31 to 34 order elements belonging to four
different classes.
4.2 Participants
We conducted an empirical study with 24 volunteer
participants (3 female) recruited from the local uni-
versity campus. The age of the participants ranged
from 19 to 37 (mean = 24.2, SD = 4.1). 20 partici-
pants stated, they were familiar with the concept of
a treemap, while four were not. Nine participants
agreed or strongly agreed in being an expert in com-
puter graphics and visualization (rating a 4 or 5 re-
spectively on a 1 to 5 Likert scale).
1
http://www.hellabrunn.de/en/
Relative Direction Change - A Topology-based Metric for Layout Stability in Treemaps
91
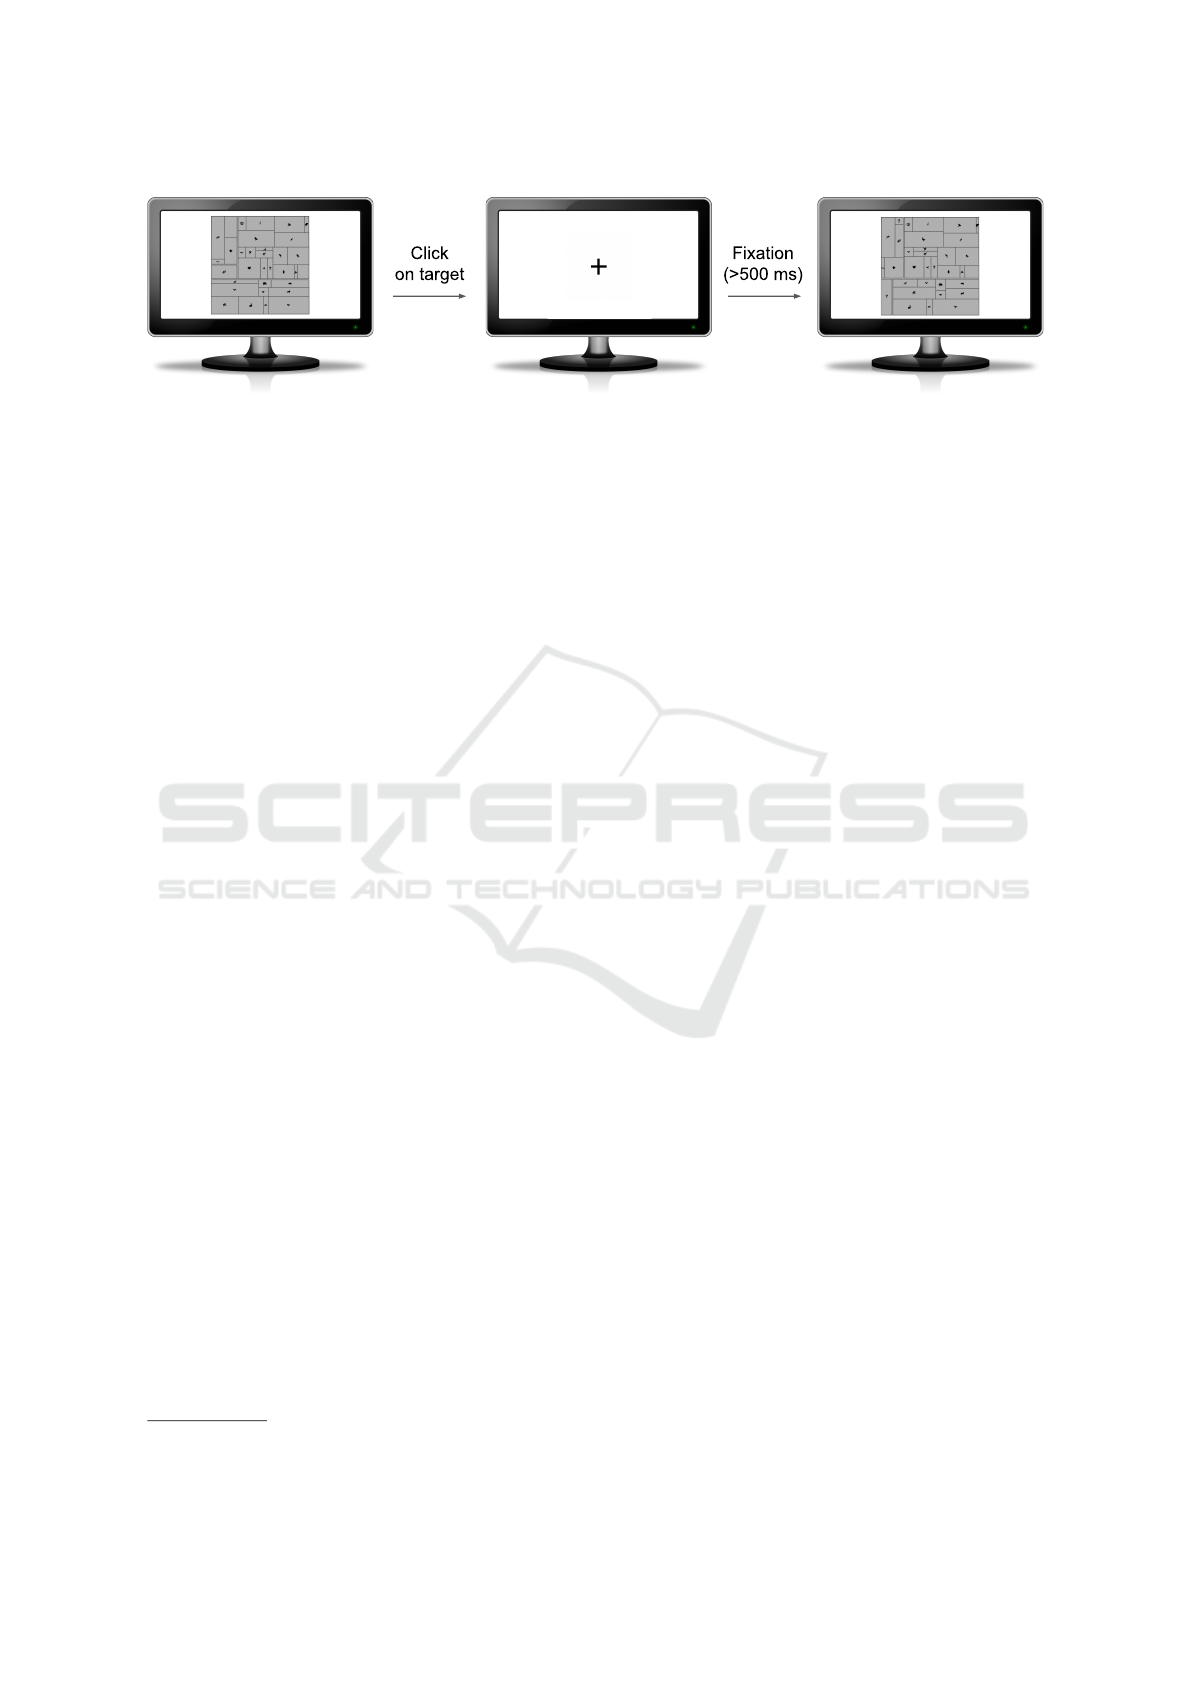
Figure 4: An example sequence of images shown between the first picture and the second picture of a block in the user study.
Between each treemap image a cross was displayed that had to be fixated for at least 500 ms.
4.3 Apparatus
The study was conducted with eye tracking technol-
ogy to support a more precise measurement of the
dis- or recovering task using an eye tracking system
named EyeFollower from Interactive Minds
2
. It al-
lows for accurate (< 0.4
◦
deviation) gaze-tracking
within natural head movements at a desktop environ-
ment. The participants sat in front of a 24 inch display
with a FullHD resolution (1920 × 1080 p). Addition-
ally, an observation display was placed behind a wall,
hidden from the view of the participant. This allowed
the observer to check for losses of head-tracking dur-
ing the experiment. The proprietary software NYAN -
Architect Edition
2
, was used for calibration, display-
ing fixation crosses, presentation of stimuli and the
recording of data. The gaze samples were recorded
with 120 Hz. After the study was completely con-
ducted, the raw gaze data and mouse event data was
exported and analyzed separately.
4.4 Procedure
The display was set up on top of the eye tracker. Par-
ticipants were instructed to take a comfortable seat in
a stable chair in front of the eye tracker setup. If, dur-
ing the calibration process, they had taken a seat out-
side of the tracking range of the eye-tracker, they were
instructed to adjust their position accordingly. Prior
to participating in the study, they sign a consent form
and complete a questionnaire soliciting demographic
data. The tasks (dis- or recovering a certain item)
were received in written form. A mid-sized item that
appeared in each year of the dataset was randomly
picked for the discovering tasks (the item size was not
leveled within the study). Within the study a block
of depictions for each layout algorithm was shown to
the participants in its actual order (2008, 2009, 2010,
etc.). Due to this, participants had discover the item in
the first depiction of a block, but should only recover
it in the following ones. The task sheet specified to
2
http://www.interactive-minds.com
solve the task as fast as possible, while avoiding er-
rors. Each participant started the experiment with an
initial training session, with datasets that were modi-
fied manually to avoid possible learning effect in the
following study. First, the eye-tracker was calibrated,
then three example blocks of this modified data were
shown. The goal of the training session was to bring
participants up to speed and make sure the task was
well understood. Finally, the study continued with
five blocks (one for each algorithm) that took approx-
imately 10 minutes for each participant.
4.5 Design
The experiment was a 5 × 7 within-subjects design.
There were two independent variables:
• Algorithm (Squarified, Slice and Dice, Strip,
Hilbert, Voronoi)
• Year (2008, 2009, 2010, 2011, 2012, 2013, 2014)
The conditions of algorithms, resulted in five differ-
ent treemap depictions (Figure 3) with seven pictures,
one for each year (3). To measure the learning ef-
fect for a single algorithm, participants would always
see the seven pictures of one algorithm, separated by
short breaks only. Every time the participant clicked
on the target of one picture, the treemap was hidden,
and a fixation cross was displayed instead that had to
be fixated for at least 500 ms before continuing with
the next picture (Figure 4). After completing a block a
short break (at least 10 seconds) was taken before the
participants were allowed to continue with the next
algorithm. The order of the algorithm conditions was
fully randomized for each participant to prevent order
and learning effects between the different algorithms.
Aside from training, the amount of observations was
24 participants × 5 algorithms × 7 years. This made
a total of 840 observations, 35 per subject. Taken into
account, that only 720 trials (24 × 5 × 6 years) are
used as basis for the measurement of the recovering
task.
IVAPP 2017 - International Conference on Information Visualization Theory and Applications
92
0.029
0.014
0.049
0.051
0.046
2.785
11.064
2.160
2.967
1.350
0.039
0.011
0.063
0.066
0.053
0.037
0.011
0.062
0.064
0.040
0.682
0.685
0.638
0.661
0.598
0.290
0.105
0.232
0.265
0.219
Average Distance Change
Average Aspect Ratio
Average Angular Displacement
Relative Direction Change
ClickTime (s)
FixationTime (s)
0.00
0.01
0.02
0.03
0.04
0.05
0
3
6
9
0.00
0.02
0.04
0.06
0.00
0.02
0.04
0.06
0.0
0.2
0.4
0.6
0.0
0.1
0.2
0.3
Algorithm
Hilbert Slice and Dice Squarified Strip Voronoi
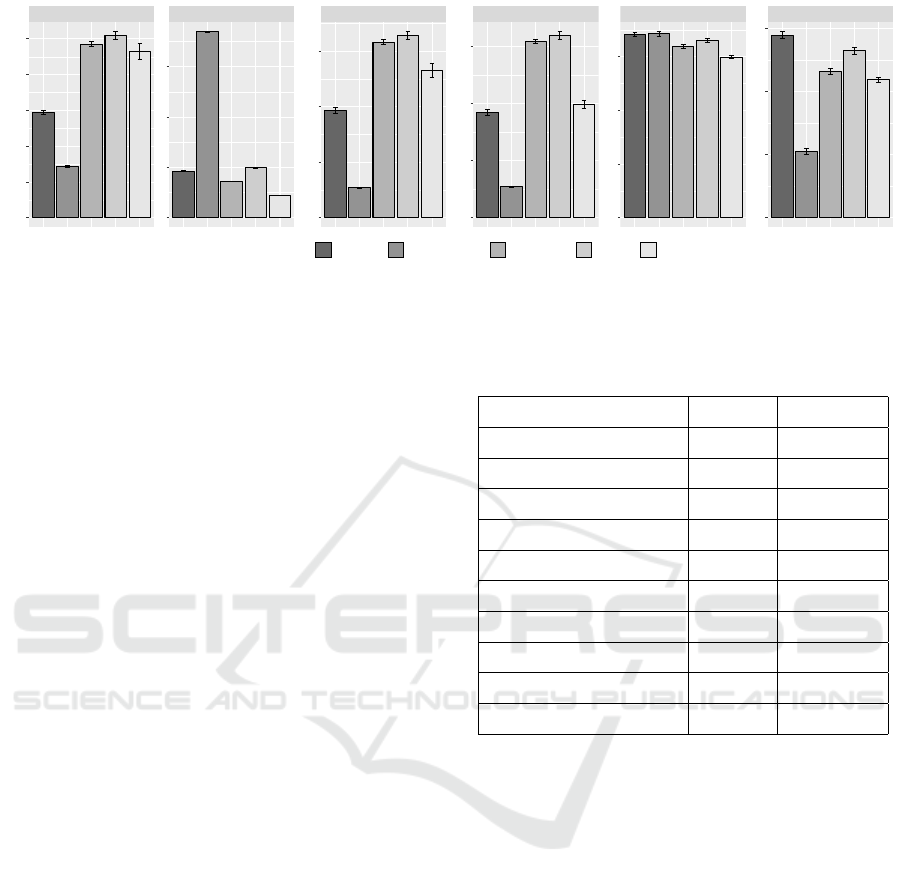
Figure 5: Layout stability metrics and measurements from the user study per layout algorithm.
5 RESULTS
During the experiment the dependent variables click-
Time and fixationTime were measured within the re-
covering task. The results for these metrics for the dif-
ferent treemap layout algorithms are presented first.
These are followed by the results of the layout metrics
and the results correlation of user perception from the
experiment with the layout metrics.
5.1 ClickTime & FixationTime
The experiment resulted in complete 719 observations
(only 1 had to be removed due to imcompleteness).
A Shapiro-Wilk test showed that the distributions of
both, the clickTime and fixationTime within the differ-
ent algorithm groups are not appearing to come from
a normal distribution (clickTime: all p-Values < .001;
fixationTime: all p-Values < .001). Additionally, a
Levene test shows high significance for heteroscedas-
ticity between the groups for both variables (click-
Time : p < .002; fixationTime: p < .01). A statisti-
cally significant difference (clickTime: H = 14.201,
p < .01; fixationTime: H = 180.76, p < .001) was
found using a Kruskal-Wallis test. In a post-hoc pair-
wise comparison of the measurements for clickTime
only three groups showed significant differences us-
ing a Wilcoxon test (comparison between Voronoi -
Hilbert; Voronoi - Slice and Dice and Voronoi -
Strip). However, the comparison of fixationTime mea-
surements showed significant differences between all
groups, but Strip - Squarified (p = 0.36). Table 2
shows a complete overview of the pairwise compar-
ison between the groups. In addition to measuring
the completion times representing the users percep-
tion we computed the layout metrics for the Aver-
age Distance Change (ADC), the Relative Direction
Change (RDC) and the Average Aspect Ratio (AAR)
for each pair of tested years of the dataset (see Figure
Table 2: p values for post hoc comparison of groups.
Pair clickTime fixationTime
Hilbert - Slice and Dice .860 < .001 **
Hilbert - Squarified .138 < .001 **
Hilbert - Strip .557 .006 **
Hilbert - Voronoi .002 ** < .001 **
Slice and Dice - Squarified .102 < .001 **
Slice and Dice - Strip .469 < .001 **
Slice and Dice - Voronoi .001 ** < .001 **
Squarified - Strip .361 .356
Squarified - Voronoi .114 .034 **
Strip - Voronoi .010 ** < .001 **
5 for the complete data). The measurements from the
trials were used to create a simple linear regression
model for the users’ perception based on the layout
metrics. Finally, different multiple linear regression
models were calculated to predict the dependent vari-
ables clickTime and fixationTime based on the three
different layout metrics. For both dependent variables
a multiple linear regression model was calculated that
included either the Average Distance Change together
with the Average Aspect Ratio or Relative Direction
Change together with the Average Aspect Ratio. Ad-
ditionally, a multiple linear regression model was cal-
culated that included all three layout metrics.
5.2 Models for ClickTime
ADC + AAR: A multiple linear regression was cal-
culated to predict clickTime based on ADC and AAR.
A significant regression equation was found (F
2,716
=
30.68, p < .001), with a R
2
of .07893. Predicted
clickTime is equal to 0.54788 + 1.45747 × ADC +
0.01225 × AAR.
Relative Direction Change - A Topology-based Metric for Layout Stability in Treemaps
93
AAD + AAR: A second multiple linear regres-
sion was calculated to predict clickTime based
on AAD and AAR. A significant regression equa-
tion was found (F
2,716
= 36.34, p < .001), with
a R
2
of .09215. Predicted clickTime is equal to
0.533360 + 1.363092 × AAD + 0.013902 × AAR.
RDC + AAR: Another multiple linear regres-
sion was calculated to predict clickTime based
on RDC and AAR. A significant regression equa-
tion was found (F
2,716
= 47.06, p < .001), with
a R
2
of .1162. Predicted clickTime is equal to
0.505296 + 1.995893 × RDC + 0.015369 × AAR.
ADC + RDC + AAR: A last multiple linear re-
gression was calculated to predict clickTime based
on ADC, RDC and AAR. A significant regression
equation was found (F
3,715
= 33.38, p < .001),
with a R
2
of .1229. Predicted clickTime is equal to
0.498811 − 1.118791 × ADC + 3.072374 × RDC +
0.016096 × AAR.
5.3 Models for FixationTime
ADC + AAR: A multiple linear regression was
calculated to predict fixationTime based on ADC
and AAR. A significant regression equation was
found (F
2,716
= 51.36, p < .001), with a R
2
of .1255. Predicted fixationTime is equal to
0.232953 + 0.813848 × ADC − 0.010284 × AAR.
AAD + AAR: A second multiple linear regres-
sion was calculated to predict fixationTime based
on AAD and AAR. A significant regression equa-
tion was found (F
2,716
= 59.23, p < .001), with
a R
2
of .142. Predicted fixationTime is equal to
0.219946 + 0.838116 × AAD − 0.009035 × AAR.
RDC + AAR: Another multiple linear regres-
sion was calculated to predict fixationTime based
on RDC and AAR. A significant regression equa-
tion was found (F
2,716
= 73.49, p < .001), with
a R
2
of .1703. Predicted fixationTime is equal to
0.196907 + 1.327742 × RDC − 0.007766 × AAR.
ADC + RDC + AAR: A last multiple linear re-
gression was calculated to predict fixationTime based
on ADC, RDC and AAR. A significant regression
equation was found (F
3,715
= 57.42, p < .001), with
a R
2
of .1941. Predicted fixationTime is equal to
0.187921 − 1.550314 × ADC + 2.819427 × RDC −
0.006758 × AAR.
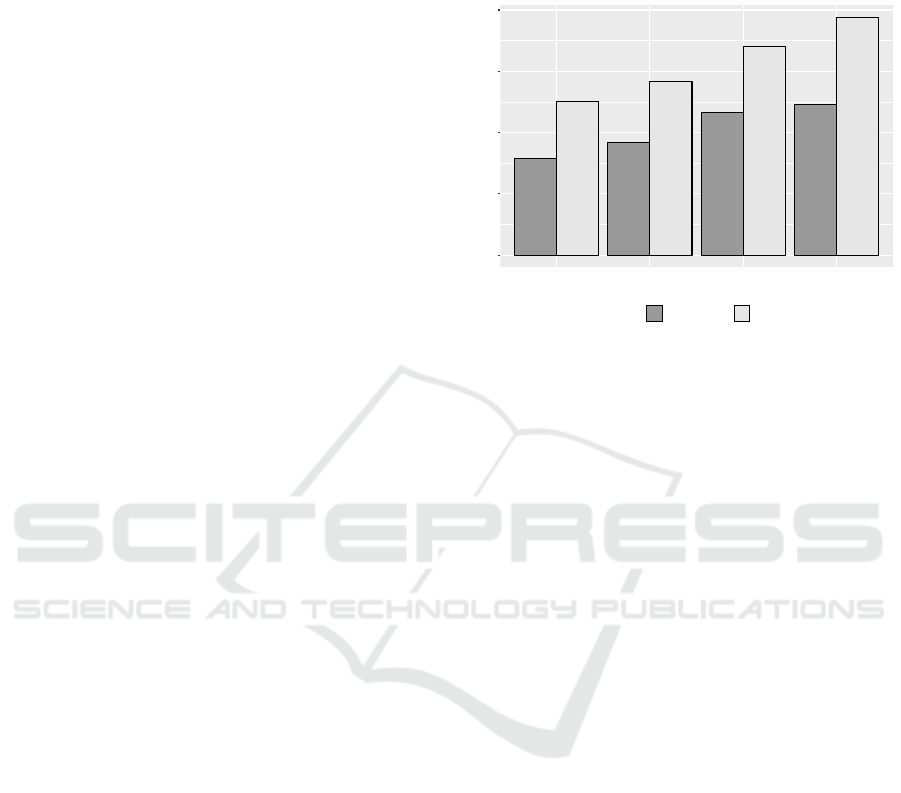
Within all regressions all layout metrics were found
significant predictors for both, clickTime as well as
fixationTime (see Figure 6 for an overview).
0.079
0.126
0.092
0.142
0.116
0.170
0.123
0.194
0.00
0.05
0.10
0.15
0.20
ADC, AAR AAD, AAR RDC, AAR ADC, RDC, AAR
Predictors
Predicted
ClickTime FixationTime
Figure 6: R
2
values for all evaluated models.
6 CONCLUSION
The presented Relative Direction Change metric is
a layout metric that similar to the Average Angular
Displacement metric considers the adjacency and ar-
rangement of shapes in a treemap, but also allows for
a rotation-invariant consideration of layout changes.
Unlike most previously published metrics it focuses
not just on the changes of each individual visual arti-
fact but also on the treemap topology.
6.1 Discussion
The evaluation and analysis show comparable results
(described in Section 5.1) for the layout metrics Av-
erage Aspect Ratio and Average Distance Change
within the implemented layout algorithms compared
to previously published ones, such as in (Bederson
et al., 2002; Tak and Cockburn, 2013). Therefore we
assume the correctness of the implementation of the
used layouting algorithms. In addition, as the results
from Section 5.2 and 5.3 show, Relative Direction
Change seems to be a promising candidate as a lay-
out stability metric for treemaps. Since neither Aver-
age Distance Change nor Relative Direction Change
alone allow for a good reflection of the users recover-
ing tasks — especially for the click time — the use of
other layout metrics such as the Average Aspect Ratio
is an increasing factor in explaining the variances of
the users recovering tasks time. The used regression
models are simple, but show three important things:
IVAPP 2017 - International Conference on Information Visualization Theory and Applications
94

• the prediction of variance (R
2
value) for the re-
covering tasks times increase while using RDC in-
stead of AAD,
• the interaction of RDC together with AAR in-
creases the R
2
value for both, the clickTime and
fixationTime, compared to the use of ADC and
AAR, and
• the interaction of ADC, RDC and AAR addition-
ally increases the R
2
value for both, the clickTime
and fixationTime, compared to the two predictor
models.
Nevertheless, explaining a complex process, e.g., the
used recovering task, with such a simple model seems
to be insufficient and shows the need for a more com-
plex model.
6.2 Future Work
The presented experiment gives first hints in finding
a model for the prescription of a human perception
of treemap layout stability based on layout metrics.
However, more measurement with real life datasets
from different domains needs to be done to expand
the model database and find correlations between sug-
gested measurements. Also, a deeper look in finding
a more complex model needs to be done to increase
the R
2
value. Finally, it is possible to implement more
algorithms (even non-treemap layouts) and run trials
with their resulting depictions.
ACKNOWLEDGEMENTS
The authors would like to thank the anonymous re-
viewers for their valuable comments. This work was
funded by the Federal Ministry of Education and
Research (BMBF), Germany, within the InnoProfile
Transfer research group “4DnD-Vis”.
REFERENCES
Balzer, M. and Deussen, O. (2005). Voronoi treemaps. In
Proceedings of the IEEE Symposium on Information
Visualization (InfoVis 2005).
Bederson, B. B., Shneiderman, B., and Wattenberg, M.
(2002). Ordered and quantum treemaps: Making ef-
fective use of 2d space to display hierarchies. AcM
Transactions on Graphics (TOG), 21(4), pages 833–
854.
Bertin, J. (1983). Semiology of graphics: Diagrams, net-
works, maps.
Bruls, M., Huizing, K., and van Wijk, J. (1999). Squarified
treemaps. In Proceedings of the Joint Eurographics
and IEEE TCVG Symposium on Visualization. Cite-
seer.
Carpendale, M. (2003). Considering visual variables as a
basis for information visualisation.
Ghoniem, M., Cornil, M., Broeksema, B., Stefas,
M., and Otjacques, B. (2015). Weighted maps:
treemap visualization of geolocated quantitative data.
In SPIE/IS&T Electronic Imaging, pages 93970G–
93970G. International Society for Optics and Photon-
ics.
Hahn, S., Trumper, J., Moritz, D., and Dollner, J. (2014).
Visualization of varying hierarchies by stable layout
of voronoi treemaps. In Information Visualization
Theory and Applications (IVAPP), 2014 International
Conference on, pages 50–58. IEEE.
Johnson, B. and Shneiderman, B. (1991). Tree-maps: A
space-filling approach to the visualization of hierar-
chical information structures. In Visualization, 1991.
Visualization’91, Proceedings., IEEE Conference on,
pages 284–291. IEEE.
Kaas, J. H. (1997). Topographic maps are fundamental to
sensory processing. Brain research bulletin, 44(2),
pages 107–112.
Kong, N., Heer, J., and Agrawala, M. (2010). Perceptual
guidelines for creating rectangular treemaps. Visual-
ization and Computer Graphics, IEEE Transactions
on, 16(6), pages 990–998.
Misue, K., Eades, P., Lai, W., and Sugiyama, K. (1995).
Layout adjustment and the mental map. Journal of vi-
sual languages and computing, 6(2), pages 183–210.
Schulz, H.-J. (2011). Treevis. net: A tree visualization ref-
erence. Computer Graphics and Applications, IEEE,
31(6), pages 11–15.
Shneiderman, B. (1992). Tree visualization with treemaps:
2-d space-filling approach. ACM Transactions on
graphics (TOG), 11(1), pages 92–99.
Tak, S. and Cockburn, A. (2013). Enhanced spatial sta-
bility with hilbert and moore treemaps. Visualiza-
tion and Computer Graphics, IEEE Transactions on,
19(1), pages 141–148.
Tu, Y. and Shen, H.-W. (2007). Visualizing changes of hier-
archical data using treemaps. Visualization and Com-
puter Graphics, IEEE Transactions on, 13(6), pages
1286–1293.
Vliegen, R., van Wijk, J. J., and Van der Linden, E.-
J. (2006). Visualizing business data with general-
ized treemaps. Visualization and Computer Graphics,
IEEE Transactions on, 12(5), pages 789–796.
Wattenberg, M. (1999). Visualizing the stock market. In
CHI’99 extended abstracts on Human factors in com-
puting systems, pages 188–189. ACM.
Wattenberg, M. (2005). A note on space-filling visualiza-
tions and space-filling curves. In Information Visu-
alization, 2005. INFOVIS 2005. IEEE Symposium on,
pages 181–186. IEEE.
Wettel, R. and Lanza, M. (2008). Codecity: 3d visual-
ization of large-scale software. In Companion of the
30th international conference on Software engineer-
ing, pages 921–922. ACM.
Wood, J. and Dykes, J. (2008). Spatially ordered treemaps.
IEEE transactions on visualization and computer
graphics, 14(6), pages 1348–1355.
Relative Direction Change - A Topology-based Metric for Layout Stability in Treemaps
95
