
Towards Long-term Monitoring of Atrial Fibrillation using
Photoplethysmography
Birut
˙
e Paliakait
˙
e
1
, Andrius Petr
˙
enas
1
, Jurgita Skibarkien
˙
e
2
, Tomas Mickus
1
, Saulius Daukantas
1
,
Raimondas Kubilius
2
and Vaidotas Marozas
1
1
Biomedical Engineering Institute, Kaunas University of Technology, Kaunas, Lithuania
2
Hospital of Lithuanian University of Health Sciences Kaunas Clinics, Kaunas, Lithuania
Keywords:
Atrial Fibrillation Detection, Sample Entropy, Photoplethysmogram, Wearable Device, Accelerometer.
Abstract:
This study investigates the feasibility of long-term monitoring of atrial fibrillation (AF) using wrist-worn
device, capable of acquiring photoplethysmogram (PPG) and motion data. Moreover, the performance of AF
detectors, initially developed to detect AF in electrocardiogram (ECG) signals, is evaluated on PPG. The study
population consisted of 12 patients undergoing cardiac rehabilitation. Based on accelerometer data, 65% of
recording time was considered as motion-free, which resulted in 86.8 hours of data with AF and 85.4 hours
without. The performance of AF detectors was found to be comparable when both ECG and PPG are used for
constructing heart rhythm series. Considering that 2/3 of monitoring time PPG was of satisfactory quality, the
wrist-worn device has potential to be applied for long-term mass screening of target population.
1 INTRODUCTION
Atrial fibrillation (AF) is a widespread cardiovascu-
lar disease, affecting nearly 3% of adults aged 20
years (Haim et al., 2015). Although AF is not life-
threatening itself, patients suffering from this condi-
tion are more often hospitalized, have an increased
risk of stroke and heart failure (Kirchhof et al., 2016).
AF is a progressive disease, with primary AF episodes
being usually brief, thus timely detection is crucial in
order to start the treatment, i.e., oral anticoagulation.
The majority of AF cases are still identified using
a standard 12-lead electrocardiogram (ECG), which
normally records ECG just for several seconds, thus
only prolonged AF can be detected. Twenty-four hour
Holter monitoring can be prescribed to detect self-
terminating paroxysmal AF, however the adhesive
electrodes and the device connecting wires are un-
comfortable for many patients (Turakhia et al., 2013).
Emerging technologies for data acquisition pro-
vide a possibility to record physiological signals in
a less obtrusive way. For example, it has been shown
that photoplethysmogram (PPG) can be successfully
applied for AF detection, employing the inbuilt ca-
mera of a smartphone (Lee et al., 2013). Several stu-
dies have been conducted to evaluate the suitability
of this technique for mass AF screening (McManus
et al., 2016; Chan et al., 2016). However, by using this
approach, PPG is recorded for short period of time
(1 min). Hence, self-terminating AF events, occur-
ring outside the monitoring period, i.e., during night,
cannot be detected.
The aim of the present study is two-fold: (1) to in-
vestigate the feasibility of long-term monitoring using
wrist-worn device, capable of acquiring PPG, and (2)
to evaluate the performance of the algorithms, initi-
ally developed to detect AF in ECG, but transferred
to PPG. To the best of our knowledge, this paper is
among the first which addresses the question whet-
her PPG-based detection performance is comparable
to that obtained using ECG.
2 MATERIALS AND METHODS
2.1 Wrist-worn Device and Signals
The developed wrist-worn device is capable of syn-
chronously acquiring PPG, motion data (3-axis acce-
leration), and ECG; the later unit is used to obtain re-
ference signals (Fig. 1). ECG, PPG, and motion data
are sampled at 500 Hz, 100 Hz, and 100 Hz, respecti-
vely. An example of synchronously recorded ECG
PaliakaitÄ
˚
U B., PetrÄ
˚
Unas A., SkibarkienÄ
˚
U J., Mickus T., Daukantas S., Kubilius R. and Marozas V.
Towards Long-term Monitoring of Atrial Fibrillation using Photoplethysmography.
DOI: 10.5220/0006115601410146
In Proceedings of the 10th International Joint Conference on Biomedical Engineering Systems and Technologies (BIOSTEC 2017), pages 141-146
ISBN: 978-989-758-212-7
Copyright
c
2017 by SCITEPRESS – Science and Technology Publications, Lda. All rights reserved
141
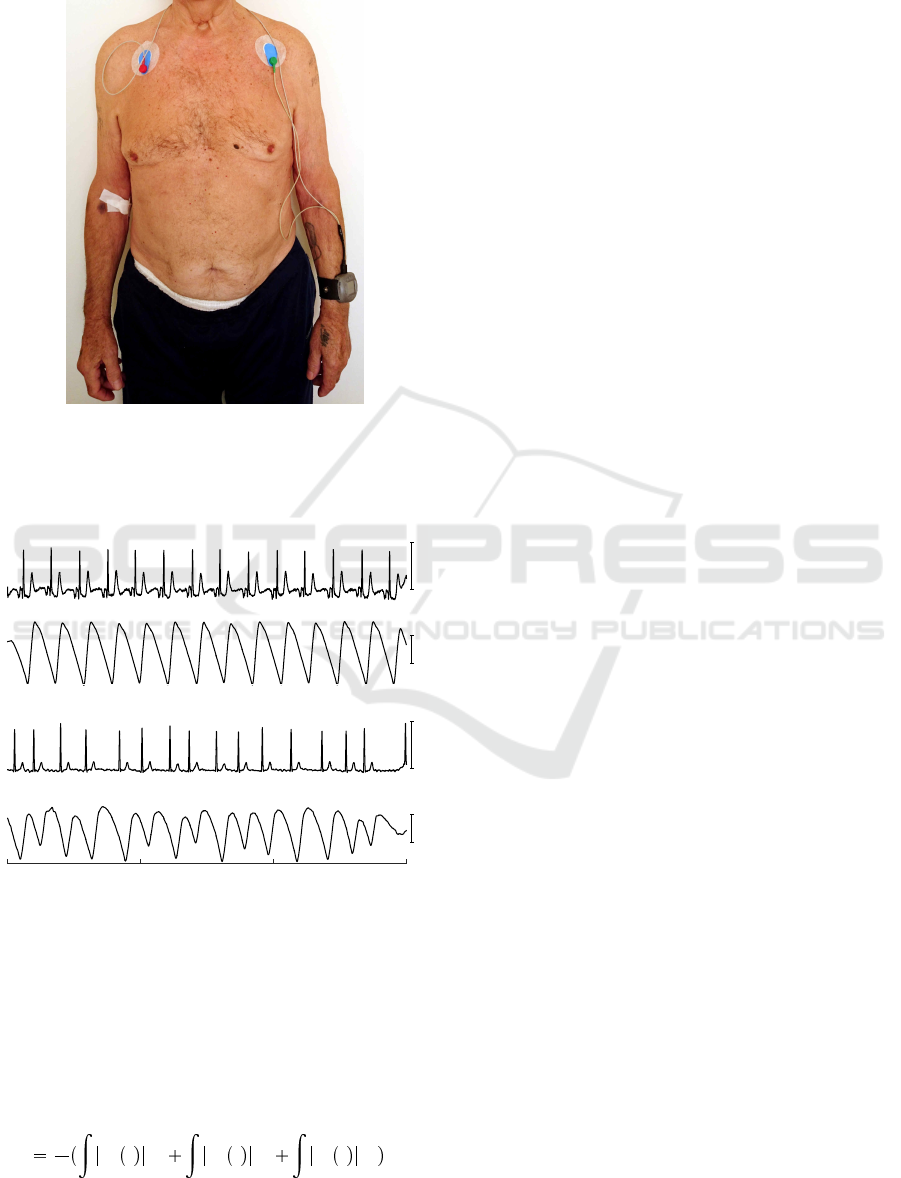
and PPG signals during normal sinus rhythm and AF
are shown in Fig. 2.
Figure 1: Wrist-worn device for acquiring PPG and motion
data. The ECG leads serve for the purpose to obtain refe-
rence signals.
1 mV
(a)
ECG
a.u.
PPG
1 mV
(b)
ECG
a.u.
PPG
Time, s
0 5 10 15
Figure 2: Example of synchronously recorded ECG and
PPG signals during (a) sinus rhythm and (b) AF.
PPG quality is commonly unsatisfactory during
arm motion, thus to properly compare AF detection
performance using different signal sources, motion-
free episodes should only be analysed. According
to (Bouten et al., 1994; Karantonis et al., 2006),
amplitude-integrated motion is defined by,
A
1
T
T
a
x
t dt
T
a
y
t dt
T
a
z
t dt , (1)
where T determines the integration interval, and
a
x
, a
y
and a
z
represent high-pass filtered accelero-
meter output from x, y and z directions, respecti-
vely. Motion corrupted episodes are excluded whene-
ver A exceeds the fixed threshold η. The parameters
T and η were determined empirically and set to 5 s
and 0.12 g units, respectively. The time intervals bet-
ween adjacent heart beats, required for AF detection,
were extracted from motion-free ECG and PPG by
finding peaks of the corresponding waves. The Shan-
non energy envelope was obtained from the norma-
lized ECG (Liang et al., 1997; Manikandan and So-
man, 2012), and the slope sum function was used
to enhance the upslopes of the PPG pulses (Zong
et al., 2016). Then, peaks were detected by applying
the adaptive amplitude-dependent threshold. Since
ECG represents electrical activity of the heart, whe-
reas PPG reflects blood volume pulsation, rhythm in-
formation, extracted from these signals, may differ
in some cases. To make this distinction, time series,
obtained from ECG and PPG, are further referred to
as RR and PP, respectively.
2.2 AF Detectors under Comparison
During AF, the ventricles are activated at irregular
time instances, thus solely hearth rhythm information
can be applied to detect AF. Four approaches to AF
detection are chosen for comparison: Pointcar
´
e plot
(Sarkar et al., 2008), the root mean square of succes-
sive differences (Dash et al., 2009), the coefficient of
sample entropy (Lake and Moorman, 2011) and the
simplified sample entropy (Petr
˙
enas et al., 2015; Stan-
kevi
ˇ
cius et al., 2016). The former three algorithms
have already been employed for PPG-based AF de-
tection (Lee et al., 2013; McManus et al., 2016; Chan
et al., 2016), whereas the later one is among the best
performing.
• Poincar
´
e plot based AF detector (the resulting
output of this detector is denoted by O
P
) was
developed for primary use in implantable devi-
ces (Hindricks et al., 2010). By using this appro-
ach, a sequence of RR intervals is collected and
then represented in the Poincar
´
e plot. Since each
rhythm type takes a specific pattern, a set of rules
is applied to determine which pattern is observed.
• Root mean square of successive differences (O
R
)
is a straight-forward statistical approach used to
evaluate variability of RR intervals. Rhythm va-
riability is usually much higher in AF than that
during regular rhythms, thus the parameter is ex-
pected to take higher values when arrhythmia
occurs.
BIOSIGNALS 2017 - 10th International Conference on Bio-inspired Systems and Signal Processing
142

O
P
0 40 80 120
Count of beats
0
2
4
6
8
10
non-AF
AF
x 10
4
ECG
(a)
O
P
0 40 80 120
Count of beats
0
2
4
6
8
10
non-AF
AF
x 10
4
PPG
O
R
0 0.2 0.4 0.6
Count of beats
0
1
2
3
4
non-AF
AF
x 10
4
(b)
O
R
0 0.2 0.4 0.6
Count of beats
0
1
2
3
4
non-AF
AF
x 10
4
O
C
-3 -2 -1 0 1
Count of beats
0
2
4
6
non-AF
AF
x 10
4
(c)
O
C
-3 -2 -1 0 1
Count of beats
0
2
4
6
non-AF
AF
x 10
4
O
S
0 0.5 1 1.5
Count of beats
0
1
2
3
4
non-AF
AF
x 10
4
(d)
O
S
0 0.5 1 1.5
Count of beats
0
1
2
3
4
non-AF
AF
x 10
4
Figure 3: Distribution of output values of AF detectors during rhythms of non-AF and AF: (a) the Poincar
´
e plot, (b) the root
mean square of successive differences, (c) the coefficient of sample entropy, and (d) the simplified sample entropy.
• Coefficient of sample entropy (O
C
) was proposed
in accordance to the growing interest in detection
of AF in short physiological time series. The coef-
ficient of sample entropy represents repeatability
of RR pattern throughout the RR sequence, thus
entropy increases when repeatability of RR series
is low.
• Simplified sample entropy (O
S
) based AF detec-
tor is similar to the coefficient of sample entropy,
however, such important aspects as suppression of
ectopic beats and bigeminy are accounted. Hence,
false alarm rate due to other irregular rhythms is
reduced.
2.3 Study Population
Two groups of participants were involved at Kulau-
tuva Rehabilitation Hospital of Kaunas Clinics, Lit-
huania. The first group consisted of 6 patients with
AF, 71.8 9.2 years old, with body-mass index
29.2 3.6 kg/m
2
, total monitoring time 127.5 hours
(21.3 2.6 hours per patient). The second group con-
sisted of 6 patients without AF, 64.3 9.4 years old,
with body-mass index 30.5 6.7 kg/m
2
, total moni-
toring time 136.1 hours (22.7 2.8 hours per patient).
This study was approved by Kaunas Region Biomedi-
cal Research Ethics Committee (No. BE-2-20).
2.4 Performance Measures
The performance was investigated in terms of sensiti-
vity (Se), specificity (Sp) and positive predictive value
(PPV). Sensitivity is defined by the number of cor-
rectly detected AF beats divided by the total number
of AF beats. Specificity is defined as the number of
correctly detected non-AF beats divided by the total
number of non-AF beats. Positive predictive value is
the number of correctly detected AF beats divided by
the total number of beats detected as AF.
3 RESULTS
3.1 Evaluation of AF Detectors
Motion-free data covered 65.4% 5.7% of recording
time on average. This resulted in 86.8 hours of data
with AF and 85.4 hours without AF.
Figure 3 displays the distribution of the output va-
lues of the detectors under investigation for AF and
non-AF rhythms using RR and PP series as an input.
The results suggest that incorrectly detected peaks in
PPG increase irregularity in non-AF PP sequence,
thus leading to slightly higher output values.
Table 1: Sensitivity, specificity and positive predictive
value for different AF detectors, evaluated on ECG
and PPG signal database. The results are obtained
for the fixed detection window of 128 beats. The de-
tection thresholds are set to the same values as used
in the original studies.
Methods
ECG PPG
Se, % Sp, % PPV, % Se, % Sp, % PPV, %
O
P
99.9 81.3 88.2 99.9 78.9 86.3
O
R
100 64.3 79.6 100 66.2 79.6
O
C
100 82.2 88.7 100 80.4 87.1
O
S
99.4 89.9 93.2 99.9 91.5 94.0
Towards Long-term Monitoring of Atrial Fibrillation using Photoplethysmography
143
RR, s
0
1
2
(a)
O
S
non-AF
AF
PP, s
0
1
2
(b)
O
S
non-AF
AF
Time, min
0 5 10 15 20 25 30 35 40 45 50
A, g
0
0.1
0.2
(c)
η
Figure 4: Example of self-terminating paroxysmal AF detection using (a) ECG and (b) PPG. AF episodes are marked with
arrows. A grey line represents the output O
S
of the simplified sample entropy. A black solid line stands for threshold based
AF detection. The window length for this example was set to 8 beats. Motion corrupted data are rejected when amplitude-
integrated motion A exceeds the threshold η (c).
Table 1 shows that AF detection performance is
comparable when both ECG and PPG are used to con-
struct rhythm series. Nevertheless, misdetected pulse
peaks during non-AF resulted in approximately 2%
lower specificity for O
P
and O
C
. On the other hand,
somehow surprisingly, specificity slightly increased
for O
R
and O
S
. This can be explained by the fact that
ECG quality for one patient with non-AF was lower
compared to synchronously recorded PPG. The best
performance on PPG database is achieved by the sim-
plified sample entropy based AF detector O
S
with Se,
Sp, and PPV of 99.9%, 91.5%, and 94.0%, respecti-
vely.
3.2 Paroxysmal AF Detection
Figure 4 displays the performance of the simplified
sample entropy based detector on synchronously re-
corded ECG and PPG signals with recurrent self-
terminating AF episodes. Even though RR and PP
series are slightly different, it has only minor influ-
ence on AF detection. All AF episodes are detected
when RR series is used as an input to the algorithm,
whereas 15 out of 18 episodes are detected when PP
series is applied instead. The shortest detected AF
episode is of 38 beats (25 seconds).
4 DISCUSSION
To this day, no guidelines exist on arrhythmia inter-
pretation on PPG, thus the presence of AF must be
confirmed by analysing ECG (Kirchhof et al., 2016).
However, unobtrusive PPG-based monitors can be va-
luable for mass screening of patients older than 65 ye-
ars. Then, the diagnosis could be verified by using the
established technique, such as 24-hour Holter monito-
ring.
This pilot study is a step towards evaluating AF
diagnostic accuracy of PPG technology implemented
into wearable device (Carpenter and Frontera, 2016).
Our preliminary results show that AF detectors, de-
veloped for ECG analysis, can be successfully app-
lied to motion-free PPG signals. Although, the pulse
wave of PPG is much smoother than the QRS com-
plex of ECG, an inaccurate detection of fiducial point
has only slight effect on the overall performance of
AF detectors.
Motion artefacts have large impact on distorting
PPG shape, and often lead to incorrect beat detection.
On the other hand, substantial changes in PPG mor-
phology can be encountered during other types of ar-
rhythmia, i.e., bigeminy (see Fig. 5). These morpho-
logical changes result in different heart rhythm com-
pared to that obtained from the ECG. This limitation
of the PPG-based technology could also be viewed as
an opportunity to develop the PPG-specified AF de-
tector.
BIOSIGNALS 2017 - 10th International Conference on Bio-inspired Systems and Signal Processing
144
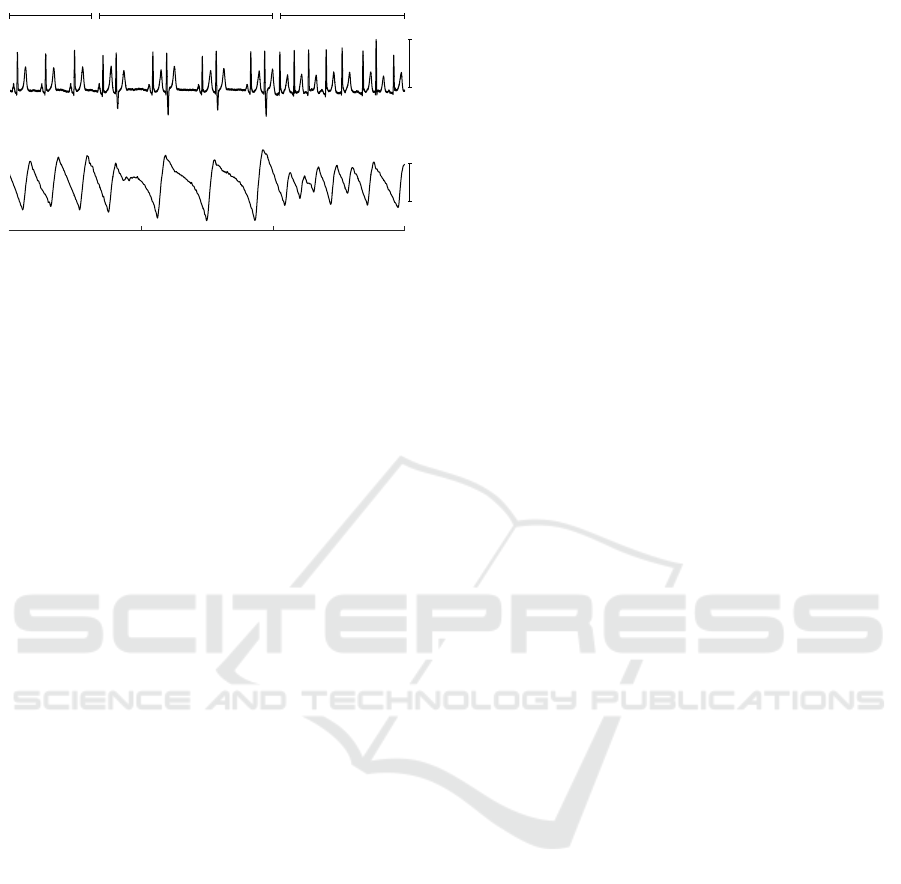
1 mV
Sinus rhythm Bigeminy Atrial fibrillation
ECG
a.u.
PPG
Time, s
0 5 10 15
Figure 5: ECG and PPG during sinus rhythm, bigeminy and
AF. Note, that only every second beat is reflected in the PPG
during bigeminy.
The present study was performed on a population
undergoing cardiac rehabilitation. Considering that
older patients with cardiovascular condition are less
physically active, this allowed us to obtain 2/3 of the
total recording time suitable for analysis. Our fin-
dings are similar to those reported in another study,
where about 36% of the monitoring time was rejected
from analysis (Bonomi et al., 2016). Nevertheless,
larger amounts of corrupted data could be expected
when more active individuals are enrolled. There-
fore, only proper dealing with motion artefacts could
move this technology to home-based screening appli-
cations (Steinhubl et al., 2016).
Limitations of the present study are small num-
ber of patients and the homogeneity of the recordings.
During monitoring, patients experienced either nor-
mal rhythm or AF, thus the performance of AF detec-
tors was not investigated on recordings with paroxys-
mal AF.
5 CONCLUSIONS
This pilot study suggests that AF detectors, initially
developed for analysis of ECG signals, can success-
fully be applied for the use of PPG signals. Conside-
ring that 2/3 of monitoring time PPG was of satisfac-
tory quality, the wrist-worn device has potential to be
applied for long-term mass screening of target popu-
lation.
ACKNOWLEDGEMENTS
This research was funded by the grants from the Re-
search Council of Lithuania (No. MIP088/15), and
the European Commission Framework Programme 7
(No. 611140).
REFERENCES
Bonomi, A. G., Schipper, F., Eerik
¨
ainen, L. M., Marga-
rito, J., Aarts, R., Babaeizadeh, S., de Morree, H.,
and Dekker, L. (2016). Atrial fibrillation detection
using photo-plethysmography and acceleration data at
the wrist. Computing in Cardiology, 43:277–280.
Bouten, C., Westerterp, K., Verduin, M., and Janssen, J.
(1994). Assessment of energy expenditure for physi-
cal activity using a triaxial accelerometer. Medicine
and Science in Sports and Exercise, 23(1):21–27.
Carpenter, A. and Frontera, A. (2016). Smart-watches: a
potential challenger to the implantable loop recorder?
Europace, 18(6):791–793.
Chan, P.-H., Wong, C.-K., Poh, Y. C., Pun, L., Leung,
W. W.-C., Wong, Y.-F., Wong, M. M.-Y., Poh, M.-
Z., Chu, D. W.-S., and Siu, C.-W. (2016). Diagnostic
performance of a smartphone-based photoplethysmo-
graphic application for atrial fibrillation screening in a
primary care setting. Journal of the American Heart
Association, 5(7).
Dash, S., Chon, K., Lu, S., and Raeder, E. (2009). Automa-
tic real time detection of atrial fibrillation. Annals of
Biomedical Engineering, 37:1701–1709.
Haim, M., Hoshen, M., Reges, O., Rabi, Y., Balicer, R., and
Leibowitz, M. (2015). Prospective national study of
the prevalence, incidence, management and outcome
of a large contemporary cohort of patients with in-
cident non-valvular atrial fibrillation. Journal of the
American Heart Association, 4(1).
Hindricks, G., Pokushalov, E., Urban, L., Taborsky, M.,
Kuck, K.-H., Lebedev, D., Rieger, G., Prerfellner,
H., and on behalf of the XPECT Trial Investigators
(2010). Performance of a new leadless implantable
cardiac monitor in detecting and quantifying atrial fi-
brillation results of the XPECT trial. Circulation: Ar-
rhythmia and Electrophysiology, 3(2):141–147.
Karantonis, D. M., Narayanan, M. R., Mathie, M., Lovell,
N. H., and Celler, B. G. (2006). Implementation of
a real-time human movement classifier using a triax-
ial accelerometer for ambulatory monitoring. IEEE
Transactions on Information Technology in Biomedi-
cine, 10(1):156–167.
Kirchhof, P., Benussi, S., Kotecha, D., Ahlsson, A., Atar,
D., Casadei, B., Castella, M., Diener, H.-C., Heidbu-
chel, H., Hendriks, J., Hindricks, G., Manolis, A. S.,
Oldgren, J., Popescu, B. A., Schotten, U., Van Putte,
B., and Vardas, P. (2016). 2016 ESC Guidelines for
the management of atrial fibrillation developed in col-
laboration with EACTS. European Heart Journal.
Lake, D. E. and Moorman, J. R. (2011). Accurate esti-
mation of entropy in very short physiological time
series: The problem of atrial fibrillation detection
in implanted ventricular devices. American Journal
of Physiology - Heart and Circulatory Physiology,
300(1):H319–H325.
Lee, J., Reyes, B., McManus, D., Mathias, O., and Chon, K.
(2013). Atrial fibrillation detection using an iPhone
4S. IEEE Transactions on Biomedical Engineering,
60(1):203–206.
Towards Long-term Monitoring of Atrial Fibrillation using Photoplethysmography
145

Liang, H., Lukkarinen, S., and Hartimo, I. (1997). Heart
sound segmentation algorithm based on heart sound
envelogram. In Computers in Cardiology 1997, pages
105–108.
Manikandan, M. and Soman, K. (2012). A novel method for
detecting R-peaks in electrocardiogram (ECG) signal.
Biomedical Signal Processing and Control, 7(2):118
– 128.
McManus, D. D., Chong, J. W., Soni, A., Saczynski, J. S.,
Esa, N., Napolitano, C., Darling, C. E., Boyer, E., Ro-
sen, R. K., Floyd, K. C., and Chon, K. H. (2016).
PULSE-SMART: Pulse-based arrhythmia discrimina-
tion using a novel smartphone application. Journal of
Cardiovascular Electrophysiology, 27(1):51–57.
Petr
˙
enas, A., Marozas, V., and S
¨
ornmo, L. (2015). Low-
complexity detection of atrial fibrillation in continu-
ous long-term monitoring. Computers in Biology and
Medicine, 65:184 – 191.
Sarkar, S., Ritscher, D., and Mehra, R. (2008). A detector
for a chronic implantable atrial tachyarrhythmia mo-
nitor. IEEE Transactions on Biomedical Engineering,
55(3):1219–1224.
Stankevi
ˇ
cius, D., Petr
˙
enas, A., Solo
ˇ
senko, A., Grigutis,
M., Janu
ˇ
skevi
ˇ
cius, T., Rim
ˇ
sevi
ˇ
cius, L., and Marozas,
V. (2016). Photoplethysmography-based system for
atrial fibrillation detection during hemodialysis. In
XIV Mediterranean Conference on Medical and Bio-
logical Engineering and Computing 2016, pages 79–
82.
Steinhubl, S. R., Mehta, R. R., Ebner, G. S., Ballesteros,
M. M., Waalen, J., Steinberg, G., Jr., P. V. C., Feli-
cione, E., Carter, C. T., Edmonds, S., Honcz, J. P.,
Miralles, G. D., Talantov, D., Sarich, T. C., and Topol,
E. J. (2016). Rationale and design of a home-based
trial using wearable sensors to detect asymptomatic
atrial fibrillation in a targeted population: The mHe-
alth Screening To Prevent Strokes (mSToPS) trial.
American Heart Journal, 175:77 – 85.
Turakhia, M. P., Hoang, D. D., Zimetbaum, P., Miller, J. D.,
Froelicher, V. F., Kumar, U. N., Xu, X., Yang, F., and
Heidenreich, P. A. (2013). Diagnostic utility of a novel
leadless arrhythmia monitoring device. The American
Journal of Cardiology, 112(4):520 – 524.
Zong, W., Nielsen, L., Gross, B., Brea, J., and Frassica, J.
(2016). A practical algorithm to reduce false critical
ECG alarms using arterial blood pressure and/or pho-
toplethysmogram waveforms. Physiological Measu-
rement, 37(8):1355–1369.
BIOSIGNALS 2017 - 10th International Conference on Bio-inspired Systems and Signal Processing
146
