
Measuring the Performance of Push-ups
Qualitative Sport Activity Recognition
Sebastian Baumbach and Andreas Dengel
German Research Center for Artificial Intelligence, Kaiserslautern, Germany
University of Kaiserslautern, Kaiserslautern, Germany
Keywords:
Sensor Data, Spatial-temporal Data, Data Mining, Naive Bayes.
Abstract:
The trend of mobile activity monitoring using widely available technology is one of the most blooming con-
cepts in the recent years. It supports many novel applications, such as fitness games or health monitoring. In
these scenarios, activity recognition tries to distinguish between different types of activities. However, only
little work has focused on qualitative recognition so far: How exactly is the activity carried out? In this paper,
an approach for supervising activities, i.e. qualitative recognition, is proposed. The focus lied on push-ups as
a proof of concept, for which sensor data of smartphones and smartwatches were collected. A user-dependent
dataset with 4 participants and a user-independent dataset with 16 participants were created. The performance
of Naive Bayes classifier was tested against normal, kernel and multivariate multinomial probability distribu-
tions. An accuracy of 90.5% was achieved on the user-dependent model, whereas the user-independent model
scored with an accuracy of 80.3%.
1 INTRODUCTION
Physical activity is commonly known to be essential
for keeping a healthy physical and mental state. Many
people from almost all age groups seek to join ex-
ercise programs for that specific reason. McClaran
examined the impact of professional trainers on ex-
ercisers’ motivation to perform sport activities. Ac-
cording to this study, 73% of the participants showed
significant improvement in their willingness for ex-
ercising while 1% showed decrease in their willing-
ness. For his investigation, 129 clients joined a 10-
week training program with a pre-evaluation and a
post-evaluation of motivational willingness for exer-
cise adoption with the assistance of a senior univer-
sity personal trainer. The study confirms a positive
relation between one-to-one personal training and the
willingness for training (McClaran, 2001).
Issues arouse when it comes to a personal trainer. On
the one hand, hiring a personal trainer is expensive
especially when hiring a professional trainer. On the
other hand, meeting with the trainer on a regular ba-
sis could be inefficient from the time point of view
since one would have to adjust his or her schedule ac-
cording to the trainer. Those problems can be avoided
with a system that functions as a personal trainer. A
system that is able to detect incorrect exercise per-
formances has great potential to support both profes-
sional and amateur athletes in increasing the safety
and efficiency of their routines.
The applications focus in this study lies on push-ups
which are well known among athletes and a com-
mon practice performed by many people. The per-
sonal trainer was embedded in the exerciser’s smart-
phone and smartwatch which are widely available
nowadays. With recent advances and progress in the
wearable technologies, it is possible to integrate such
a human activity recognition system in wearable de-
vices (Ravi et al., 2005; Shoaib et al., 2013; Yang,
2009). However, the system has to recognize a much
narrower range of physical activity spectrum where
all activities mainly fall under the same activity type,
e.g. too fast or too slow instead of walking or role-
jumping. This leads to the research question, how ac-
curate are activity recognition systems when it comes
to a very narrow spectrum of activities?
In this paper, an approach for qualitative recogni-
tion of push-ups is proposed that determines differ-
ent common error types while performing push-ups
(Section 3). Therefore, two experiments were done to
collect data from 20 participants using a smartphone
placed in pant pocket and a smartwatch worn on the
wrist. (Section 4). A Naive Bayes classifier with dif-
ferent probability distributions was evaluated in order
374
Baumbach S. and Dengel A.
Measuring the Performance of Push-ups - Qualitative Sport Activity Recognition.
DOI: 10.5220/0006114503740381
In Proceedings of the 9th International Conference on Agents and Artificial Intelligence (ICAART 2017), pages 374-381
ISBN: 978-989-758-220-2
Copyright
c
2017 by SCITEPRESS – Science and Technology Publications, Lda. All rights reserved

to find the best recognition accuracy (Section 5). Fi-
nally, the results show that this approach is able to
supervise push-ups in principle. In the future, the
proposed approach can be transferred to other sport
activities (Section 6).
2 RELATED WORK
While human activity supervision is a relatively new
research field that gets mainly attention from re-
searchers in the medical rehabilitation domain, hu-
man activity recognition has been researched for
years and many approaches were tried in this area. To
the author’s best knowledge, no previous research had
focused on a classifier recognizing different types of
push-up so as to distinguish incorrect ones from cor-
rect ones.
2.1 Human Activity Recognition
Past work focused on the use of multiple accelerome-
ters placed on several parts of the user’s body, for ex-
ample (Bao and Intille, 2004; Bao and Intille, 2004;
Krishnan et al., 2008; Parkka et al., 2006; Subra-
manya et al., 2012). These systems using multiple ac-
celerometers and other sensors were capable of identi-
fying a wide range of activities. Other studies focused
on the use of a single accelerometer for activity recog-
nition (Lee, 2009; Long et al., 2009). All of these
studies used devices specifically made for research
purposes. Several investigations have considered the
use of widely available mobile devices. (Lester et al.,
2006; Ravi et al., 2005). However, the data was gener-
ated using distinct accelerometer-based devices worn
by the user and then sent to the phone for storage.
Various studies took advantage of the sensors incor-
porated into the phones themselves in order to distin-
guish between diverse activities (Brezmes et al., 2009;
Rasekh et al., 2014; Sefen et al., 2016; Shoaib et al.,
2013; Yang, 2009). Saponas et al. have developed
a platform called iLearn that uses the Apple iPhone’s
three-axial accelerometer along with the Nike+iPod
fitness tracker embedded in the user’s training shoe
for human activity recognition (Saponas et al., 2008;
Witten and Frank, 2005). The system scored with an
accuracy of 99.48% for user-dependent models
1
and
97.4% for user-independent models
2
.
1
The training samples and test samples belonged to the
same person.
2
The training data is different from the test data.
2.2 Human Activity Supervision
Michahelles et al. have used accelerometers, gy-
roscopes and force-sensing resistors to help skiers
and their trainers share the impressions and obser-
vations during exercise (Michahelles and Schiele,
2005). Kuntze et al. used foot contact data col-
lected from a pressure sensor embedded in sprinters’
spikes in order to aid the coaches with required data
such as velocity, step frequency and limb asymme-
tries (Kuntze et al., 2009). Chang et al. embedded a
tri-axial accelerometer in the exerciser’s glove in or-
der to obtain data about weightlifting activities and
help the exerciser count his repetitions (Chang et al.,
2007). In addition, novel research has been done on
energy consumption estimation during workouts for
proper measurement of exercise capacity and inten-
sity (Albinali et al., 2010; Campbell and Choudhury,
2012).
Moeller et al. have produced an automated personal
trainer for the balance board exercises (M
¨
oller et al.,
2012). Gymskill is an Android phone application that
uses the phone’s sensing capabilities in order to as-
sess the exerciser’s performance on the balance board.
Before the exercise, the smartphone needs to be cali-
brated for the specific type of exercising board since
all balance boards are different.
3 METHODOLOGY
The approach used in this paper is based on the work
of Sefen et al., but some modifications were required
in order to enable their recognition system for ac-
tivity supervision (Sefen et al., 2016). This section
mainly focuses on the proposed enhancements and
only briefly introduces the overall architecture.
3.1 Supervision: Qualitative Activity
Recognition
The activity recognition system was developed for
and tested against recognizing activities (such as
walking, jogging, and idle) as well as sports activi-
ties (such as push-ups, rope jumping, crunches and
squats). The spectrum of activities recognized by this
system is wider than the one subjected in this study
where all activities are push-up activities. Figure 1
shows the comparison between sensor values from the
phone’s accelerometer. The similarities between two
different push-up activities (half-bottom push-ups in
Fig. 1a and half-top push-ups in Fig. 1b) make dis-
crimination among them a harder task than distinction
Measuring the Performance of Push-ups - Qualitative Sport Activity Recognition
375
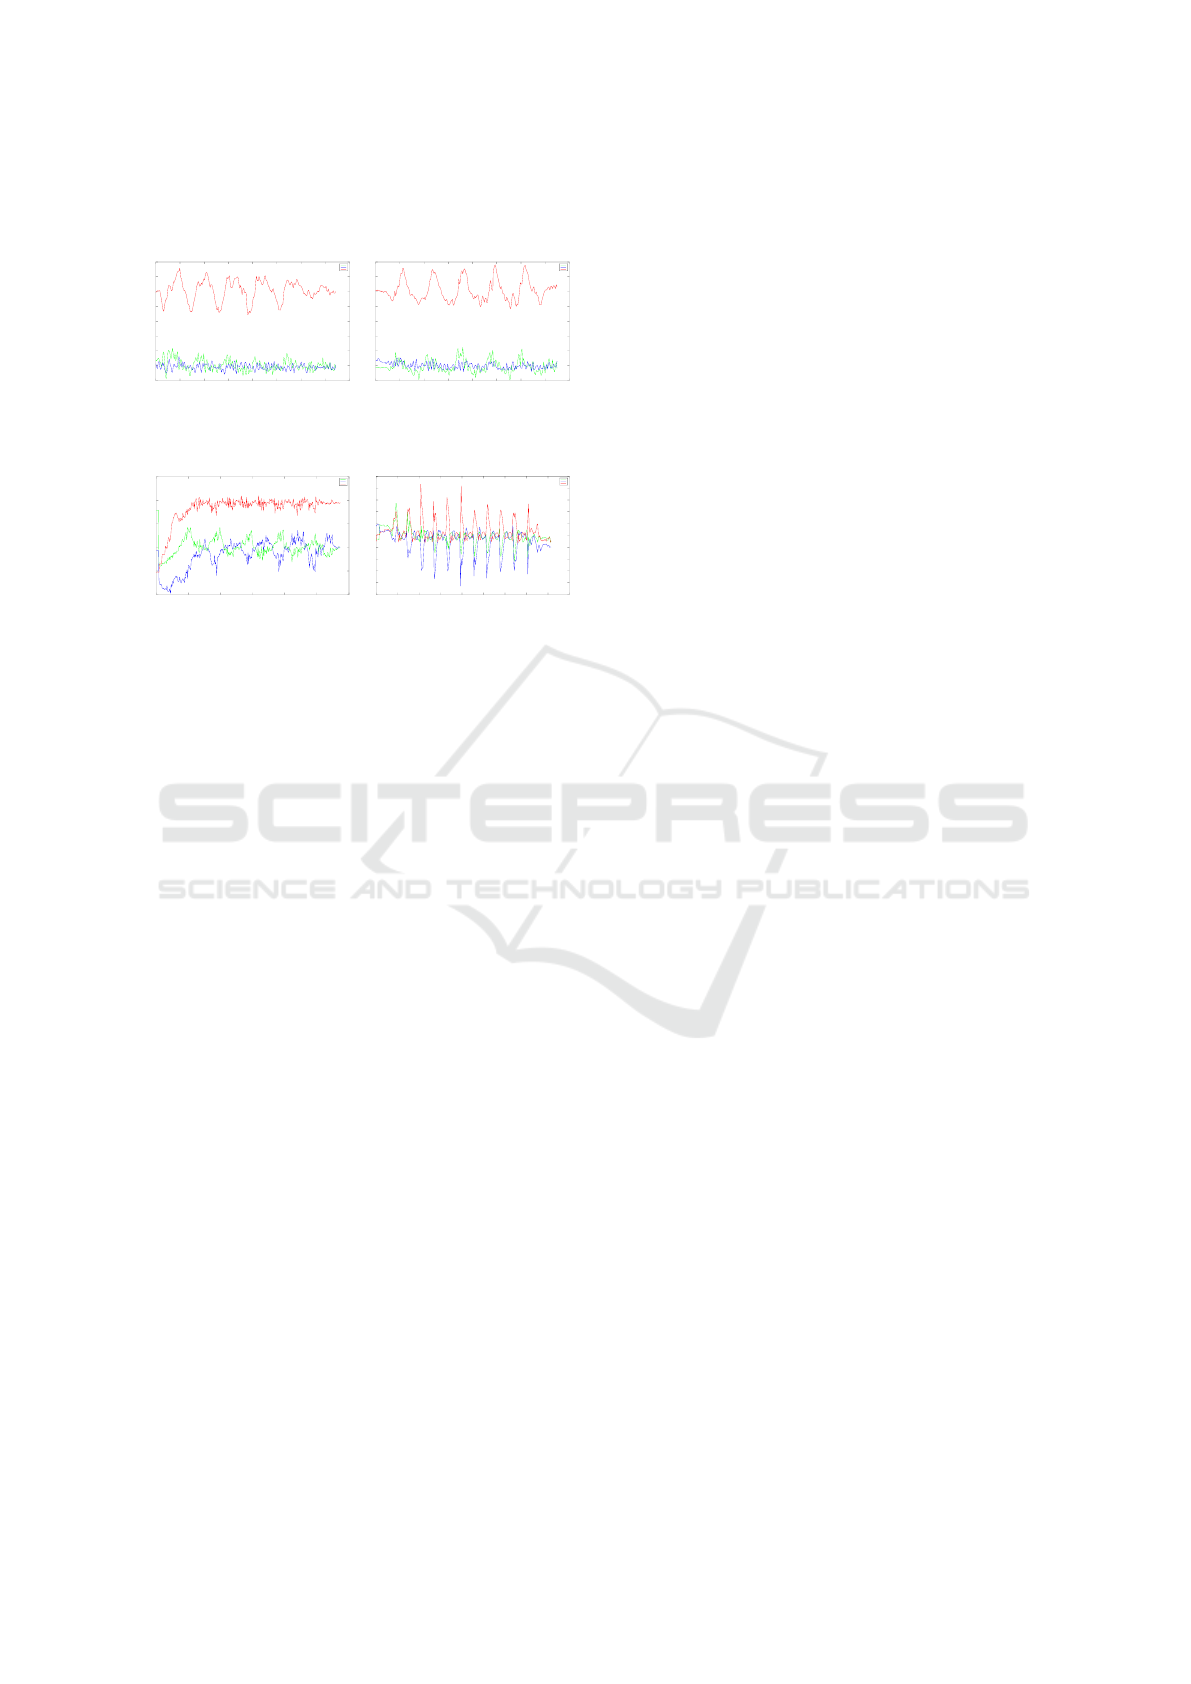
between Crunches (Fig. 1c) and Rope-jumping (Fig.
1d).
Time (s)
0 1 2 3 4 5 6 7 8
Acceleration (m/s
2
)
-2
0
2
4
6
8
10
12
14
x
y
z
(a) Phone’s accelerometer
data for Halfbottom Push-
ups.
Time (s)
0 1 2 3 4 5 6 7 8
Acceleration (m/s
2
)
-2
0
2
4
6
8
10
12
14
x
y
z
(b) Phone’s accelerometer
data for Halftop Push-ups.
Time (s)
0 2 4 6 8 10 12
Acceleration (m/s
2
)
-10
-5
0
5
10
15
x
y
z
(c) Phone’s accelerometer
data for crunches activity.
Time (s)
0 1 2 3 4 5 6 7 8 9
Acceleration (m/s
2
)
-50
-40
-30
-20
-10
0
10
20
30
40
50
x
y
z
(d) Phone’s accelerometer
data for Rope-jumping ac-
tivity.
Figure 1: Comparison between the phone’s accelerometer
data from two push-up activities and other sports activities.
3.2 Preprocessing
The original system measures only linear accelera-
tion in the three major directions (X,Y and Z). All the
examined push-up activities contain slight rotational
movements, where the foot of the exerciser is the
pivot and the movement is performed around it. Ac-
cordingly, two new sensors were incorporated: gyro-
scopes and orientation sensors. The gyroscope mea-
sured the rate of rotation around the three major axes
(X, Y and Z) in
rad
/s. The orientation sensor measures
the angle in degrees around the three major axes. As
suggested in the original approach, the sensors were
sampled with a constant frequency of 10 Hz and seg-
mented with a window size of 5 seconds.
Because of the sensors’ inaccuracy and noise in the
sensors’ signals as well as some unexpected behavior
of the users during the exercise, noisy values in the ac-
celerometer data were observed. Thus, a median filter
of order 3 was again used to move the noise, since
median filters perform well on such impulse noises
(Wang et al., 2011).
3.3 Feature Extraction
A specific set of features is extracted from each seg-
ment for the magnitude component as well as for each
of the three signals A
x
, A
y
, A
z
. Hence, each feature
type is extracted eight times, i.e. each type (accel-
eration, orientation, and gyroscope) for each device
(phone and watch).
In the time domain, the following statistical features
are computed: Mean, Minimum, Maximum, Range,
Standard Deviation, and Root-Mean-Square. For the
frequency domain, the dominant and the second dom-
inant frequencies were extracted by performing a fast
Fourier transform (FFT) (Sharma et al., 2008).
To sum up, eight different types of features are com-
puted, six from the time domain and two from the fre-
quency domain. Since each feature type is extracted
from four components, 32 features will be used to de-
scribe each sensor type, i.e. acceleration, orientation,
and gyroscope. Finally, the features computed from
both the phone’s and the watch’s sensors will be com-
bined, producing a 192 value feature vector.
3.4 Naive Bayes Classifier
The Naive Bayes Classifier is one of the most simple
and low-cost classifiers, at the same time, providing
similar results in comparison to complex classifiers
(Langley et al., 1992). The original system suggests
using Naive Bayes, but have not configured the Naive
Bayes classifier with the appropriate probability dis-
tribution. Adjusting the probability distribution is cru-
cial for better classification accuracy, since the classi-
fied data is continuous (John and Langley, 1995; Juan
and Ney, 2002). Therefore, normal, kernel, and mul-
tivariate, multinomial probability distributions were
evaluated in this study according to their recognition
accuracy.
4 EXPERIMENTAL SETUP
The conducted experiments focused on collecting
data of correct and incorrect push-up activities from
participants.
4.1 Devices
The Samsung Galaxy phone along with the Samsung
Gear Live were the used devices for this study. A
standalone Android application was developed for the
wear and a mobile Android application was devel-
oped for the phone. To make the system as realistic as
possible, the norm positions of the used devices were
chosen. The phone is placed in the exerciser’s right
front pocket and the watch is worn on the exerciser’s
left wrist.
ICAART 2017 - 9th International Conference on Agents and Artificial Intelligence
376
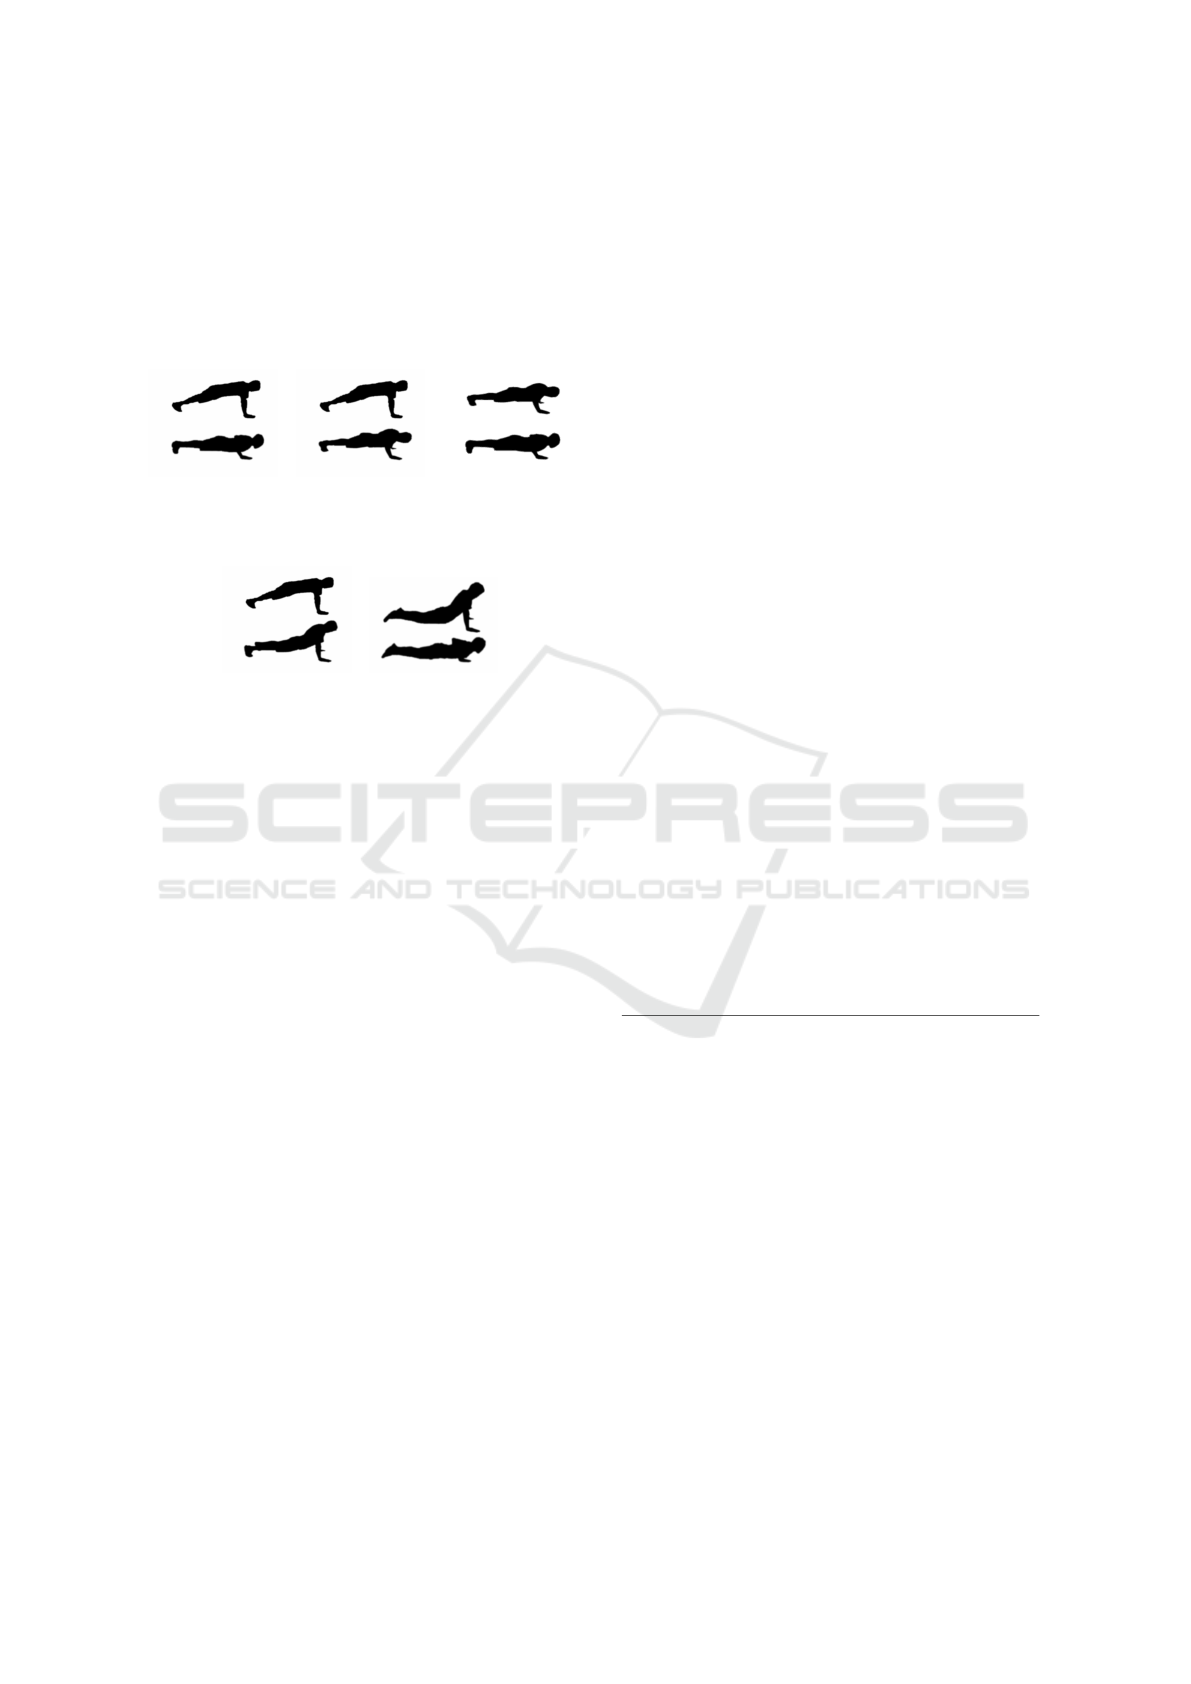
4.2 Activities
According to the fitness experts at the fitness center
at Technical University in Kaiserslautern, Germany,
those are the common mistakes exercisers commonly
do. Figure 4.3 shows an illustration of all the activities
examined in this study.
(a) Normal, Fast
and Slow Push-
ups
(b) Half-top
Push-ups
(c) Half-bottom
Push-ups
(d) Lower-body
Push-ups
(e) Upper-body
Push-ups
Figure 2: Illustrations of the different push-up types per-
formed by the participants.
Normal Push-ups are defined in this study as the
standard push-up technique, where the exerciser’s
feet-tips and hands are on the floor. The width of
the arms is shoulder-wide. During the exercise, the
exerciser should be bending his elbows till the chest
is almost on the ground between the hands. The ex-
erciser’s body and core should be kept tight and not
bent at any point of the movement (fig. 2a). The ex-
ercise should be one at the user’s average pace.
Fast Push-ups look exactly like the normal push-up
exercise if the type of movement is considered. How-
ever, they are performed at a much higher pace.
Slow Push-ups also look exactly like normal and fast
push-ups regarding the type of movement. However,
they are performed at a slow pace.
Half-top Push-ups is the first type of wrong push-
ups the system is recognizing. In contrast to nor-
mal push-up, the movement differs in the fact that the
body is not lowered completely till the body almost
touches the ground. Instead, the exerciser slightly
bends his/her elbows and raises his body again (fig.
2b).
Half-bottom Push-ups are wrong in the sense as half-
top push-up because the exerciser is also doing just
half of the correct movement. The exerciser does
lower his/her body completely till almost touching the
ground, however on the way up, the arms are not fully
stretched (fig. 2c).
Lower-body Push-ups are wrong because the user is
just using his lower-body while performing push-ups.
Arms are kept stretched throughout the exercise. The
exerciser lowers and lifts the lower-body only (fig.
2d).
Upper-body Push-ups are wrong in the same sense as
lower-body push-ups because the exerciser is training
only one half of the body, the upper-body only. The
lower-body till the hips lies completely on the ground
throughout the exercise. Only the upper-body is being
lowered and lifted (fig. 2e).
4.3 Participants
Two different experiments were conducted in order to
examine possible configuration of the system. Table
1 shows the demographics of the participants.
User-dependent configuration: In this experi-
ment, the train data and the test data belong to the
same participant. Four male participants were asked
to perform in 10 sets of exercise where each set con-
sisted of 5 repetitions of each of the seven push-up
types. This resulted in a total of 350 repetitions for
all the push-up types per user. Since four users partic-
ipated in this experiment, a total of 1400 repetitions
were collected for this experiment.
User-independent configuration: In this experiment,
the train and test data belonged to different partici-
pants. 14 male and two female participants took part
in this experiment. Each user performed three sets of
the above mentioned sets resulting in 1680 repetition
for this experiment.
Table 1: The details of the collected recordings for each
activity type.
Attribute User-dependent User-independent
Age(years) 21 − 22
(21.75 ± 0.5)
19 − 33
(23.88 ± 3.59)
Weight(kg) 74 − 82
(77.5 ± 3.4)
59 − 95
(75.88 ± 10.87)
Height(cm) 174 − 180
(175.75 ± 2.87)
158 − 195
(177.63 ± 8.95)
BMI(kg/m
2
) 24.4 − 25.5
(25.13 ± 0.52)
20.4 − 29.7
(24.01 ± 2.41)
4.4 Cross Validation
Testing a classification model on the same dataset it
was trained on, leads to imprecise results (Babyak,
2004). Esterman et al. have found that LOPOCV
solves the problems of training and test data being ex-
tracted from the same dataset for fMRI data analysis,
where the tested subjects are unseen for the model
(Esterman et al., 2010). The problem that Ester-
man et al. faced is similar to the one in this study,
Measuring the Performance of Push-ups - Qualitative Sport Activity Recognition
377
since the model should be trained for unseen exer-
cisers. This is why LOPOCV was used. However,
Baumann et al. showed in their study about cross
validation that LOPOCV has an overfitting drawback
(Baumann, 2003). As they suggest it is a best prac-
tice to combine LOPOCV with another type of cross
validation. This is why a k-fold cross validation is
used for this study, where k is the number of training
sets mentioned in section 4.3. Hence, for the user-
dependent experiment it is a 10-fold cross validation
method and for the user-independent experiment it is
a 48-fold cross validation method.
5 EVALUATION
Several evaluations were conducted in order to inves-
tigating the feasibility of creating an automated per-
sonal trainer embedded in the exerciser’s smartphone
and smartwatch. Thus, the focus of the evaluation lies
on the recognition accuracy.
5.1 User-dependent Model
10-fold cross validation technique was used for each
of the four users contained in this dataset and the per-
formance is evaluated over the average of these four
participants.
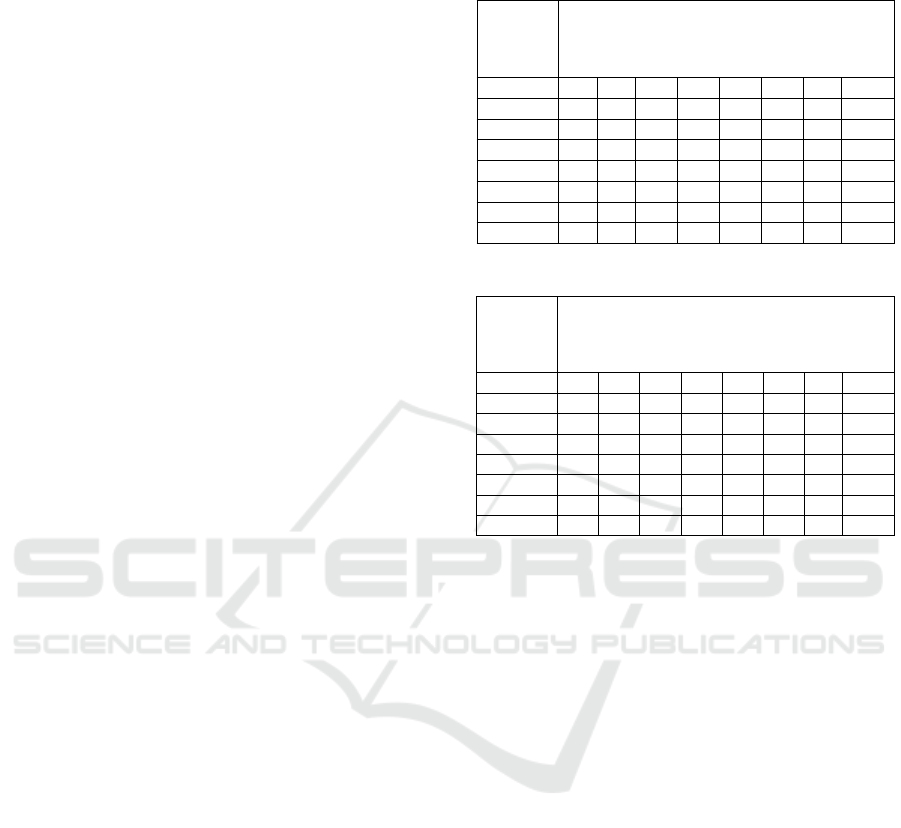
5.1.1 Normal Distribution (10-fold CV)
A Naive Bayes classifier with a Gaussian Probability
Distribution performed with a high precision for the
user-dependent dataset. Figure 2 shows the confusion
matrix. All fast push-ups were recognized correctly.
Lower- and upper-body push-ups were also recog-
nized with a high accuracy reaching almost 96%.
Half-top push-ups showed the lowest recognition pre-
cision with 78.9%. Overall, the Naive Bayes classi-
fier with the Gaussian probability distribution for the
user-dependent data set performed with a recognition
accuracy of 90.5%.
5.1.2 Kernel Distribution (10-fold CV)
Similar to the results for normal distribution, the
Naive Bayes classifier with kernel probability distri-
bution reached similar accuracy as shown in Figure
3. Furthermore, the results indicate similar behavior
for fast, half-top and half-bottom activities, where all
fast push-ups were recognized correctly and half-top
as well as half-bottom have the lowest accuracy. The
classifier performed with a total accuracy of 89.8%, a
slightly lower performance than the normal distribu-
tion.
Table 2: Naive Bayes with normal distribution (10-fold
CV).
Activity
Normal
Fast
Slow
Halftop
Halfbottom
Lowerbody
Upperbody
Recall
Normal 177 0 9 14 0 0 0 88.5
Fast 0 200 0 0 0 0 0 100
Slow 6 0 179 9 6 0 0 89
Halftop 23 0 23 154 0 0 0 76.5
Halfbottom 0 0 4 18 178 0 0 88
Lowerbody 0 4 0 0 4 192 0 95
Upperbody 0 0 4 0 0 4 192 95.5
Precision 86 98 81.7 78.9 94.6 97.9 100
Table 3: Naive Bayes with kernel distribution (10-fold CV).
Activity
Normal
Fast
Slow
Halftop
Halfbottom
Lowerbody
Upperbody
Recall
Normal 173 4 5 14 4 0 0 86.5
Fast 0 200 0 0 0 0 0 100
Slow 6 0 180 8 6 0 0 90
Halftop 18 0 14 164 4 0 0 82
Halfbottom 8 0 18 0 170 4 0 85
Lowerbody 0 4 0 0 9 187 0 93.5
Upperbody 4 0 4 0 0 0 191 95.5
Precision 82.8 96.2 81.4 88.2 88.1 97.9 100
5.1.3 Multivariate Multinomial Distribution
(10-fold CV)
In contrast to normal and kernel distributions, the
classification performance of the Naive Bayes clas-
sifier with multivariate multinomial distribution is
lower (Figure 4). Slow push-ups scored the high-
est recognition accuracy with 87.7% and half-bottom
push-ups scored the lowest accuracy with 37.2%. The
total recognition accuracy for all activities was 57.8%
which is significantly lower than the normal and ker-
nel distributions. Another remark on this result is that
around 11% of the activities were labeled falsely as
slow push-ups. This observation is expected since a
Naive Bayes classifier with multivariate multinomial
distribution works best for discrete, categorical do-
mains while the feature vectors in this case have nu-
merically continuous variables.
5.2 User-independent Model
A 48-fold and LOPOCV technique were applied on
the user-independent dataset.
5.2.1 Normal Distribution (LOPOCV)
The Naive Bayes classifier with Gaussian probabil-
ity distribution for the user-independent data set did
ICAART 2017 - 9th International Conference on Agents and Artificial Intelligence
378
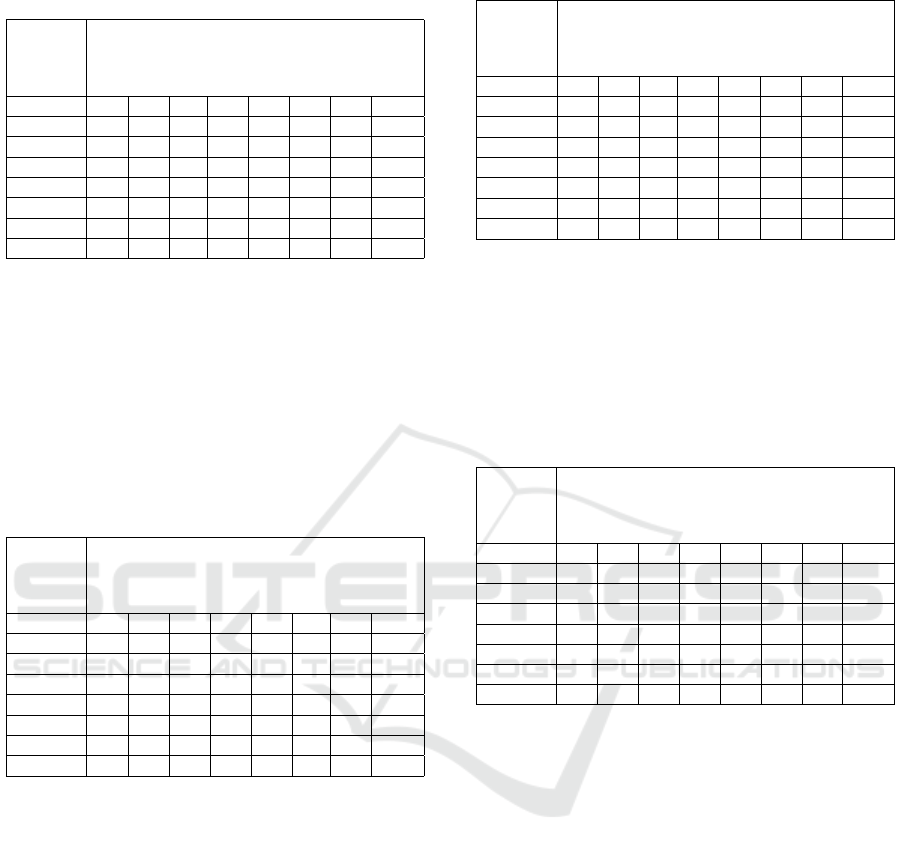
Table 4: Naive Bayes with multi-variate multinomial distri-
bution (10-fold CV).
Activity
Normal
Fast
Slow
Halftop
Halfbottom
Lowerbody
Upperbody
Recall
Normal 108 0 18 32 28 14 0 54
Fast 0 164 18 0 14 0 4 82
Slow 6 3 176 3 0 6 6 88
Halftop 33 10 14 83 32 28 0 41.5
Halfbottom 23 23 33 32 75 14 0 37.5
Lowerbody 28 5 37 28 9 93 0 46.5
Upperbody 26 4 49 22 4 9 86 43
Precision 48.2 78.5 51 41.5 46.3 56.7 89.6
not perform as good as for the user-dependent dataset
(Figure 5). The best recognition accuracy of 93.8%
was recorded for fast push-ups, while half-top push-
ups scored the lowest accuracy of 52.1%. Unlike the
user-dependent dataset, however, the recognition ac-
curacy of normal push-ups was only 56% and the rest
was scattered over fast (12%), slow (18%) and half-
top (14%) push-ups. The Naive Bayes classifier with
normal distribution performed with 76.1%.
Table 5: Naive Bayes with normal distribution (LOPOCV).
Activity
Normal
Fast
Slow
Halftop
Halfbottom
Lowerbody
Upperbody
Recall
Normal 135 29 43 33 0 0 0 56.3
Fast 15 225 0 0 0 0 0 93.8
Slow 15 3 207 9 0 0 6 86.3
Halftop 35 24 55 126 0 0 0 52.5
Halfbottom 0 20 30 5 185 0 0 77
Lowerbody 0 5 5 5 5 220 0 91.7
Upperbody 46 9 9 9 0 0 167 69.6
Precision 54.9 71.4 59.3 67.4 97.4 100 96.5
5.2.2 Kernel Distribution (LOPOCV)
The same results and conclusions for normal distri-
bution are also true for kernel distribution (Figure
6). Both classifiers show very similar results with the
slightly lower recognition accuracy of the kernel dis-
tribution of 73.1%. Normal push-ups showed similar
behavior as normal distribution, 6.9% of the activities
were classified falsely as normal push-ups and 38%
of normal push-ups were classified as other activities.
5.2.3 Multivariate Multinomial Distribution
(LOPOCV)
The multivariate multinomial distribution shares
many results with normal and kernel distributions
for the user-independent data set as well as with
multivariate multinomial distribution for the user-
dependent data set. On the one hand, it showed low
Table 6: Naive Bayes with kernel distribution (LOPOCV).
Activity
Normal
Fast
Slow
Halftop
Halfbottom
Lowerbody
Upperbody
Recall
Normal 150 14 33 43 0 0 0 62.5
Fast 5 220 0 10 0 0 5 91.7
Slow 15 3 201 9 3 3 6 83.8
Halftop 54 10 40 136 0 0 0 56.7
Halfbottom 20 15 20 5 160 20 0 66.7
Lowerbody 0 0 23 0 14 198 5 82.5
Upperbody 27 18 18 23 0 0 154 64.2
Precision 55.4 78.6 60 60.2 90.4 90.4 93.3
recognition accuracy of 28% for normal push-ups and
13.3% of the activities was classified as normal push-
ups. On the other hand, the overall recognition accu-
racy of this classifier is 45.2%, as shown in Figure
7. Furthermore, 9.8% of the activities was classified
falsely as slow push-ups.
Table 7: Naive Bayes with multi-variate multinomial distri-
bution (LOPOCV).
Activity
Normal
Fast
Slow
Halftop
Halfbottom
Lowerbody
Upperbody
Recall
Normal 69 19 62 33 28 20 9 28.8
Fast 25 160 0 10 45 0 0 66.7
Slow 9 0 216 3 0 6 6 90
Halftop 55 30 30 70 35 10 10 29.2
Halfbottom 55 65 5 30 50 30 5 20.8
Lowerbody 37 9 37 18 28 97 14 40.4
Upperbody 55 4 41 0 4 41 95 39.6
Precision 22.6 55.7 55.2 42.7 26.3 47.5 68.3
5.2.4 Normal Distribution (48-fold CV)
The Naive Bayes classifier with normal probability
distribution performed with 79.8%. The recall and
accuracy problem for the normal Push-up class still
remains because of the diverse execution of this ac-
tivity by different users. Thus, normal push-ups are
the activity with the most common similarities with
other push-up types.
5.2.5 Kernel Distribution (48-fold CV)
Naive Bayes with kernel distribution reached a recog-
nition accuracy of 80.3% for the 48-fold cross vali-
dation. The confusion matrix is shown in Figure 9.
The activity with the highest recognition accuracy of
97.9% is fast push-ups. Normal push-up was the ac-
tivity with the lowest recognition accuracy of 62%.
Because the dataset is user-independent, the variance
in the exercise execution caused the low recognition
accuracy as well as the low recall for normal and slow
push-ups.
Measuring the Performance of Push-ups - Qualitative Sport Activity Recognition
379
Table 8: Naive Bayes with normal distribution (48-fold
CV).
Activity
Normal
Fast
Slow
Halftop
Halfbottom
Lowerbody
Upperbody
Recall
Normal 158 14 43 20 5 0 0 65.8
Fast 10 230 0 0 0 0 0 95.8
Slow 21 6 204 9 0 0 6 85
Halftop 35 15 54 136 0 0 0 56.7
Halfbottom 15 15 25 0 185 0 0 77.1
Lowerbody 5 5 5 0 5 215 5 89.5
Upperbody 14 9 9 0 0 5 203 84.5
Precision 61.2 78.2 60 82.4 98.9 97.7 97.6
Table 9: Naive Bayes with kernel distribution (48-fold CV).
Activity
Normal
Fast
Slow
Halftop
Halfbottom
Lowerbody
Upperbody
Recall
Normal 149 20 33 33 5 0 0 62.1
Fast 5 235 0 0 0 0 0 97,9
Slow 9 3 210 12 0 0 6 87.5
Halftop 35 15 40 150 0 0 0 62.5
Halfbottom 5 15 35 20 160 5 0 66.7
Lowerbody 0 0 14 0 9 217 0 90.4
Upperbody 5 0 0 18 0 0 217 90.4
Precision 71.6 81.6 63.3 64.4 92 97.7 97.3
5.2.6 Multivariate Multinomial Distribution
(48-fold CV)
Looking at the confusion matrix in Figure 10, it is
clear that the Naive Bayes classifier with multivari-
ate, multinomial distribution did not perform well for
the 48-fold cross validation on the user-independent
dataset. It achieved an overall accuracy of 45.5%.
Slow push-ups were recognized with the highest ac-
curacy of 81% which is almost 20 percentage points
higher than the second highest activity.
Table 10: Naive Bayes with multi-variate multinomial dis-
tribution (48-fold CV).
Activity
Normal
Fast
Slow
Halftop
Halfbottom
Lowerbody
Upperbody
Recall
Normal 59 5 48 29 33 33 33 24.6
Fast 0 158 5 5 48 24 0 65.8
Slow 3 3 195 6 3 18 12 81.3
Halftop 40 25 50 25 35 55 10 10.4
Halfbottom 25 45 20 30 85 35 0 35.4
Lowerbody 28 9 70 24 9 100 0 41.6
Upperbody 14 27 51 5 14 32 97 40.4
Precision 34.9 58.1 44.4 20.2 37.4 33.7 63.8
6 CONCLUSION & DISCUSSION
A state-of-the-art activity recognition system was ad-
justed and enhanced in order to recognize different
types of the same activities.
The average recognition accuracy of the above men-
tioned experiments is 81.7 % for Normal Distribu-
tion, 80.7 % for Kernel Distribution and 49.1 %
Multivariate Multinomial Distribution. The fact that
slow push-ups have more recordings than other activ-
ities and hence dominates the prior probability with
P(C
s
low) = 1/5 instead of 1/7 for all the seven ac-
tivities, is clearly affecting the recognition accuracy.
This is why many activities were recognized falsely
as slow push-ups. These results show it is not only
feasible to recognize the type of an activity, but also
its quality. In addition, it implies that activity super-
vision in practice should include a profiling technique
where the classifier is calibrated to specific users.
The main drawback is the high false rate for classi-
fying correct push-ups (12 % for personal models).
The classification accuracy has to be improved before
the system can be used in training since correctly per-
formed push-up will occur with the most in practice.
7 FUTURE WORK
A system that is able to detect incorrect exercise per-
formances has great potential to support both profes-
sional and amateur athletes in increasing the safety
and efficiency of their routines.
Most important is conducting of larger experiments
in order to perform more robust evaluation to clarify
if human activity supervision is indeed feasible and
weather user-dependent models are necessary. This
includes experiments with not only more people, but
also more women and different levels of athletic (pro-
fessional and non-professional participants).
There is also a strong need for investigating other ex-
ercise types. Push-up activities were used as a proof
of concept for this study. However, experiments with
other sports activities that differ in their movements
from push-ups can lead to different results. Possible
activities for further studies are rope-jumping, squats
or sit-up.
REFERENCES
Albinali, F., Intille, S., Haskell, W., and Rosenberger, M.
(2010). Using wearable activity type detection to im-
prove physical activity energy expenditure estimation.
ICAART 2017 - 9th International Conference on Agents and Artificial Intelligence
380

In Proceedings of the 12th ACM international confer-
ence on Ubiquitous computing, pages 311–320. ACM.
Babyak, M. A. (2004). What you see may not be what you
get: a brief, nontechnical introduction to overfitting
in regression-type models. Psychosomatic medicine,
66(3):411–421.
Bao, L. and Intille, S. S. (2004). Activity recognition from
user-annotated acceleration data. In Pervasive com-
puting, pages 1–17. Springer.
Baumann, K. (2003). Cross-validation as the objective
function for variable-selection techniques. TrAC
Trends in Analytical Chemistry, 22(6):395–406.
Brezmes, T., Gorricho, J.-L., and Cotrina, J. (2009). Ac-
tivity recognition from accelerometer data on a mo-
bile phone. In Distributed computing, artificial intel-
ligence, bioinformatics, soft computing, and ambient
assisted living, pages 796–799. Springer.
Campbell, A. and Choudhury, T. (2012). From smart to
cognitive phones. IEEE Pervasive Computing, (3):7–
11.
Chang, K.-H., Chen, M. Y., and Canny, J. (2007). Tracking
free-weight exercises. Springer.
Esterman, M., Tamber-Rosenau, B. J., Chiu, Y.-C., and
Yantis, S. (2010). Avoiding non-independence in fmri
data analysis: leave one subject out. Neuroimage,
50(2):572–576.
John, G. H. and Langley, P. (1995). Estimating continuous
distributions in bayesian classifiers. In Proceedings
of the Eleventh conference on Uncertainty in artificial
intelligence, pages 338–345. Morgan Kaufmann Pub-
lishers Inc.
Juan, A. and Ney, H. (2002). Reversing and smoothing the
multinomial naive bayes text classifier. In PRIS, pages
200–212.
Krishnan, N. C., Colbry, D., Juillard, C., and Panchanathan,
S. (2008). Real time human activity recognition us-
ing tri-axial accelerometers. In Sensors, signals and
information processing workshop.
Kuntze, G., Pias, M., Bezodis, I., Kerwin, D., Coulouris, G.,
and Irwin, G. (2009). Use of on-body sensors to sup-
port elite sprint coaching. International Association
of Computer Science in Sport, pages 71–75.
Langley, P., Iba, W., and Thompson, K. (1992). An analy-
sis of bayesian classifiers. In Aaai, volume 90, pages
223–228.
Lee, M. (2009). Physical activity recognition using a single
tri-axis accelerometer. In Proceedings of the world
congress on engineering and computer science, vol-
ume 1.
Lester, J., Choudhury, T., and Borriello, G. (2006). A prac-
tical approach to recognizing physical activities. In
Pervasive Computing, pages 1–16. Springer.
Long, X., Yin, B., and Aarts, R. M. (2009). Single-
accelerometer-based daily physical activity classifica-
tion. In Engineering in Medicine and Biology Society,
2009. EMBC 2009. Annual International Conference
of the IEEE, pages 6107–6110. IEEE.
McClaran, S. R. (2001). The effectiveness of personal train-
ing on changing attitudes towards physical activity.
Medicine & Science in Sports & Exercise, 33(5):S211.
Michahelles, F. and Schiele, B. (2005). Sensing and mon-
itoring professional skiers. Pervasive Computing,
IEEE, 4(3):40–45.
M
¨
oller, A., Roalter, L., Diewald, S., Scherr, J., Kranz,
M., Hammerla, N., Olivier, P., and Pl
¨
otz, T. (2012).
Gymskill: A personal trainer for physical exercises.
In Pervasive Computing and Communications (Per-
Com), pages 213–220. IEEE.
Parkka, J., Ermes, M., Korpipaa, P., Mantyjarvi, J., Peltola,
J., and Korhonen, I. (2006). Activity classification
using realistic data from wearable sensors. Informa-
tion Technology in Biomedicine, IEEE Transactions
on, 10(1):119–128.
Rasekh, A., Chen, C.-A., and Lu, Y. (2014). Human ac-
tivity recognition using smartphone. arXiv preprint
arXiv:1401.8212.
Ravi, N., Dandekar, N., Mysore, P., and Littman, M. L.
(2005). Activity recognition from accelerometer data.
In AAAI, volume 5, pages 1541–1546.
Saponas, T., Lester, J., Froehlich, J., Fogarty, J., and Lan-
day, J. (2008). ilearn on the iphone: Real-time human
activity classification on commodity mobile phones.
University of Washington CSE Tech Report UW-CSE-
08-04-02, 2008.
Sefen, B., Baumbach, S., Dengel, A., and Abdennadher,
S. (2016). Human activity recognition - using sensor
data of smartphones and smartwatches. In Proceed-
ings of the 8th International Conference on Agents
and Artificial Intelligence, volume 2, pages 488–493.
SCITEPRESS.
Sharma, A., Purwar, A., Lee, Y.-D., Lee, Y.-S., and Chung,
W.-Y. (2008). Frequency based classification of activ-
ities using accelerometer data. In Multisensor Fusion
and Integration for Intelligent Systems. IEEE Interna-
tional Conference on, pages 150–153. IEEE.
Shoaib, M., Scholten, H., and Havinga, P. J. (2013). To-
wards physical activity recognition using smartphone
sensors. In Ubiquitous Intelligence and Computing,
pages 80–87. IEEE.
Subramanya, A., Raj, A., Bilmes, J. A., and Fox, D. (2012).
Recognizing activities and spatial context using wear-
able sensors. arXiv preprint arXiv:1206.6869.
Wang, W.-z., Guo, Y.-w., Huang, B.-Y., Zhao, G.-r., Liu, B.-
q., and Wang, L. (2011). Analysis of filtering methods
for 3d acceleration signals in body sensor network. In
Bioelectronics and Bioinformatics (ISBB), 2011 Inter-
national Symposium on, pages 263–266. IEEE.
Witten, I. H. and Frank, E. (2005). Data Mining: Practi-
cal machine learning tools and techniques. Morgan
Kaufmann.
Yang, J. (2009). Toward physical activity diary: motion
recognition using simple acceleration features with
mobile phones. In Proceedings of the 1st interna-
tional workshop on Interactive multimedia for con-
sumer electronics, pages 1–10. ACM.
Measuring the Performance of Push-ups - Qualitative Sport Activity Recognition
381
