
Time-frequency based Coherence and Phase Locking Value Analysis of
Human Locomotion Data using Generalized Morse Wavelets
Sopapun Suwansawang
1,2
and David M. Halliday
1
1
Department of Electronics, University of York, York, U.K.
2
Department of Electronics, Faculty of Science and Technology, Nakhon Pathom Rajabhat University,
Nakhon Pathom, Thailand
Keywords:
Analytic Wavelets, Phase Synchronization, Cone of Influence, Non-stationary Analysis.
Abstract:
Time-frequency analysis is a powerful and popular tool for studying time-varying properties of non-stationary
neurophysiological signals. In this study, time-frequency based coherence and phase locking value (PLV)
analysis using generalized Morse wavelets are presented. The methods are applied to pairs of surface EMG
signals recorded from leg muscles during treadmill walking in healthy human subjects. Time-frequency
based coherence and PLV analysis in this study detect similar patterns of 8-15 Hz and 15-20 Hz common
modulation of EMG during locomotion. Our results suggest that a combination of both methods would be
suitable for investigating and characterising non-stationary neurophysiological data. An understanding of the
basic principles of normal locomotion can further provide insight into pathological locomotion deficits.
1 INTRODUCTION
Human locomotion can be characterised by rhythmic
activity that is governed by a series of complex
interactions between the human brain and the
spinal cord. These interactions can be analysed
by recording electromyograms (EMG) from human
muscles (Grosse et al., 2002; Halliday et al., 2003).
An analysis of human movement is a process
to investigate the characteristics of human body
movement that relates to both normal and abnormal
movement (Farmer et al., 2007; Tuncel et al., 2010).
Understanding human movement or how the brain
controls the muscles could help in recognising the
first stages of many movement disorders, such as
Parkinson’s disease.
Analysis of the frequency content of
electrophysiological signals are useful ways to
examine neuronal synchrony (Grosse et al., 2002).
Time-frequency analysis has been used extensively
in studying time-varying properties of non-stationary
neurophysiological signals (Tuncel et al., 2010;
Allen and Mackinnon, 2010). Time-frequency
coherence analysis is one of the methods used
to represent signals whose frequency content is
varying with time (Zhan et al., 2006). This analysis
can be performed by mapping a one-dimensional
signal in the time domain into a two dimensional
representation in time-frequency product space.
Phase synchronisation is used to study phase
relationships between physiological signals (Quyen
et al., 2001; Lowet et al., 2016). Both time-frequency
coherence and phase synchronisation analysis can be
used to investigate and characterise non-stationary
neuronal coupling mechanisms, and provided
essentially the same information in frequency domain
(Mezeiov
´
a and s, 2012). However, coherence
analysis depends on two factors: phase consistency
and amplitude covariation of signals (Quyen et al.,
2001). Phase synchronisation analysis provides the
phase component that can be obtained separately
from the amplitude component for a given frequency
or frequency range (Quyen et al., 2001).
The wavelet transform is increasingly applied
in dynamic neurophysiological signal analysis in
both time and frequency domain (Tuncel et al.,
2010; Zhan et al., 2006; Quyen et al., 2001;
Hassan et al., 2010). There are a number of
wavelet families that are used in order to identify
the appearance of oscillations and other signal
properties. Currently, the continuous analytic wavelet
transform is more widely used for the analysis
of modulated oscillatory signals and discontinuities
(Lilly and Olhede, 2010). The generalized Morse
wavelets are exactly analytic wavelets that have been
used to estimate characteristics of non-stationary
34
Suwansawang S. and Halliday D.
Time-frequency based Coherence and Phase Locking Value Analysis of Human Locomotion Data using Generalized Morse Wavelets.
DOI: 10.5220/0006111800340041
In Proceedings of the 10th International Joint Conference on Biomedical Engineering Systems and Technologies (BIOSTEC 2017), pages 34-41
ISBN: 978-989-758-212-7
Copyright
c
2017 by SCITEPRESS – Science and Technology Publications, Lda. All rights reserved

neurophysiological signals (Brittain et al., 2007;
Nakhnikian et al., 2016). A particular subset
of the generalized Morse wavelets, Airy wavelets,
substantially outperforms the approximately analytic
Morlet wavelets (Lilly and Olhede, 2010).
In this study, generalized Morse wavelets are
applied to calculate time-frequency based coherence
and phase locking value for ten experimental data
sets: surface EMG during treadmill walking in
healthy subjects. Our aim is to compare results
from the two methods. The structure of the paper
is organised as follows. First, we introduce the
motivation and background of the study. Second,
we provide a brief review of methodologies, with
details about each of the required steps for their
implementation. Third, we provide the detail of
experiment data. Fourth, we illustrate the results of
the experiment data. Fifth, we discuss our results
in light of previous findings. The paper ends with
suggestions for future work.
2 METHODS
This section provides details of analytical methods
analysing non-stationary physiological signals.
Section 2.1 describes generalized Morse wavelets,
section 2.2 considers edge effects, section 2.3 gives a
summary on the time-frequency coherence estimates,
and section 2.4 presents the concepts of phase
synchronisation analysis.
2.1 The generalized Morse Wavelets
Generalized Morse wavelets are a promising class
of complex-valued exactly analytic wavelet transform
with vanishing support on negative frequency
axis, while the popular Morlet wavelet is only
approximately analytic wavelet for sufficiently large
radian frequency (Lilly and Olhede, 2009).
Generalized Morse wavelets are highly flexible
and form a two-parameter family of wavelets. A
definition of zero-order (k = 0) generalized Morse
wavelets in the frequency domain form is provided
in (Olhede and Walden, 2003) as
Ψ
β,γ
(ω) =
√
2H(ω)A
k;β,γ
ω
β
e
−ω
γ
(1)
where H(ω) is the Heaviside unit step function and
A
k;β,γ
is a normalising constant that can be expressed
by
A
k;β,γ
=
p
πγ2
r
Γ(k + 1/Γ(k + r)) (2)
where Γ(•) denotes the gamma function and r =
(2β + 1)/γ. The maximum amplitude occurs at the
peak frequency (Lilly and Olhede, 2009),
ω
β,γ
≡
β
γ
1
γ
(3)
The rescaled second derivative of the
frequency-domain wavelets evaluated at its peak
frequency is P
2
β,γ
≡ βγ, and P
β,γ
is called the
dimensionless wavelet duration (Lilly and Olhede,
2010), defined as
P
β,γ
≡
p
βγ (4)
The time domain form for the generalized Morse
wavelets may be expressed by the inverse Fourier
transform,
ψ
β,γ
(t) =
1
2π
Z
∞
0
√
2A
k;β,γ
ω
β
e
−ω
γ
e
iωt
dω (5)
β and γ are two parameters controlling
time-frequency localisation. The parameter β
controls the time-domain decay, and γ controls the
frequency-domain decay. Normally, β and γ are
greater than zero. An example of one member of the
generalized Morse wavelet family, the γ = 3 family
with β = 3, 9, and 27 is shown in Figure 1. The
γ = 3, called Airy wavelet, was found to have zero
asymmetry in time domain and is nearly symmetric
in the frequency domain. The Airy wavelets not only
preserve the spirit of the Morlet wavelet but also
substantially outperform the Morlet for high time
localisation while remaining analytic. More details
regarding the different roles of β and γ in controlling
wavelet properties can be found in (Lilly and Olhede,
2009), (Lilly and Olhede, 2012), and (Lilly and
Olhede, 2010).
0 0.5 1
0
2
4
β : 3, γ: 3, k: 0, P
2
β,γ
: 9, Energy: 1
−10 −5 0 5 10
−1
0
1
β : 3, γ: 3, k: 0, P
2
β,γ
: 9, Energy: 1
0 0.5 1
0
2
4
β : 9, γ: 3, k: 0, P
2
β,γ
: 27, Energy: 1
−10 −5 0 5 10
−1
0
1
β : 9, γ: 3, k: 0, P
2
β,γ
: 27, Energy: 1
0 0.5 1
0
2
4
β : 27, γ: 3, k: 0, P
2
β,γ
: 81, Energy: 1
Frequency (f)
−10 −5 0 5 10
−1
0
1
β : 27, γ: 3, k: 0, P
2
β,γ
: 81, Energy: 1
Time (t)
Figure 1: Examples of the generalized Morse wavelet for
γ = 3 and β = 3,9, and 27. , with time domain form ψ
β,γ
(t)
(left) and frequency domain form Ψ
β,γ
(ω) (right). In the
time domain, the solid line and the dashed line indicate the
real part and the imaginary part of the wavelet, respectively.
Frequency f is in cycles per second (Hz).
Time-frequency based Coherence and Phase Locking Value Analysis of Human Locomotion Data using Generalized Morse Wavelets
35

2.2 Cone of Influence
In practice, wavelet analysis is the convolution of
the signal and the wavelet function, therefore the
convolution will suffer edge effects. The region of
a wavelet transform affected by edge effects is called
the cone-of-influence (COI). Regions outside the COI
are neglected due to edge effects. In this paper, the
definition for identifying the COI is adapted from
(Torrence and Compo, 1998). The COI for the Morlet
wavelet is defined by the e-folding time τ
s
=
√
2s
which is chosen such that the wavelet power for a
discontinuity at the edge drops by factor e
−2
. To map
this approach to the generalized Morse wavelet, the
e-folding time at scale s can be defined as
τ
0
s
=
√
2s
P
β,γ
ω
β,γ
(6)
where P
β,γ
and ω
β,γ
refer back to (4) and (3),
respectively. The e-folding time τ
0
s
will be used
to visualize the COI in time-frequency plots of the
wavelet power spectra, wavelet coherence and phase
locking value.
2.3 The Estimation of Time-frequency
Coherence
The analysis of time-frequency coherence requires the
estimates for cross spectrum and auto spectra of two
non-stationary processes. Considering two signals
x(t) and y(t), the continuous wavelet transform
expressions of their time-frequency representations
are W
x
(τ, f ) and W
y
(τ, f ). The time-frequency cross
spectrum between x(t) and y(t) signals is defined as
S
xy
(τ, f ) = W
x
(τ, f )W
∗
y
(τ, f ) (7)
and the time-frequency auto spectra of x(t) and y(t)
signals are given as
S
x
(τ, f ) = |W
x
(τ, f )|
2
(8)
S
y
(τ, f ) = |W
y
(τ, f )|
2
(9)
The time-frequency coherence expression is obtained
from equations (7), (8) and (9), the squared coherence
can be calculated by the squared magnitude of the
cross spectrum normalised by the auto spectra of each
signal, is given by
|R
xy
(τ, f )|
2
=
|S
xy
(τ, f )|
2
S
x
(τ, f )S
y
(τ, f )
(10)
In real situations, the auto-and cross-spectra
can be estimated for a series of repeat trials that
is computed by averaging across trials without
smoothing within trials (Zhan et al., 2006). The
procedure for estimating the time-frequency
coherence is outlined in equations (11)-(14), see
(Zhan et al., 2006) for details. The time-frequency
coherence is estimated from the cross spectrum
ˆ
S
xy
(τ, f ) and the auto spectra
ˆ
S
x
(τ, f ), and
ˆ
S
y
(τ, f ) as
|
ˆ
R
xy
(τ, f )|
2
=
|
ˆ
S
xy
(τ, f )|
2
ˆ
S
x
(τ, f )
ˆ
S
y
(τ, f )
(11)
where
ˆ
S
x
(τ, f ) =
1
N
N
∑
n=1
|W
x
n
(τ, f )|
2
(12)
ˆ
S
y
(τ, f ) =
1
N
N
∑
n=1
|W
y
n
(τ, f )|
2
(13)
ˆ
S
xy
(τ, f ) =
1
N
N
∑
n=1
W
x
n
(τ, f )W
y∗
n
(τ, f ) (14)
where N is number of trials. Some assumptions are
required of data in order to formulate a confidence
interval for coherence estimates. This is essential for
determining which values of coherence are reliable.
The confidence interval means that the obtained
coherence value can be viewed as significant if the
estimated coherence value exceeds the confidence
interval. If the two signals are independent and
have Gaussian distributions, the distribution of the
coherence estimates is given by (Gish and Cochran,
1988)
Pr(R
2
≤ r) = 1 −(1 −r)
(K−1)
,0 ≤ r ≤ 1 (15)
where Pr(.) denotes probability distribution function,
r is the detection threshold value and K is the
number of windows used to estimate the spectrum.
For the confidence interval value of 95%, the
detection threshold value for this confidence interval
is computed as r
95%
= 1 −0.05
1/(K−1)
(Zhan et al.,
2006).
2.4 Phase Synchronisation Analysis
Phase synchronisation measures can be used to
study the relationships between the phases of
physiological signals. Phase synchronisation refers to
the phases of two coupled oscillators that synchronise
even if the amplitude fluctuations between the
oscillating signals are uncorrelated (Pereda et al.,
2005). Synchronisation of weakly coupled oscillating
system appears as some relation between their
phase and frequencies (Rosenblum and Kurths,
1998). A general framework for studying phase
synchronisation has three main steps (Quyen and
Bragin, 2007): first, pre-filtering of the raw signal
with a bandpass filter around a chosen frequency
value. Second, estimation of the phase. Third,
BIOSIGNALS 2017 - 10th International Conference on Bio-inspired Systems and Signal Processing
36

quantification of the degree of phase-locking. There
are two methods of phase estimation, one using
complex wavelets (Quyen et al., 2001; Lachaux
et al., 1999) (refer back to (1) and another using the
Hilbert transform (HT) (Tass et al., 1998). The main
difference between these two methods is that the HT
is actually a filter with unit gain at every frequency. If
the signal is broadband, pre-filtering in the frequency
band of interest is required before applying the HT, in
order to get an appropriate phase value (Pereda et al.,
2005). On the other hand, pre-filtering is unnecessary
when using a complex wavelet because it can act
as a bandpass filter and, at the same time, provide
separate values for the instantaneous amplitude and
the phase (Hassan et al., 2010). In this study, phase
synchronisation is calculated using generalized Morse
wavelets.
2.4.1 Phase Locking Value
Phase locking value (PLV) is an important measure
for investigating synchronisation of neural activity,
including the muscle activities detected by EMG.
In particular, (Tass et al., 1998) found that the
phase locking between the activity of primary
and secondary motor areas can be related to the
coordination of antagonistic muscles.
Analytically, the interaction between two
oscillating systems essentially affects the evolution
of their phases if the frequency ω
x
and ω
y
are in
resonance for some integers p, q, indicating the
ratios of possible frequency locking (for details
see (Wacker and Witte, 2011) and (Tass et al.,
1998)). The existence of locking or entrainment
between frequencies are close to rational relation,
pω
x
≈ qω
y
(Pereda et al., 2005). The generalised
phase difference of two series is given by
ϕ
p,q
(t) = pφ
x
(t) −qφ
y
(t) (16)
where φ
x
(t) and φ
y
(t) are the unwrapped phases of
the signals. The principle of phase synchronisation
of periodic self-oscillatory systems corresponds to a
phase locking between two systems defined as
ϕ
p,q
(t) = |pφ
x
(t) −qφ
y
(t)| ≤ constant (17)
Here, as the aim is to detect functional connectivity
between two signals from the same physiological
system. The m:n synchronisation index mostly
considers the simplest case of p = q = 1. This
is used here. The local phase of the generalized
Morse wavelet transform for trial n at time τ and
frequency f is quantified from the ratio between
the imaginary part (ℑ) and the real part (ℜ) of the
wavelet transform,
φ
x
n
(τ, f ) = tan
−1
ℑ(W
x
n
(τ, f ))
ℜ(W
x
n
(τ, f ))
(18)
The phase of a given time-series x(t) can be defined
such that it is parameterized in the range φ
x
n
(τ, f ) ∈
[−π,π], with similar expressions for the phase of
time-series y, φ
y
n
(τ, f ). The phases are used to
calculate the phase difference between x(t) and y(t)
at time t. A representation of time-frequency phase
locking values over N trials between the signals
(Lachaux et al., 2000) is defined as
PLV (τ, f ) =
1
N
N
∑
n=1
e
i(φ
y
n
(τ, f )−φ
x
n
(τ, f ))
(19)
PLV is a normalised measure that varies between
0 and 1, where a value of 1 means perfect phase
synchrony.
2.4.2 The Statistical Significance Level of PLV
The statistical significance of phase locking values is
determined by using surrogate series. These surrogate
series are created by shifting the trials of signal y
(see (Lachaux et al., 2000), (Pereda et al., 2005),
and (Gupta and James, 2007) for details). In this
study, the significance level for PLV is considered if
the PLV is greater than the 95% confidence interval
of the von Mises distribution of the mean of PLV
calculated from surrogate data. The percentage of
the linear Normal distribution (z=1.96) is used to give
the 95% confidence interval for the mean direction in
Von Mises distribution. The value of confidence limit
depends on the number of trials. A small number
of trials will result in a large confidence limit. In
this study, for 380 trials, a PLV above 0.0538 is
statistically significant at P < 0.05. For comparison
the 95% significance level for coherence with 380
trials is 0.0079.
3 EXPERIMENTAL DATA
3.1 Data
Ten datasets were taken from the study of (Halliday
et al., 2003), using experiments to investigate the
functional coupling of motor units during treadmill
walking in healthy subjects. All subjects were made
to walk on a treadmill at normal speed. Paired surface
EMG electrodes were placed over two sides from the
ankle flexor TA. Surface EMG was used to record the
aggregate muscle potentials (Mima et al., 2001). The
two EMG signals over the ankle flexor can be used as
a substitute for pairs of motor unit recordings that can
identify any modulation in the functional coupling
during walking, and provide a basis for investigating
Time-frequency based Coherence and Phase Locking Value Analysis of Human Locomotion Data using Generalized Morse Wavelets
37
the highly adaptive nature of human gait patterns
(Halliday et al., 2003). Recordings were made over
a period of 500 seconds. A contact switch identified
heel strike. Thresholding of the heel strike record
provides a sequence of trigger times. These trigger
times provide a reference point within each step cycle
which is used to segment the data for undertaking
time-frequency analysis, where time is defined with
respect to heel contact. Further details of experiments
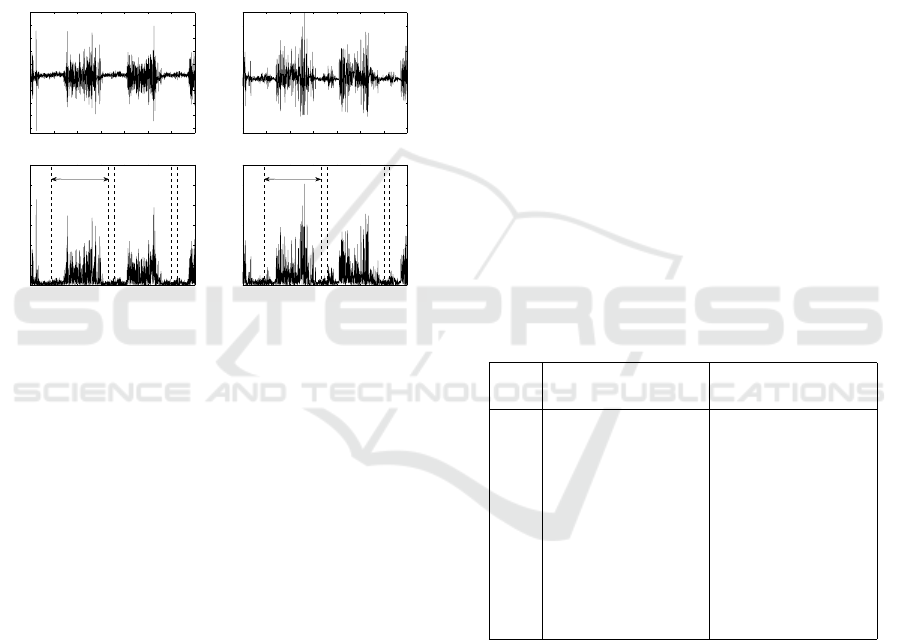
are given in (Halliday et al., 2003). Examples of EMG
signals obtained from one subject during treadmill
walking are in Figure 2.
0 0.5 1 1.5 2 2.5 3 3.5
−2
−1.5
−1
−0.5
0
0.5
1
1.5
2
2.5
TA − EMG Channel 1
Time (s)
Voltage (V)
0 0.5 1 1.5 2 2.5 3 3.5
−2
−1
0
1
2
TA − EMG Channel 2
Time (s)
Voltage (V)
0 0.5 1 1.5 2 2.5 3 3.5
0.5
1
1.5
2
2.5
3
rectified TA − EMG Channel 1
Time (s)
Voltage (V)
Wind ow
0 0.5 1 1.5 2 2.5 3 3.5
0.5
1
1.5
2
2.5
3
rectified TA − EMG Channel 2
Voltage (V)
Time (s)
Wind ow
Figure 2: An example of paired surface EMG signals
obtained from one subject during treadmill walking, with
(top) the EMG signal before rectification and (bottom)
rectified EMG signal showing analysis window.
3.2 Data Analysis
In this paper, the power spectrum, coherence and PLV
were computed using generalized Morse wavelets
with γ = 3 and β = 9. The aim is to investigate the
functional coupling between paired EMG signals in
the time-frequency domain. The standard practice
of rectification of surface EMG signals has been a
commonly used pre-processing procedure that allows
detection of significant coherence (Farmer et al.,
2007). EMG-EMG spectral and PLV analysis were
calculated using averages over 380-step cycles. All
steps were segmented into 1040 ms segments with
820 ms before heel trigger and 220 ms after heel
trigger. The time scale on time-frequency plots is
labelled as 0-1040 ms, heel triggers are at 820 ms in
these plots (Figure 3). Thus, each coherence and PLV
plot covers swing phase including early, mid, and
late swing for each step cycle. Examples of rectified
EMG signal and analysis window are provided in
Figure 2. The EMG-EMG coherence and PLV was
considered significant if above the 95% confidence
limits, calculated using (15) for coherence and in
section 2.4.2 for PLV. Significant coherence and PLV
were observed at frequencies ≤ 50 Hz. All analyses
were implemented using MATLAB (The MathWorks,
Natick, MA).
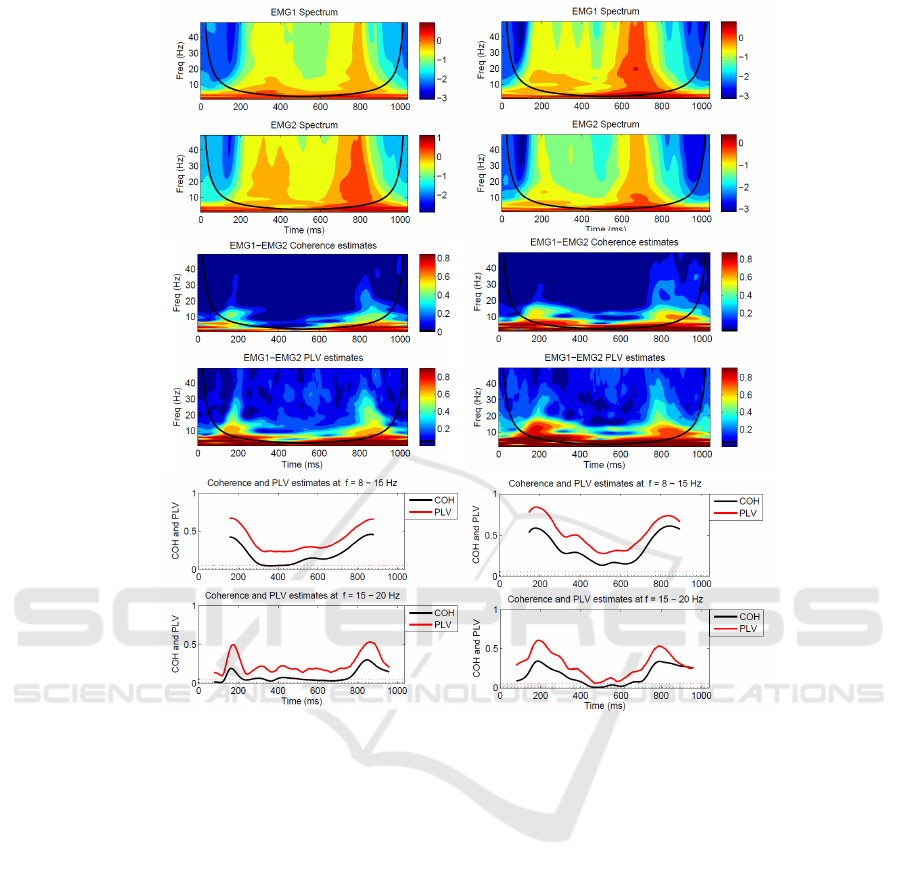
4 RESULTS
Examples of time-frequency power spectra,
coherence and PLV from two subjects walking
at 4 km/h are shown in Figure 3. Figure 3A and B
illustrate estimates of spectra for each EMG channel.
Figure 3C and D illustrate time-frequency coherence
and PLV estimates between the EMG signals. Figure
3E and F illustrate line plots of the 8-to 15- and
15- to 20-Hz rhythmic components in coherence
and PLV estimates averaged over these frequency
ranges, respectively. Spectra are plotted as Log
values. Only coherence and PLV inside the COI are
represented on the line plots. The 95% confidence
limit for coherence estimate in this study is 0.0079,
and 0.0538 for PLV based on analysis of 380 step
cycles. The black line indicates the COI in Figure
3A-D (see section 2.2).
Table 1: Summary of mean coherence and PLV from
380-step cycles for 10 subjects at frequency 2-50 Hz in
beginning, middle and end swing of the step cycle.
No. Coherence PLV
Begin / Mid / End Begin / Mid / End
1 0.28 / 0.24 / 0.44 0.54 / 0.46 / 0.60
2 0.34 / 0.41 / 0.44 0.46 / 0.52 / 0.57
3 0.34 / 0.40 / 0.43 0.45 / 0.52 / 0.55
4 0.40 / 0.33 / 0.43 0.54 / 0.46 / 0.56
5 0.42 / 0.36 / 0.45 0.55 / 0.48 / 0.57
6 0.45 / 0.43 / 0.62 0.57 / 0.55 / 0.77
7 0.41 / 0.39 / 0.47 0.57 / 0.55 / 0.61
8 0.46 / 0.42 / 0.57 0.60 / 0.54 / 0.65
9 0.48 / 0.43 / 0.57 0.61 / 0.53 / 0.64
10 0.50 / 0.41 / 0.50 0.64 / 0.53 / 0.64
The results suggest that the wavelet spectra of
EMG signals are similar over all subjects. There is
an increase in power in early, with a reduction in the
middle and then increase in late swing of the step
cycle (Figure 3A and B). Strongest coherence is at
frequency<5 Hz. In some subjects this low frequency
component persists across the swing phase (Figure
3D), in other subjects it is prominent in the early
and late phases of swing (Figure 3C). Note that some
of the low frequency coherence is outside the COI,
therefore potential edge effects should be taken into
account. In addition, weaker coherence between 8
BIOSIGNALS 2017 - 10th International Conference on Bio-inspired Systems and Signal Processing
38
A B
C D
E F
Figure 3: EMG-EMG wavelet coherence and PLV analysed from 380-step cycles, which segmented into 1040 ms non
overlapping epochs from two subjects, subject 1 (left column) and subject 10 (right column). A and B: estimates of spectra
for each EMG channel, C and D time-frequency coherence and PLV plots, E and F: line-plot of coherence and PLV estimates
at f = 8-15 Hz, and f = 15-20 Hz. Two horizontal dashed lines in E and F are the 95% confident limit for coherence estimates
(black) and PLV estimates (red).
and 20 Hz occurs in early and late swing. PLV has
significant features in both time and frequency which
are similar to those seen in coherence estimates; see
Figure 3C-F.
Some aspects are common across all the
experiments as illustrated in Table 1. The magnitude
of the correlation between paired EMG signals is not
constant over the step cycle. For 8 of the 10 subjects,
the magnitude of the coherence and the PLV reduce
during the mid swing of the step cycle. Two of the
subjects (subjects 2 and 3) have magnitude in the
early swing that is smaller when compared to mid
and end swing. A significant low-frequency (< 8 Hz)
component is present throughout the step cycle, but
some of these features are outside the COI so many
reflect edge effects in wavelet transform. A distinct 8-
to 15- and 15- to 20-Hz correlation are present during
early and late swing as illustrated clearly in Figure 3E
and F. Analysis of this locomotion data using wavelet
coherence and wavelet PLV gives similar results.
5 DISCUSSION
This study presents time-frequency coherence and
PLV analysis using generalized Morse wavelets with
β = 9 and γ = 3. The methods are used to
characterise the correlation structure in experimental
data consisting of paired surface EMG signals during
treadmill walking. The main finding of the study
is that both methods are able to detect localised
correlation in the time-frequency plane. The results
obtained in this study are similar to Fourier based
Time-frequency based Coherence and Phase Locking Value Analysis of Human Locomotion Data using Generalized Morse Wavelets
39

time-frequency estimates in (Halliday et al., 2003),
functional coupling of motor unit during locomotion
was investigated. This demonstrated the presence
of 8-15 Hz and 15-20 Hz, frequency components of
motor unit correlation. These frequency components
are prominent around heel contact, which reflect
rhythmic neural activity associate with a particular
phase of locomotion. Traditional spectral analysis
method based on Fourier transform contains no
temporal information. (Halliday et al., 2003) applied
coherence function and estimates of the cumulant
density function to characterise the correlation
between the EMG signals in the frequency domain
and the time domain, respectively. By analysing
data, each step cycle was divided into three different
non-overlapping segments each lasting 200 ms
corresponding to early, mid, and end swing.
The generalized Morse wavelet based coherence
and PLV estimates in this study provide a similar
description of the data. The PLV estimates have larger
magnitudes than the coherence estimates. The PLV
appears noisier than the coherence despite the same
number of trials (Figure 3C-D). The confidence limit
derived from surrogate data is larger for the PLV
estimate than for the coherence estimate for the same
number of trials. The wavelet edge effects should not
be a problem if the window length is made sufficiently
large. For example, for a frequency of 10 Hz the edge
effect has duration around 120 ms for the generalized
Morse wavelets used here. Changes in parameters
β and γ relate to temporal and spectral resolution in
the time-frequency plane. Adjustment of these will
alter the resolution in time and frequency (Lilly and
Olhede, 2009).
Our results suggest both methods give useful
information and are suitable for investigation of
non-stationary neuronal coupling mechanisms
underlying human treadmill locomotion. Although
this study is constrained to EMG acquired during
walking, this approach could be applied to other
physiological data.
6 FUTURE WORK
The methods in this study will be used to identify
modulations in the functional coupling of motor units
during overground walking in normal and Parkinson’s
disease subjects. This will provide insight into the
organisation of the neural pathways involved in gait
patterns in health and disease.
ACKNOWLEDGEMENTS
Financial support is provided by the Royal Thai
government science and technology scholarships.
REFERENCES
Allen, D. P. and Mackinnon, C. D. (2010). Time-Frequency
analysis of movement-related spectral power in
EEG during repetitive movements:a comparison
of methods. Journal of Neuroscience methods,
186:107–115.
Brittain, J.-S. et al. (2007). Single-trial multiwavelet
coherence in application to neurophysiological time
serie. IEEE Transactions on Biomedical Engineering,
54(5):854–862.
Farmer, S. F. et al. (2007). Changes in EMG coherence
between long and short thumb abductor muscles
during human development. J Physiol, 579:389–402.
Gish, H. and Cochran, D. (1988). General coherence.
In: International Conference on Acoustic, Specch and
Signal Processing, 5:2745–2748.
Grosse, P. et al. (2002). EEG-EMG, MEG-EMG
and EMG-EMG frequency analysis:physiological
principles and clinical applications. Clinical
Neurophysiology, 113:15231531.
Gupta, D. and James, C. J. (2007). Narrow band vs.
broadband phase synchronization analysis applied
to independent components of Ictal and Interictal
EEG. Proceeding of the 29th annual international
conference of the IEEE EMBS Cite internationale,
pages 23–26.
Halliday, D. M. et al. (2003). Functional coupling of motor
units is modulated during walking in human subjects.
J Neurophysiol, 89:960–968.
Hassan, M. et al. (2010). Interactions between Uterine
EMG at different sites investigated using wavelet
analysis: comparison of pregnancy and labor
contraction. EURASIP J. Adv. Signal Process, 17:1–9.
Lachaux, J. P. et al. (1999). Measuring phase synchrony in
brain signals. Hum. Brain Mapp., 8:194–208.
Lachaux, J. P. et al. (2000). Studying single-trials of
phase synchronous activity in the brain. International
Journal of Bifurcation and Chaos, 10(10):2429–2439.
Lilly, J. M. and Olhede, S. C. (2009). High-order properties
of analytic wavelets. IEEE Transactions on Signal
Processing, 57:146–160.
Lilly, J. M. and Olhede, S. C. (2010). On the analytic
wavelet transform. IEEE Transactions on Information
Theory, 56:4135–4156.
Lilly, J. M. and Olhede, S. C. (2012). Generalized
morse wavelet as a superfamily of analytic
wavelets. IEEE Transactions on Signal Processing,
60(11):6036–6041.
Lowet, E. et al. (2016). Quantifying neural oscillatory
synchronization:a comparison between spectral
coherence and phase-locking value approaches.
PLOS one, 11(1):1–37.
BIOSIGNALS 2017 - 10th International Conference on Bio-inspired Systems and Signal Processing
40

Mezeiov
´
a, K. and s, M. P. (2012). Comparison of
coherence and phase synchronization of the human
sleep electroencephalogram. Journal of Clinical
Neurophysiology, 123(9):1821–1830.
Mima, T. et al. (2001). Coherence between cortical and
muscular activities after subcortical stroke. Stroke,
32(11):2597–2601.
Nakhnikian, A. et al. (2016). A novel cross-frequency
coupling detection method using the generalized
morse wavelet. Journal of Neuroscience Methods,
269:61–73.
Olhede, S. C. and Walden, A. T. (2003). Polarization
phase relationships via multiple morse wavelet.
I fundamentals. Proc. Roy. Soc. Lond,
60(11):6036–6041.
Pereda, E. et al. (2005). Nonlinear multivariate analysis of
neuroohysiological signals. Prog Neurobiol, 77:1–37.
Quyen, M. L. V. and Bragin, A. (2007). Analysis of
dynamic brain oscillations: methodological advances.
Trends Neurosci, 30(7):365–373.
Quyen, M. L. V. et al. (2001). Comparision of hilbert
transform and wavelet methods for the analysis
of neuronal synchrony. Journal of neuroscience
methods, 111:83–98.
Rosenblum, M. G. and Kurths, J. (1998). Analysing
synchronisation phenomena from bivariate data by
means of the hilbert transform. In: Nonlinear Analysis
of Physiological data, pages 91–99.
Tass, P. et al. (1998). Detection of n:m phase locking from
noisy data: Application to magnetoencephalography.
Phys. Rev. Lett., 81:3291–3294.
Torrence, C. and Compo, G. P. (1998). A practical
guide to wavelet analysis. Bulletin of the American
Meteorological Society, 76:61–78.
Tuncel, D. et al. (2010). Time Frequency based coherence
analysis between EEG and EMG activities in fatigue
duration. Journal of Medical Systems, 34(2):131–138.
Wacker, M. and Witte, H. (2011). On the stability of the
n:m phase synchronization index. IEEE Transactions
on Biomedical Engineering, 58(2):332–338.
Zhan, Y. et al. (2006). Detecting time-dependent coherence
between non-stationary electrophysiological signal-a
combined statistical and time-frequency approach.
Journal of neuroscience methods, 156:322–332.
Time-frequency based Coherence and Phase Locking Value Analysis of Human Locomotion Data using Generalized Morse Wavelets
41
