
Ambulatory Devices Measuring Cardiorespiratory Activity with Motion
Marcel Mły
´
nczak
1
, Marek
˙
Zyli
´
nski
1
, Wiktor Niewiadomski
2
and Gerard Cybulski
1,2
1
Institute of Metrology and Biomedical Engineering, Faculty of Mechatronics, Warsaw University of Technology,
Boboli 8, 02-525, Warsaw, Poland
2
Department of Applied Physiology, Mossakowski Medical Research Centre, Polish Academy of Sciences,
Pawinskiego 5, 02-106 Warsaw, Poland
Keywords:
Ambulatory Monitoring, Impedance Pneumography, Cardiorespiratory Activity, Motion, Pulse Oximetry.
Abstract:
Holter-type devices with sets of sensors, enabling long-term measurement of quantitative respiratory parame-
ters, were designed and constructed. Pneumonitor 2 was intended for physiologic and athletic applications, and
Pneumonitor 3 for sleep studies. Both allow simultaneous, comfortable, ambulatory monitoring of cardiorespi-
ratory activity, such as ECG, impedance pneumography (IP), and motion; the second device also allows pulse
oximetry and uses improved setting with combined receiving ECG and IP electrodes. Preliminary results
showed that our prototypes provide signals reliable to monitor heart and breathing activity quantitatively. We
tested the devices in different conditions, including walking, stair-climbing, cycle ergometer training, natural
daily activity, and sleep. They can quantitatively measure respiratory flows, volumes, and minute ventilation
using IP after calibration. They are also able to estimate tachogram from ECG. They allow the detection of
subject activity and body position via accelerometer and gyroscope, which is helpful during IP calibration
and interpretation. Pneumonitor 3 also enables measurement of blood saturation with a pulse wave (pulse
oximetry).
1 INTRODUCTION
1.1 Traditional Respiratory Monitoring
Respiratory monitoring is mainly based on airflow
measurement using spirometry and longer record-
ing of flows and volumes with pneumotachometry
(PNT ), allow one to assess obstruction, restriction,
and other issues in patients with asthma and chronic
obstructive pulmonary disease (Miller et al., 2005).
These methods measure flow values directly and are
the most accurate. However, they are hard to use in
ambulatory conditions and cannot be performed in an
outpatient setting. In clinical practice, respiratory pa-
rameters are considered only for conditions which al-
low connection to a tube, not for natural daily and
nightly functioning or athletics outside a gym.
The ability to record respiratory effort and quan-
titative flow- and volume-related parameters (as well
as inspiratory and expiratory phases, and respiratory
rate) in new settings could be of real benefit and im-
pact both for physiologists and for sport medicine ex-
perts.
1.2 Ambulatory Respiratory
Monitoring
Traditional examination captures a single point in
time. From a clinical point of view, additional testing
carried out under more natural conditions and taking
into account activity, circadian rhythms, etc., could
expand early diagnosis.
Another factor is sleep; respiratory activity is
known to weaken during the night (McNicholas,
1997). Basic analysis commonly performed during
polysomnography consists of detection of snoring and
central or obstructive sleep apnea, e.g., in connection
with blood saturation and heart activity (Hoyer et al.,
2001; Roebuck et al., 2013). The breathing patterns
are usually measured indirectly by a belt and a can-
nula, which make sleep less natural and comfortable.
There are some methods, which could be consid-
ered as an alternative to PNT , impedance pneumog-
raphy, respiratory plethysmography, or acoustical ap-
proach. Based on the context of continuous studies,
breathing could be precisely described by simple pa-
rameters: minute ventilation, tidal volume, and res-
piratory rate. All of these could be determined with
MÅ
´
CyÅ
ˇ
Dczak M., Å
˙
zyliÅ
ˇ
Dski M., Niewiadomski W. and Cybulski G.
Ambulatory Devices Measuring Cardiorespiratory Activity with Motion.
DOI: 10.5220/0006111700910097
In Proceedings of the 10th International Joint Conference on Biomedical Engineer ing Systems and Technologies (BIOSTEC 2017), pages 91-97
ISBN: 978-989-758-216-5
Copyright
c
2017 by SCITEPRESS – Science and Technology Publications, Lda. All rights reserved
91

impedance pneumography (IP), which seems to be
the most accurate in terms of shape of the volume-
related signals. It is known that this method can be
used to measure ventilation in ambulatory settings
(Seppa et al., 2010; Mlynczak et al., 2015). IP could
be performed during sleep along with Holter ECG
monitoring.
1.3 Motion and Heart Activity
It has been noted that the calibration coefficients con-
verting impedance to volume are dependent mainly
upon subjects and body positions (breathing depth
and rate were of less impact) (Mlynczak et al., 2015).
Therefore, the reliable calibration procedure should
concern measurements performed in various body po-
sitions, and it would be worthwhile to track the cur-
rent position during IP measurements to apply spe-
cific calibration coefficient.
Motion tracking seems also very important with
regards to sleep studies, e.g., for hypnogram estima-
tion. The motion-associated artifacts in IP signal
could be adaptively removed, smoothed, or marked
using a motion signal synchronized with the respira-
tory one, without any cooperation from the subject.
Based on the present guidelines, each sleep study
device should be equipped with pulse oximetry and
heart activity registration unit (Collop et al., 2007).
Furthermore, the simultaneous analysis of heart activ-
ity along with respiratory one could allow assessment
of the autonomic nervous system operation (e.g., au-
tonomic heart regulation investigated from heart rate
variability). Such experiments are rarely carried out
under natural conditions. Grossman et al. (Grossman
and Taylor, 2007) suggested that the depth and the
frequency of breathing affect heart activity in differ-
ent way and presented different physiological mech-
anisms of control between heart rate and heart rate
variability.
1.4 Objective
The aim of the study was to prepare portable de-
vices which would register respiratory activity (using
impedance pneumography) together with ECG, mo-
tion, and/or pulse oximetry (saturation, pulse wave)
for physiologic and sport applications, and sleep stud-
ies.
Figure 1: Pneumonitor 2 measurement device.
2 METHODS
2.1 The Devices
Pneumonitor 2 was made as a modification of the first
version (Mlynczak et al., 2014), extending the device
sensors (IP, ECG, and motion) and power manage-
ment. It is presented in Fig. 1.
Pneumonitor 2 is 14.2cm x 6.9cm x 2.3cm and has
a weight of 160g. It is based on the tetrapolar
impedance measurement method with a sinusoidal
application current with an amplitude adjustable up
to 1mA, and 100kHz frequency.
We improved power management by replacing the
elements that consumed the most energy, and by us-
ing a rechargeable battery, similar to those found in
mobile phones, with 900mAh capacity. This allowed
measurement for at least 12h and SD card recording,
with a 250Hz sampling frequency. The sampling fre-
quency is chosen as a compromise between the output
data size, the possible jitter in the estimation of the R-
wave fiducial point, and the accuracy sufficient from
sleep studies perspective (Task Force, 1996).
ECG amplifier has the gain of 100V /V , the band-
width up to 100Hz, 10nV /sqrt(Hz) noise and 10bit
resolution). InvenSense’s MPU-6050 (accelerometer
and gyroscope unit, available commercially) was em-
ployed to estimate motion.
Wireless communication was omitted since no
clinical necessity for online analysis of results was
noted. A very small OLED screen was added to show
signal waveforms. A simple, native PC application
capable of exploratory data analysis and recording of
samples in a database was also prepared.
Pneumonitor 3 had the same IP, ECG, and mo-
tion components. It differed due to the addition of a
wireless pulse oximetry module (Contec CMS50EW,
commercially available), connected to the main de-
BIODEVICES 2017 - 10th International Conference on Biomedical Electronics and Devices
92
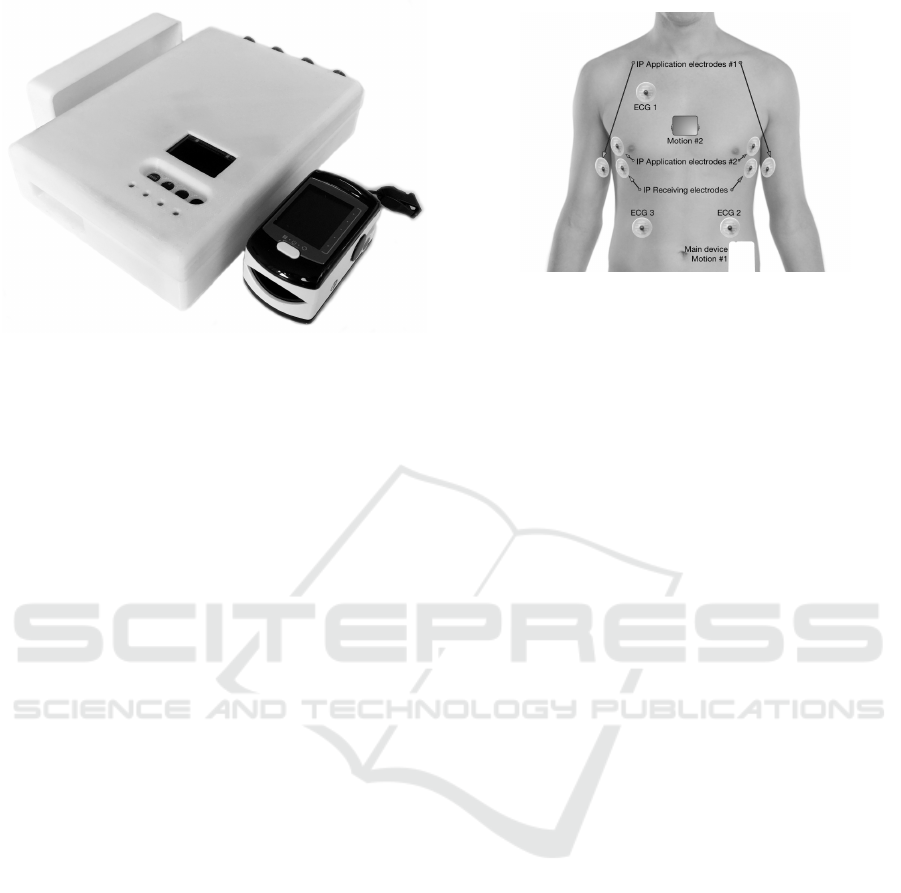
Figure 2: Pneumonitor 3 device with pulse oximeter.
vice via Bluetooth communication. It had a custom-
made housing, which was more solid due to the ex-
pected operating conditions (e.g., regarding the possi-
bility to connect the device to A/D converter via BNC
connectors). It uses improved setting of electrodes de-
scribed in the Configuration section. Pneumonitor 3
prototype is 16.7cm x 10.1cm x 3.5cm with a weight of
330g. It is presented in Fig. 2.
2.2 Configuration
Pneumonitor 2 has 7 leads, intended to be attached
using standard spot, disposable ECG electrodes: 4 for
IP and 3 for single-lead ECG. Pneumonitor 3 has
5 leads, 2 receiving ECG electrode were combined
with IP inputs - both signals could be easily separated
based on different frequency spectra.
The devices provide two preset levels of internal
amplification in the impedance receiving chain, in or-
der to adjust the measuring range depending on the
electrode configuration.
Pneumonitor 2 and Pneumonitor 3 are intended
to be used with one of two electrode configurations.
First, the one proposed by Seppa et al. likely pro-
vides the best linearity between impedance and vol-
ume changes; in this configuration, the receiving elec-
trodes were placed on the midaxillary line at about
5th- and 6th-rib level and the application electrodes
were mounted on the proximal side of the arm at the
level of the receiving ones (Seppa et al., 2013). The
second configuration is a ”classical” one, where both
application and receiving electrodes are positioned at
about 5th- and 6th-rib level. It is considered worse in
terms of transition linearity, yet most likely optimal in
terms of motion artifacts.
The voltage-to-impedance transition function was
established for two settings of internal input ampli-
fication. We confirmed that the function is linearly
Figure 3: The scheme for positioning of electrodes for
impedance pneumography and ECG, and of sensors for mo-
tion tracking. #1 - proposed in (Seppa et al., 2013); #2 -
”classical” one; positions of IP inputs are the same for both
configurations; for Pneumonitor 3 they are combined with
receiving ECG electrodes (ECG1 and ECG2).
dependent on the amplification setting.
ECG could be registered by Pneumonitor 2 using
various electrode configurations. For basic measure-
ments, we used differential electrodes placed below
the right clavicle on the chest and below the left 12th
rib. A reference electrode was then placed below the
right 12th rib, roughly symmetric to the second elec-
trode across the sagittal plane.
Different strategies could be applied for motion
measurement using accelerometer and gyroscope.
Fig. 3 shows a full schematic for placement of elec-
trodes and proposed placement of motion sensors.
Saturation level and pulse wave were measured
with the finger sensor.
2.3 Cardiac Component in Impedance
Signal
We observed that electrical heart activity is a com-
ponent of the raw signal registered using impedance
pneumography. Despite having the option to extract
the ECG-like signal (cardiac IP component), we did
not remove the one-lead ECG unit, because:
• the ratio of amplitudes of cardiac and respiratory
IP components in raw impedance signals changes
during breathing and differs depending on the
subject,
• the cardiac IP component is smoothed compared
to the real ECG signal, particularly during the
QRS complex,
• the cardiac IP component is registered with a spe-
cific electrode configuration optimized for respi-
ratory, not cardiac recordings, and
• the one-lead E CG signal could be recorded for
various configurations and synchronized with the
Ambulatory Devices Measuring Cardiorespiratory Activity with Motion
93
distorted IP signal, allowing its adaptive filtration.
2.4 Evaluation
The described devices are intended to be used in ex-
tensive study taking into account physiology-, sport-
and sleep-related protocols. To validate the relia-
bility of the respiratory- and E CG-related parts of
the devices we performed the calibration procedure
(free 30-second-lasting breathing in supine, sitting
and standing), and the test procedure consisting of
6 normal breaths and then 6 deep breaths (with the
subjective difference), for three breathing rates (6, 10
and 15 BPM) and for the same three body positions
as during calibration (Mlynczak et al., 2014).
Based on the reference PNT (from Pneumota-
chometer M909, by Medikro Oy, Finland, and Simp-
son’s quadrature for integration of flow values into
volumes), we fitted the best linear model without in-
tercept (after mean value removal) between PNT and
respiratory IP component (after subtraction of the
smoothed (respiratory-related) signal from the raw
one). The calibration coefficient was used to convert
the impedance signal into volumes. We evaluated the
accuracy of tidal volume estimation by analysis of the
difference between maximum and minimum value of
volume for each breathing cycle, between reference
PNT signal and respiratory IP component after ap-
plying the calibration coefficient.
We also estimated and compared heart rates from
ECG and cardiac IP component signals using adap-
tive amplitude thresholding method (after drift re-
moval). The RR intervals were calculated as a
difference between two consecutive R points, and
tachogram were transformed to beats per minute
(BPM) and interpolated to 250Hz in order to have the
same number of samples as original IP or ECG.
The preliminary pilot testing was carried out on a
group of 10 participants (all males). MATLAB soft-
ware was used to review and analyze the results.
In order to evaluate qualitatively the acquired sig-
nals and the usability from subjects’ perspective, we
also asked to carry out testing during more ”natural”
conditions: walking, climbing stairs, exercising on a
cycle ergometer for 90 seconds with the increasing
load (from 50W to 200W). The activity and changing
positions on a bed were tested during sleep.
3 RESULTS
Simultaneous ECG, IP, and PNT recordings during
the static test and cycle-ergometer exercise showed
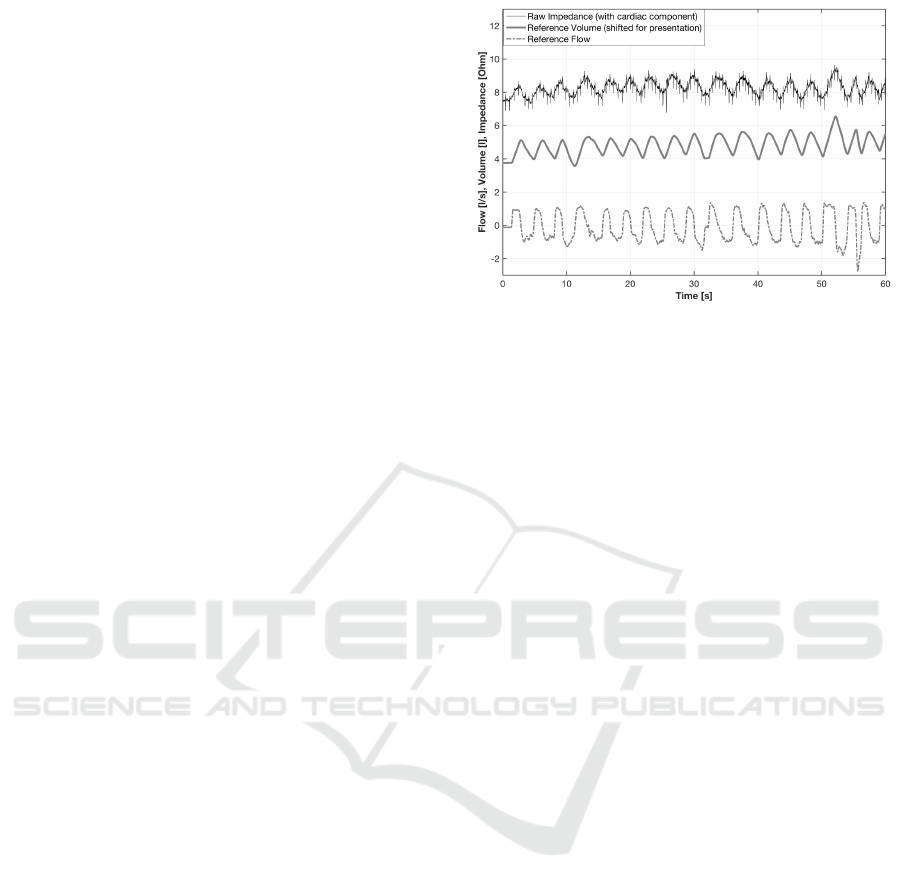
Figure 4: Sample impedance pneumography signal with-
out removal of the ECG component and pneumotachometry
signals, obtained during exercising on a cycle ergometer.
that the quality of the signals allows one to calculate
the tachogram, respiratory rate, and tidal volume.
The mean overall accuracy of tidal volume estima-
tion for the static test was 86.5%. Heart rate estima-
tion based on cardiac IP component, for supine body
position, reached mean 97.3% agreement in compari-
son with ECG.
No artifacts that might preclude analysis (with-
out the one at the beginning of some motions) were
shown during pilot evaluation in natural situations,
e.g., changing positions on a bed or walking.
Fig. 4 provides sample raw IP signal measured
while exercising on a cycle ergometer (with pneumo-
tachometry flow and volume signal). Sample record-
ings of IP and ECG with breathing phases and HRV
analysis were presented in Fig. 5. Finally, Fig.
6 presents sample smoothed blood saturation data,
along with pulse wave, the IP signal distorted with
motion artifact, the 3-axis accelerometry signal and
ECG, registered during sleep.
4 DISCUSSION
The first ambulatory system was described by Vuorela
at al. (Vuorela et al., 2010). In contrary to their con-
struction, we decided to remove most of the analog
blocks for signal conditioning and processing and ex-
pand the analysis performed simultaneously after sig-
nal acquisition. The key novelties are adding the abil-
ity to measure blood saturation and pulse wave, and
reducing the number of electrodes in Pneumonitor 3,
from 7 to 5, which could be particularly useful for
subjects’ comforts during sleep studies.
Our prototypes will allow further research to con-
firm whether the use of IP as a clinically relevant
method is possible in ambulatory conditions (in par-
BIODEVICES 2017 - 10th International Conference on Biomedical Electronics and Devices
94
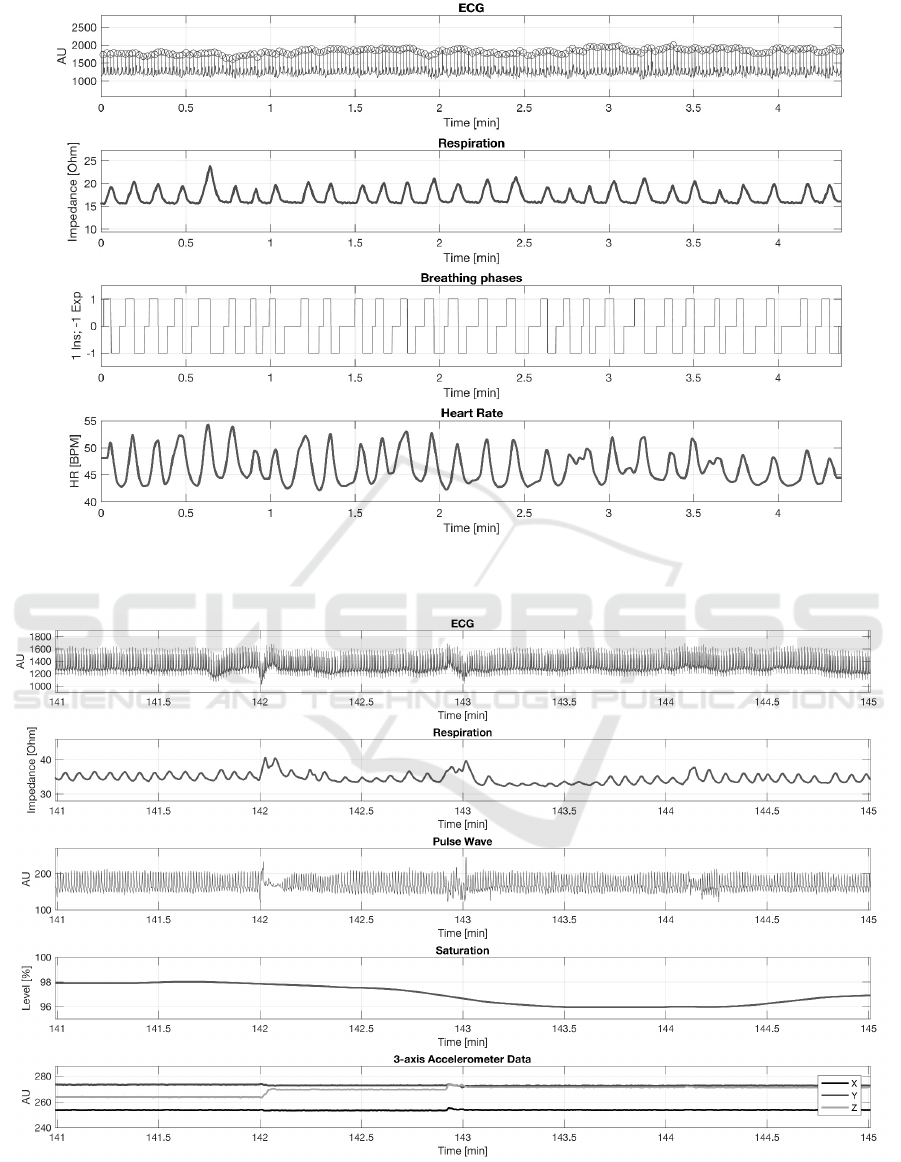
Figure 5: Sample ECG and IP signals and correspondingly calculated respiration phases and tachogram; recorded using
Pneumonitor 2.
Figure 6: Sample ECG, smoothed impedance pneumography, pulse wave, smoothed blood saturation and accelerometry
signals; with motion artifacts connected to the body position changes around 142 and 143 minutes of measurement; recorded
during sleep using Pneumonitor 3.
Ambulatory Devices Measuring Cardiorespiratory Activity with Motion
95

ticular, whether it is feasible to measure quantitative
parameters, particularly tidal volume and minute ven-
tilation, as well as breathing phase timing, under ”dy-
namic” conditions).
In our previous work, we confirmed that a cali-
bration procedure is needed (particularly for various
body positions) to measure quantitative parameters
with accuracy comparable to the reference. However,
we provided those results and consideration for static,
”clear” conditions. They were free of possibly dis-
torting maneuvers, such as irregular, shallow, inter-
mittent breathing; quick movements; changes in elec-
trode attachment (pressure of contact with the skin);
or non-breathing-associated changes in the volume of
the thorax, etc. These could influence the calibration
coefficient in a way that would only allow one to state
qualitative information about the depth of breathing.
One-lead ECG appears to provide results that do
not allow clinical investigation and diagnosis, but do
allow screening-like conclusions with greater com-
fort. Occurrences of the cardiac IP component may
lead to the concept of removing the classic ECG mea-
surement, however it seems, that cardiac IP compo-
nent is not fully visible in each participant. In our
opinion, if we are able to use the same electrodes to
measure impedance and ECG signal, it will be worth
having the redundant measurements for verification
purposes.
Removing separated ECG input for combined one
is prepared in order to improve the usability of Pneu-
monitor 3. It is also related with motion tracking. We
decided to limit ourselves to a single inertial unit (in-
cluding both accelerometer and gyroscope sensors)
to maintain comfort and accuracy of detecting basic
body positions and activity levels (Bouten et al., 1997;
Ermes et al., 2008).
5 CONCLUSIONS
Prototypes of two devices intended for cardiorespi-
ratory measurements in ambulatory conditions (with
motion tracking, including activity and body position
changes) were prepared and preliminarily evaluated.
The devices utilize impedance pneumography
to calculate respiratory parameters (tidal volume,
minute ventilation and respiratory rate) after calibra-
tion, ECG to record heart activity, and a combina-
tion of 3-axis accelerometer and gyroscope to track
motion. Pneumonitor 3 also includes pulse oximetry
providing saturation and pulse wave, and uses 5 elec-
trodes setting with 2 ECG electrodes combined with
receiving I P ones.
Pneumonitor 2 is designed for the environment
physiology analyses (registering ventilation and car-
diac functioning in subjects with obesity or nervous-
muscle-related illnesses) and sports medicine (for am-
bulatory diagnostics, monitoring training, and deter-
mining exercise capacity). Pneumonitor 3 is intended
mainly for sleep studies to monitor breathing disor-
ders and the treatment progress.
REFERENCES
Bouten, C. V., Sauren, A. A., Verduin, M., and Janssen, J.
(1997). Effects of placement and orientation of body-
fixed accelerometers on the assessment of energy ex-
penditure during walking. Med Biol Eng Comput,
35(1):50–56.
Collop, N. A., Anderson, W. M., Boehlecke, B., Claman,
D., Goldberg, R., Gottlieb, D., Hudgel, D., Sateia, M.,
and Schwab, R. (2007). Clinical guidelines for the
use of unattended portable monitors in the diagnosis
of obstructive sleep apnea in adult patients. J Clin
Sleep Med, 3(7):737–747.
Ermes, M., Parkka, J., Mantyjarvi, J., and Korhonen, I.
(2008). Detection of daily activities and sports with
wearable sensors in controlled and uncontrolled con-
ditions. IEEE T Inf Technol B, 12(1):20–26.
Grossman, P. and Taylor, E. W. (2007). Toward under-
standing respiratory sinus arrhythmia: relations to car-
diac vagal tone, evolution and biobehavioral func-
tions. Biol Psychol, 74(2):263–285.
Hoyer, D., Frasch, M., Eiselt, M., Hoyer, O., and Zwiener,
U. (2001). Validating phase relations between cardiac
and breathing cycles during sleep. IEEE Eng Med
Biol, 20(2):101–106.
McNicholas, W. (1997). Impact of sleep in respiratory fail-
ure. Eur Respir J, 10(4):920–933.
Miller, M. R., Crapo, R., Hankinson, J., Brusasco, V., Bur-
gos, F., Casaburi, R., Coates, A., Enright, P., van der
Grinten, C. M., Gustafsson, P., et al. (2005). General
considerations for lung function testing. Eur Respir J,
26(1):153–161.
Mlynczak, M., Niewiadomski, W., Zylinski, M., and Cy-
bulski, G. (2015). Assessment of calibration methods
on impedance pneumography accuracy. Biomed Eng-
Biomed Te, 61(6):587–593.
Mlynczak, M. C., Niewiadomski, W., Zylinski, M., and Cy-
bulski, G. P. (2014). Ambulatory impedance pneu-
mography device for quantitative monitoring of volu-
metric parameters in respiratory and cardiac applica-
tions. In Computing in Cardiology, pages 965–968.
Roebuck, A., Monasterio, V., Gederi, E., Osipov, M., Behar,
J., Malhotra, A., Penzel, T., and Clifford, G. (2013). A
review of signals used in sleep analysis. Physiol Meas,
35(1):R1.
Seppa, V. P., Hyttinen, J., Uitto, M., Chrapek, W., and Viik,
J. (2013). Novel electrode configuration for highly lin-
ear impedance pneumography. Biomed Eng-Biomed
Te, 58(1):35–38.
BIODEVICES 2017 - 10th International Conference on Biomedical Electronics and Devices
96

Seppa, V.-P., Viik, J., and Hyttinen, J. (2010). Assessment
of pulmonary flow using impedance pneumography.
IEEE T Bio-Med Eng, 57(9):2277–2285.
Task Force, E. S. C. (1996). Heart rate variability stan-
dards of measurement, physiological interpretation,
and clinical use. Eur Heart J, 17:354–381.
Vuorela, T., Seppa, V. P., Vanhala, J., and Hyttinen, J.
(2010). Design and implementation of a portable
long-term physiological signal recorder. IEEE T Inf
Technol B, 14(3):718–725.
Ambulatory Devices Measuring Cardiorespiratory Activity with Motion
97
