
Reconstruction of Mitochondrial Genotypes from
Diverse next Generation Sequencing Datasets
Peter Ulz
1
, Michael R. Speicher
1
and Gerhard G. Thallinger
2
1
Institute of Human Genetics, Medical University Graz, Harrachgasse 21, Graz, Austria
2
Institute of Molecular Biotechnology, Graz University of Technology, Graz, Austria
Keywords: Mitochondria, Next-generation Sequencing, Sequence Read Archive.
Abstract: The exponential growth of sequence databases in recent years opens up a lot of possibilities for reanalysis of
public datasets. Here, we reanalyzed sequencing data from various experimental procedures to reconstruct
the mitochondrial genome from sequence data of human samples. In a first step eight human cell lines were
used to validate the approach and to ensure consistent genotype information across different library
preparation techniques. Subsequently, 19,337 sequencing datasets were downloaded and checked for single-
nucleotide variants and insertion or deletion events. We show that the mitochondrial genome can be inferred
from many different library preparation techniques. We also generated reference mitochondrial genomes for
eight cell lines. This approach may be used for sample identification as well as a general approach to study
the mitochondrial genome from public sequencing data.
1 INTRODUCTION
Currently, the Sequence Read Archive (SRA)
comprises over 2x10
15
sequenced nucleotides, which
can be freely accessed (Sequence Read Archive
2015). This makes it an invaluable resource for
many different applications in computational
biology (Sequence Read Archive 2015). Many of
these datasets are based on high-throughput
sequencing protocols which target certain regions in
the genome and enrich those by various methods.
However, since enriching for these sequences is not
100% effective, many non-target regions are
sequenced as well which are usually discarded in
downstream analyses (Mamanova et al. 2010).
Mitochondrial DNA should be especially
represented in various DNA sequencing techniques,
since the mitochondrial genome is much more
abundant in the cell than human nuclear DNA. In
fact, this has already been shown in exome
sequencing data (Diroma et al 2014) and proposed
for RNA-Seq data (Smith et al. 2013). The
mitochondrial genome plays an important role in
genetics and it is estimated that between 1 in 4,500
and 1 in 6,000 individuals are affected by mutations
in the mitochondrial DNA (mtDNA) (Taylor et al.
2005). Furthermore, mtDNA can help in delineating
evolution in human and other species (Cann et al.
1987). However, the SRA contains data of a
multitude of different library preparation methods
and thus might be a useful complementary resource
to analyze the mitochondrial genome. This could be
useful in several ways: Firstly, the mitochondrial
genome constitutes a sample specific "fingerprint"
and may be used to track samples throughout
various experiments and detect sample-mixups in
large-scale databases. Moreover, the analysis of a
large pool of mitochondrial genomes might be the
foundation of a resource to estimate background
variability of variants in mitochondrial DNA, which
may facilitate the analysis of genetic diseases.
Here, we would like to investigate whether it is
possible to infer mitochondrial genotypes from
diverse public sequencing data in a more general
approach. In a first step, the validity is tested on
various enrichment methods from seven cell lines
and subsequently approximately 20,000 human
datasets represented in the SRA are analyzed to
demonstrate wide applicability of the method.
Ulz P., Speicher M. and Thallinger G.
Reconstruction of Mitochondrial Genotypes from Diverse next Generation Sequencing Datasets.
DOI: 10.5220/0006110200290036
In Proceedings of the 10th International Joint Conference on Biomedical Engineering Systems and Technologies (BIOSTEC 2017), pages 29-36
ISBN: 978-989-758-214-1
Copyright
c
2017 by SCITEPRESS – Science and Technology Publications, Lda. All rights reserved
29

2 METHODS
2.1 Low-coverage Whole-genome
Sequencing
DNA was extracted from cultured cell lines and
libraries were prepared using TruSeq DNA kits.
Single-end reads (150bp) were sequenced on the
Illumina Miseq (Illumina, San Diego, California),
which generated between 2.0 to 5.7 million reads
(mean: 3.73 million reads). This resulted in an
average coverage of the mitochondrial genome
between 60 and 172 (mean: 124.5).
2.2 HeLa Reference Sample
Preparation
The FastA file of a published HeLa mitochondrial
reference sequence was downloaded from Genbank
(Accession: JF682349 1). Then, using wgsim
(provided by the samtools package (Li et al,
2009A)), 20,000 synthetic 100bp paired-end reads
were generated with no InDels or SNPs introduced.
Subsequently, Read1 and Read2 FastQ files are
merged and the mitochondrial reconstruction was
performed as stated below.
2.3 Cell Line SRA Download
Firstly, a list of relevant SRA experiments is created
by searching human datasets in (Sequence Read
Archive, 2015) and selecting only public datasets of
DNA and RNA.
A list (240,748 entries) of experiments and
conditions was downloaded. Experiments from a
specific cell line were extracted from the list by
using grep. Some experiment types were skipped
due to:
Very specific enrichment or target (Amplicon-
seq, miRNA-Seq)
Very low read counts (Poolclone)
Protocols that alter the DNA sequence (Bisulfite
sequencing)
Datasets were retrieved automatically via Aspera
from the SRA and converted to FastQ files.
2.4 Additional Datasets SRA Download
Additional data sets were processed from the initial
dataset list and aforementioned experiment types
were omitted again. 19,337 datasets which passed
filters were processed.
2.5 Mitochondrial Genome
Reconstruction
In a first step, FastQ files were aligned against the
revised Cambridge reference sequence (rCRS; NC
012920.1; (Andrews et al. 1999)) using bwa (version
0.7.9) (Li et al. 2009B) and unaligned reads as well
as alignments with mapping quality lower than 15
were discarded. Subsequently, reads were aligned
against the combined hg19 nuclear DNA and the
rCRS sequence in order to remove nuclear DNA of
mitochondrial origin (numT). Alignments to the
nuclear hg19 genome were discarded and a pileup
file was created which contains every base on every
position of the rCRS sequence using samtools (Li et
al, 2009A). Every base having quality values lower
than 20 was discarded and the reconstruction of a
position was considered successful, if it was covered
by more than 10 reads and at least 80% of all the
reads showed the same nucleotide.
Table 1: Distribution of experiment types in SRA data from cell lines.
Cell line Samples WGS WXS RNA- ChIP- WGA FAIRE- FL- Other
HCT116 18 0 0 10 8 0 0 0 0
SKBr3 109 1 1 8 3 94 0 0 2
VCap 112 0 0 21 91 0 0 0 0
HT29 11 0 1 3 0 0 0 6 1
MCF7 91 0 0 8 64 0 0 0 19
HepG2 58 2 0 22 25 0 0 0 9
HeLa 32 0 1 10 14 0 4 0 3
LNCaP 178 0 0 72 77 0 0 0 29
BIOINFORMATICS 2017 - 8th International Conference on Bioinformatics Models, Methods and Algorithms
30
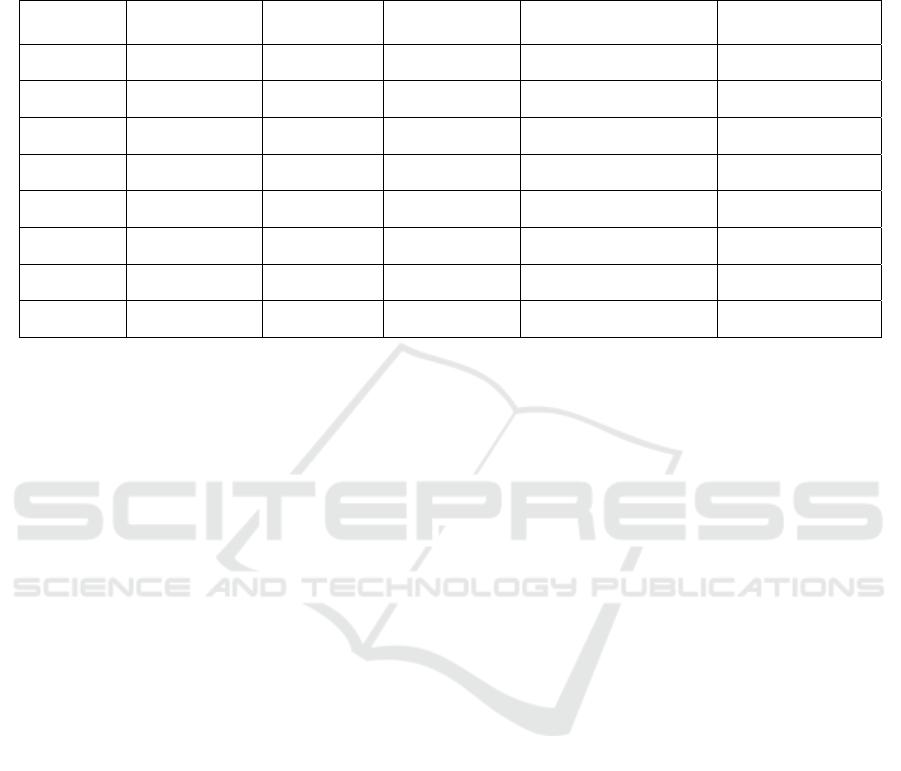
Table 2: Comparison of genotyping calls from cell line experiments of the SRA compared to low-coverage whole-genome
sequencing. For LNCaP, 4 runs from bisulfite-treated ChIP-Seq experiments were excluded. For HeLa, simulated reads
from a published mitochondrial reference sequence were used as a reference. SNPs species the number of concordant
genotype calls which were identified as variant in the low-coverage WGS cell line sample compared to the rCRS reference
sequence.
Cell line Haplogroup Samples # SNPs # concordant calls # discordant calls
HCT116 H 18 151 291,414 0
SKBr3 H 109 634 1,117,652 6
VCap Uk 112 1,004 1,058,712 4
HT29 Uk 11 211 140,503 0
MCF7 H 91 515 865,463 60
HepG2 B 58 1,048 735,901 27
HeLa L3 32 540 382,474 42
LNCaP H 174 942 1,748,613 31
2.6 Principal Component Analysis
In order to check whether the mitochondrial genome
of cell lines are consistently identified we applied
Principal Component Analysis (PCA) in R (R
Development Core Team, 2008) on every sample
where >95% of the genome was reconstructed.
Every base of the rCRS sequence was used and
specified as 0 if the wildtype genotype call was
identified. If a variant genotype was identified, “1”
was specified for that position; however, for
uncalled positions (due to low coverage, low
qualities or inconsistent calls) we assumed that bases
to be wildtype. PCA was done in R using the
prcomp function.
2.7 Haplogroup Identification
Haplogroups were identified by analyzing
haplogroup identifying markers (Lott et al. 2013) in
the genotype calls of the respective samples.
Samples were only analyzed when all defining
variants were successfully reconstructed.
3 RESULTS
3.1 Reconstruction of Cell Line
Mitogenomes
In order to check the validity of mtDNA
reconstruction, we performed low-coverage whole-
genome sequencing of seven cell lines (HT29,
HepG2, HCT116, LNCaP, MCF7, SKBr3 and
VCaP) and performed mitochondrial genome
reconstruction as a reference for comparison of other
experimental procedures. This data should be
especially suited, since the coverage along the
mitochondrial genome should be free of bias and no
nucleotide-altering reagents (e.g. bisulfite) were
used. We also included datasets from the HeLa cell-
line and compared those to a published
mitochondrial genome sequence of this cell line
(Genbank: JF682349 1). Moreover, reference
sequences for the mitochondrial genome sequences
were created. Next, we downloaded additional
datasets from these cell lines from the SRA, which
were analyzed by various library preparation
techniques and again performed the reconstruction
of the mtDNA (see table 1). Principal Component
Analysis (PCA) gives an overview of molecular
distances between the mitochondrial genome of the
cell lines (figure 1).
Exemplarily, we demonstrate mitochondrial
reconstruction from low coverage whole genome
sequencing, RNA-Seq and ChIP-Seq in the prostate
cancer cell line LNCaP (see figure 2).
Reconstruction of Mitochondrial Genotypes from Diverse next Generation Sequencing Datasets
31
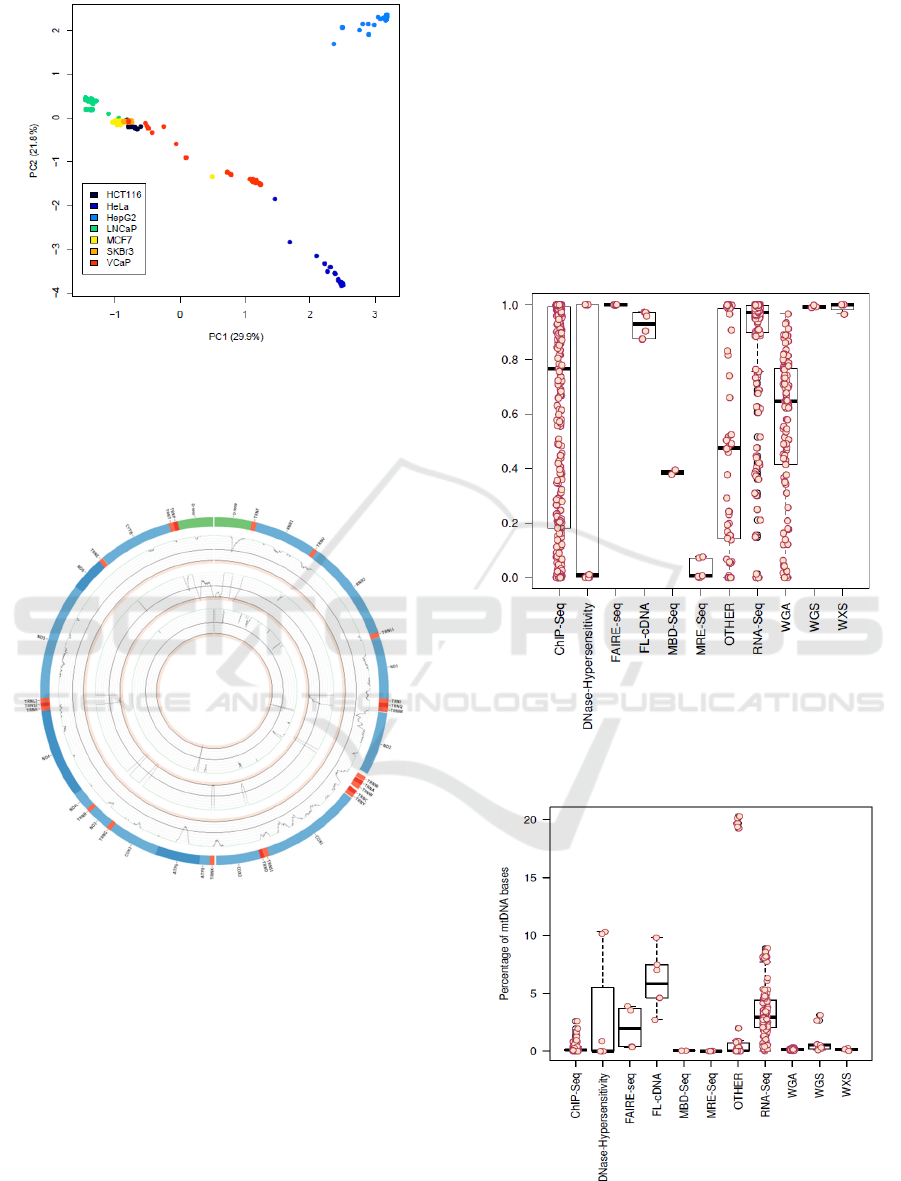
Figure 1: Principal component analysis of the cell lines
HCT116, HeLa, HepG2, LNCaP, MCF7, SKBr3 and
VCaP. While samples from HepG2, HeLa and LNCaP
separate nicely, MCF7, HCT116 and SKBr3 cluster very
close to each other. VCaP samples seem to appear in two
distinct clusters.
Figure 2: Circos plot demonstrating the coverage of the
mitochondrial genome reconstructed from low coverage
whole-genome sequencing (outer circle), RNA-Seq
(central circle) and ChIP-Seq (inner circle). Plots show
ranges from 0 to 100. Positions with coverage >100 are
reduced to 100 and are shown in green. Positions covered
with fewer than 10 reads are shown in red.
3.2 Reconstruction in Different
Experimental Settings
Since different experimental methods may have a
different impact on the presence of mitochondrial
DNA in the final sequencing library, we analyzed
the percentage of reconstructed bases per
experimental type (see figure 3). While RNA-Seq
and whole-exome sequencing (WXS) yield a very
high median reconstruction of the mitochondrial
genome (RNA-Seq 97.1% and WXS: 99.9%),
reconstruction of mtDNA from ChIP-Seq
experiments seems highly variable (median: 76.6%).
The percentage of mitochondrial sequences in a
sample also deviates a lot between different
experimental settings (see figure 4). In whole-
genome sequencing datasets, a median of 0.51 % of
all the bases sequenced aligned to the human
genome, which equals about 2000 mitochondrial
genomes per nuclear genome.
Figure 3: Fraction of reconstructed bases per experimental
type.
Figure 4: Percentage of bases aligning to the
mitochondrial genome of the sample per experimental
type.
BIOINFORMATICS 2017 - 8th International Conference on Bioinformatics Models, Methods and Algorithms
32
3.3 Genotype Discordance in Cell Lines
Overall, 609 cell line datasets were analyzed and
produced 6,340,732 concordant wildtype genotype
calls as well as 5,045 concordant variant genotype
calls (see table 2). However, 170 positions are called
discordantly between a sample and a reference. In
the LNCaP cell-line, 4 datasets produced deviations
to the reference samples in 971 genotypes. These
samples were prepared using a ChIP-Seq protocol
including bisulfite treatment and thus were excluded
from further analyses.
3.4 Mitochondrial Reconstruction as a
Tool to Detect Sample Mixups
Interestingly, a single MCF7 dataset showed
deviations to the reference MCF7 sample in 16
positions. Comparing this sample to other cell-line
reference samples showed a very close agreement
(agreement on every mitochondrial genotype but
one) to the HeLa sample. Also, one dataset
designated to be from HeLa deviated in 24
mitochondrial genotypes from the HeLa reference
sample and was predicted to be in haplogroup H
(unlike HeLa, which should be in haplogroup L3
(Herrnstadt et al. 2002)). Both of these samples were
sequenced in the same project (DRP001297) and
thus might have been mixed up during library
preparation. While some of the deviations between
the datasets and the reference samples can be
explained by possible sample mix-ups, others might
represent artifacts. In 39 samples a deviation at the
position 8860 (rCRS:8860A>G) was detected, where
the SRA samples (all were RNA-Seq experiments)
were called wildtype while the reference was called
variant. This might be an artifact due to numTs
contamination in non RNA-Seq experiments.
Another position seems to be frequently called
discordantly (rCRS:15838C>A). 13 samples were
called variant at that position, while the reference
sample was called wildtype. All of these 13 samples
were submitted by the same institution (Yan-Ming
University, Taiwan) under the following accessions:
(ERP004047, ERP004106 and ERP004151) and thus
may constitute a mutation specific to the sublineage
used by this facility.
Figure 5: Circos plot of the mitochondrial genome. Genes are depicted in the outer circle. Frequency of variants can be
found in the middle circle and samples analysed per positions are plotted in the inner circle.
Reconstruction of Mitochondrial Genotypes from Diverse next Generation Sequencing Datasets
33
3.5 Reconstruction on Additional SRA
Datasets
To analyze mitochondrial genotypes from various
next-generation sequencing experiments, we
downloaded additional 19,337 sequencing runs from
the SRA out of 240,748 publicly available datasets
from the human genome. Since some experiment
types might lead to false positive variant detection
due to nucleotide modifications (Bisulfite-
Sequencing), very low coverage due to low-
representation sequencing (Poolclone) or very
specific enrichment of target regions (Amplicon
sequencing and miRNA-Seq), these experiment
types were excluded from further analysis. The most
common types of experimental assays (if occurring
>1,000 times) are displayed in table 3. The
mitochondrial genome could be reconstructed at
>95% in 7,875 samples (40.7%) and a total of
257,820 variants were discovered at 4,427 positions
of the rCRS with 4,653 distinct substitutions. 883 of
these have not been described in the MITOMAP
database (Lott et al. 2013), 30 of which were found
in more than 10 samples. An overview of coverage
along the mitochondrial genome and mutation
frequencies across all the samples can be seen in
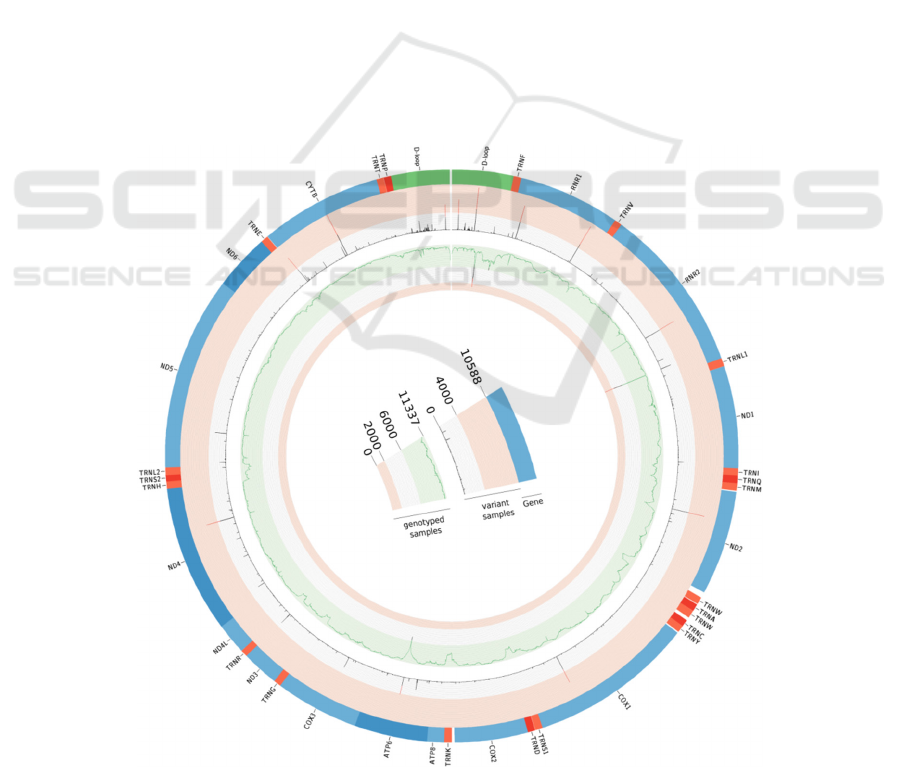
figure 5. Haplogroups could be identified in 5,842
samples and the distribution can be seen in figure 6.
Figure 6: Distribution of haplogroups from 5,842 samples
where all haplogroup identifying markers were
successfully reconstructed.
Table 3: Experiment types of available public datasets
from human. Only experimental types occurring >1000
times are displayed.
Experiment type Count Frequency
WGS 67771 28.2%
Poolclone 37309 15.5%
RNA-Seq 35457 14.7%
WXS 31718 13.2%
Other 20126 8.3%
ChIP_Seq 19905 8.3%
Amplicon 12131 5.0%
Bisufite-Seq 5263 2.2%
WGA 2824 1.2%
DNAse
Hypersensitivity
2439 1.0%
miRNA-Seq 1658 0.7%
4 DISCUSSION
Undoubtedly, publicly available sequencing data can
elucidate many areas in biology, even when original
experiments were not intended initially for that field
of research. Especially studying variation of
mitochondrial DNA might be suitable for analysis of
large sequencing databases, since its abundance
makes it accessible in a wide range of experimental
procedures in next-generation sequencing. In this
study, cell line data was analyzed in order to test the
validity of mitochondrial genome reconstruction
from off-target reads in next-generation sequencing
experiments which can be used to establish (cell
line) identity, detect sample inconsistencies and to
study mtDNA variation. By analyzing different
experimental assays from the same cell line, validity
of the approach was tested. It seems that a
mitochondrial genotype can be inferred from that
data, since only few positions were called
discordantly between assays. Some of these may
represent artifacts from the sequencing itself, while
some variant calls may be due to somatic mutations
at the mitochondrial genome. The 13 MCF7 samples
from the Yan-Ming University support this
assumption, since the most likely explanation of
these discrepancies is a somatic mutation in the
initial cell line used by this institution. This method
also may detect sample mix-ups, as seen in the
conflicting variant spectrum of a MCF7 and HeLa
experiment from the same project. Thus, an
automatic method to discover sample-mixups may
be deployed as an additional quality-control check
for large sequencing databases or sequencing
projects before actual uploading data.
BIOINFORMATICS 2017 - 8th International Conference on Bioinformatics Models, Methods and Algorithms
34

Furthermore, mitochondrial genotypes of 19,337
datasets from the SRA have been analyzed in this
study. Many substitutions and indels were identified
within these samples, some of which have not been
reported in the Mitomap project and may represent
rare variants. The methods used here are very similar
to the pipeline used to analyze exome sequencing
data of the 1000 genomes project (Diroma et al.
2014, Picardi et al. 2012). While they used a
sophisticated approach to recover putative
mitochondrial reads from hits to known NumT
sequences, this was not done here, to more
effectively analyse a diverse set of samples. Hence,
sequences similar to NumT sequences in the human
genome may be underrepresented in this analysis.
When searching for a mutation in patients with
suspected hereditary diseases, it is often crucial to
discern pathogenic variants from non-pathogenic
variants. Often, allele frequencies of a healthy
population may give a clue, since it is unlikely that a
pathogenic variant is seen in a large proportion of
"random" genomes. Here, we found 4,653
substitutions, 883 of which have not yet been
reported in the largest database of mitochondrial
variation (Lott et al. 2013). Also, 2,008 distinct
indels have been detected. Some of these may be
artifacts due to non-standard library preparation
types or inaccurate sequencing technologies. Using
the large database of sequencing experiments
provided by SRA might provide more clues on rare
allele frequencies on the mitochondrial genome than
have been available to date. However, since a
dedicated description of a sample regarding its
phenotypes is most often missing, this method may
detect rare variants, but probably may be of limited
use in discerning pathogenic variants from non-
pathogenic variants on the mitochondrial genome.
However, many possible difficulties may arise with
the automated approach of assigning mitochondrial
genotypes based on off-target sequencing data from
various experiments. Different library preparation
techniques alter the nucleotide sequence itself and
while the most common one (bisulfite sequencing)
has been excluded from this analyses, other lesser
common preparation techniques might introduce
their own pattern of sequence alteration. Also,
sequencing technology may introduce non-random
biases into the sequencing data if the error profile of
a technology is different depending on the DNA
context (e.g. Illumina's GGC-error (Nakamura et al.
2011)).
Furthermore heteroplasmy may represent a
challenge in correctly identifying mitochondrial
genotypes. Here, identification of heteroplasmy has
not been done, since it is hard to discern from
sequencing artifacts and NumTs.
Finally, it should be noted, that this method only
works well in experiments, where sequencing reads
on the mitochondrial genome can be found as a by-
product of non-specific binding or non-effective
removal of untargeted DNA. Hence, we think, in
order to further enable researchers to test new ideas
on data or reinterpret primary data sources, public
deposition of any kind of data should become
standard not only in biomedical research, but in
research in general.
REFERENCES
Sequence Read Archive (2015) Available from:
http://www.ncbi.nlm.nih.gov/Traces/sra/sra.cgi. [19
July 2015].
Mamanova L, Coffey AJ, Scott CE et al. (2010): "Target-
enrichment strategies for next-generation sequencing".
In: Nature Methods. 7 (2), S. 111-118, DOI:
10.1038/nmeth.1419.
Diroma MA, Calabrese C, Simone D et al. (2014):
"Extraction and annotation of human mitochondrial
genomes from 1000 Genomes Whole Exome
Sequencing data". In: BMC Genomics. 15 (Suppl 3),
S. S2, DOI: 10.1186/1471-2164-15-s3-s2.
Smith DR. (2013): "RNA-Seq data: a goldmine for
organelle research". In: Briefings in Functional
Genomics. 12 (5), S. 454-456, DOI:
10.1093/bfgp/els066.
Taylor RW.Turnbull DM. (2005): "Mitochondrial DNA
mutations in human disease". In: Nature Reviews
Genetics. 6 (5), S. 389-402, DOI: 10.1038/nrg1606.
Cann RL, Stoneking M, Wilson, AC. (1987):
"Mitochondrial DNA and human evolution". In:
Nature. 325 (6099), S. 31-36, DOI:
10.1038/325031a0.
Herrnstadt C, Preston G, Andrews R et al. (2002): "A high
frequency of mtDNA polymorphisms in HeLa cell
sublines". In: Mutation Research/Fundamental and
Molecular Mechanisms of Mutagenesis. 501 (1-2), S.
19-28, DOI: 10.1016/s0027-5107(01)00304-9.
Lott M, Leipzig JN, Derbeneva O et al. (2013): "mtDNA
Variation and Analysis Using MITOMAP and
MITOMASTER". In: Current Proctocols in
Bioinformatics 44, pp. 1.23.1{1.23.26. doi:
10.1002/0471250953.bi0123s44.
Picardi E, Pesole G (2012): "Mitochondrial genomes
gleaned from human whole-exome sequencing". In:
Nature Methods. 9 (6), S. 523-524, DOI:
10.1038/nmeth.2029.
Nakamura K, Oshima T, Morimoto T et al. (2011):
"Sequence-specific error profile of Illumina
sequencers". In: Nucleic Acids Research. 39 (13), S.
e90-e90, DOI: 10.1093/nar/gkr344.
Reconstruction of Mitochondrial Genotypes from Diverse next Generation Sequencing Datasets
35

Li H, Handsaker B, Wysoker A et al. (2009): "The
Sequence Alignment/Map format and SAMtools". In:
Bioinformatics. 25 (16), S. 2078-2079, DOI:
10.1093/bioinformatics/btp352.
Andrews RM, Kubacka I, Chinnery PF et al. (1999):
"Reanalysis and revision of the Cambridge reference
sequence for human mitochondrial DNA". In: Nature
Genetics 23 p. 147.
Li H, Durbin R. (2009): "Fast and accurate short read
alignment with Burrows-Wheeler transform". In:
Bioinformatics. 25 (14), S. 1754-1760, DOI:
10.1093/bioinformatics/btp324.
R Development Core Team. (2008): "R: A Language and
Environment for Statistical Computing. ISBN 3-
900051-07-0. R Foundation for Statistical
Computing". Vienna, Austria, 2008. url:
http://www.R-project.org.
MitoMap Haplogroup markers.(2015) Available from:
http://www.mitomap.org/bin/view.pl/MITOMAP/Hapl
ogroupMarkers. [19-July-2015].
BIOINFORMATICS 2017 - 8th International Conference on Bioinformatics Models, Methods and Algorithms
36
