
Laser Micro-Structuring on Glass Substrates with Compensation
Function for Multi-wavelength Mixed Laser Diode Module
Yi-Cheng Lin, Chih-Chung Yang, Kuo-Cheng Huang and Wen-Tse Hsiao
Instrument Technology Research Center, National Applied Research Laboratories, 20, R&D Rd. VI. Hsinchu Science Park,
Hsinchu City, Taiwan
Keywords: Ultraviolet Laser System, Multi-wavelength Mixed Light Module, High-Speed Galvanometric Scanner,
Surface Micro-Structures, Laser Matter Interaction, Light Compensation Effects, Chrominance.
Abstract: A glass substrate has excellent optical transmittance for the visible spectrum (400–700 nm). This study used
three type glass (D263T
TM
, EAGLE XG
○,
R
, and BK7) for laser micro-structuring in the light compensation
technique applied to a multi-wavelength mixed light module. An ultraviolet laser system combined with a
high-speed galvanometric scanner was used to fabricate microstructures on the specimen surface. The light
compensation chromaticity properties of the microstructures on glass substrates depended on the laser
machining conditions. The characteristics of the machined glass were systematically analyzed using a
spectrophotometer and charge-coupled device camera. The experimental results demonstrate that the
microstructures affected chromaticity under different laser micro-structuring pitches.
1 INTRODUCTION
Micro-projection technology comprises conventional
projection technology, including laser scanning,
digital lighting process, transmission LCD, and
liquid crystal on silicon. Limited by inherent size
and power loss issues, miniature projection optical
systems use light-emitting diodes (LEDs) or
collimated laser light sources. However, laser light
sources, with their high brightness, high single-
frequency, and high directivity, offer a higher
contrast and improved visual experience. In the
distribution of the color range, laser light sources
have high color saturation, yet retain the advantages
of other light sources used for projection. Micro-
projection technology is expected, in the next
generation, to be eventually replaced by laser light
sources with improved saturation and to contribute
to new products such as automobile lights.
However, laser light sources do not emit white
light, but generate it by mixing three different
wavelengths: red (R), green (G), and blue (B). As a
result, RGB laser light comprises different
wavelengths, and the intensity of its radiated energy
differs for colder or warmer colours. Several sources
in the literature discuss using laser sources to
fabricate periodic and non-periodic structures on
different materials.
(Florea, 2003) used a femtosecond laser to fabricate
the lines and curves of a waveguide structure on
silicate glass and a Fabry–Pérot resonator to measure
the waveguide loss. In addition, a 10-μm periodic
grating was annealed for different durations. The
results indicate that the diffraction efficiency was
approximately 8%. (Zheng, et al. 2004) and (Hee, et
al. 2005) used a femtosecond laser to produce a
periodic structure on fused silica and crystalline
silicon materials by using an interference
lithography method. (Zheng, et al. 2004) used a P-
polarization femtosecond laser to fabricate a crack-
free periodic grating structure with a 20-μm line
width, and the vertical microstructure had significant
polarization. (Hee, et al. 2005) used four types of
polarization modes to fabricate a periodic
microstructure. The results indicated that the
polarization mode affected the grating depth, surface
roughness, and removal threshold. (Florea et al.,
2008), (Cho et al., 2008), and (Ams et al., 2008)
used the femtosecond laser pulse properties to
produce a two-dimensional structure of the interior
of the glass substrate that could take advantage of
the light guide according to the principle of optical
glass translucent color and other optical properties.
(Oliveira et al., 2009) used a range of laser pulse
energy, from 0.5 J/cm
2
to 2 J/cm
2
, to produce micro-
, nano-, and nonperiodic titanium microstructures.
Lin Y., Yang C., Huang K. and Hsiao W.
Laser Micro-Structuring on Glass Substrates with Compensation Function for Multi-wavelength Mixed Laser Diode Module.
DOI: 10.5220/0006106601690174
In Proceedings of the 5th International Conference on Photonics, Optics and Laser Technology (PHOTOPTICS 2017), pages 169-174
ISBN: 978-989-758-223-3
Copyright
c
2017 by SCITEPRESS – Science and Technology Publications, Lda. All rights reserved
169
The results indicated that the shock wave diffused
outwards from the center. In addition, scan speeds
affected the periodic structure, making the laser
energy lower than the ablation threshold that could
generate various periodic micro- and nanostructures
on titanium substrates. (Hsiao, et al. 2016) used
simulation and experiment verification of pulsed
ultraviolet laser micromilling technology on soda-
lime and B270 glass, to discuss the effect depth and
surface roughness of laser milling parameters. The
experimental results indicated that the milling speed
increased with an increase in the pulse repetition
frequency. The milling depth increased with an
increase in the number of milling passes. This study
uses a UV laser source in conjunction with a
galvanometric scanner to fabricate microstructures
on three type glass (D263T
TM
, EAGLE XG
○,
R
, and
BK7) for laser micro-structuring in the light
compensation technique applied to a multi-
wavelength mixed light module..
2 LASER MICROMACHINING
SYSTEM AND PREPARED
SAMPLE
2.1 UV Laser Micro-milling System
and Sample Prepared for
Micro-structuring Fabrication
A diode-pumped solid-state (DPSS) Nd:YVO4 UV
laser (wavelength 355 nm, maximum output power
level 14 W, transverse mode TEM00, output beam
diameter 3.5 mm) (COHERENT, Inc., AVIA 355-
14) was combined with a high-speed galvanometer
system (Raylase AG model SS-15), in which a focus
shifter was used to adjust the focus range in the Z-
direction from +15 to −15 mm on an x/y axis
moving stage. A telecentric focusing lens with a
focal length of 163 mm and a scanning area of 60
mm2 was used for micromilling, and the operation
pulse repetition frequency ranged from 1 to 400
kHz. Table 1 summarizes the complete
specifications of the DPSS laser milling system.
Table 2 summarizes three types of substrates for the
microstructure fabrication, including a double-sided
polished Corning EAGLE XG
○,
R
glass and
SCHOTT D263T
TM
. The machined specimens were
cleaned in an ultrasonic cleaner with a solution of
75% alcohol and 25% distilled water. The specimens
were dried on a spin coater, followed by baking and
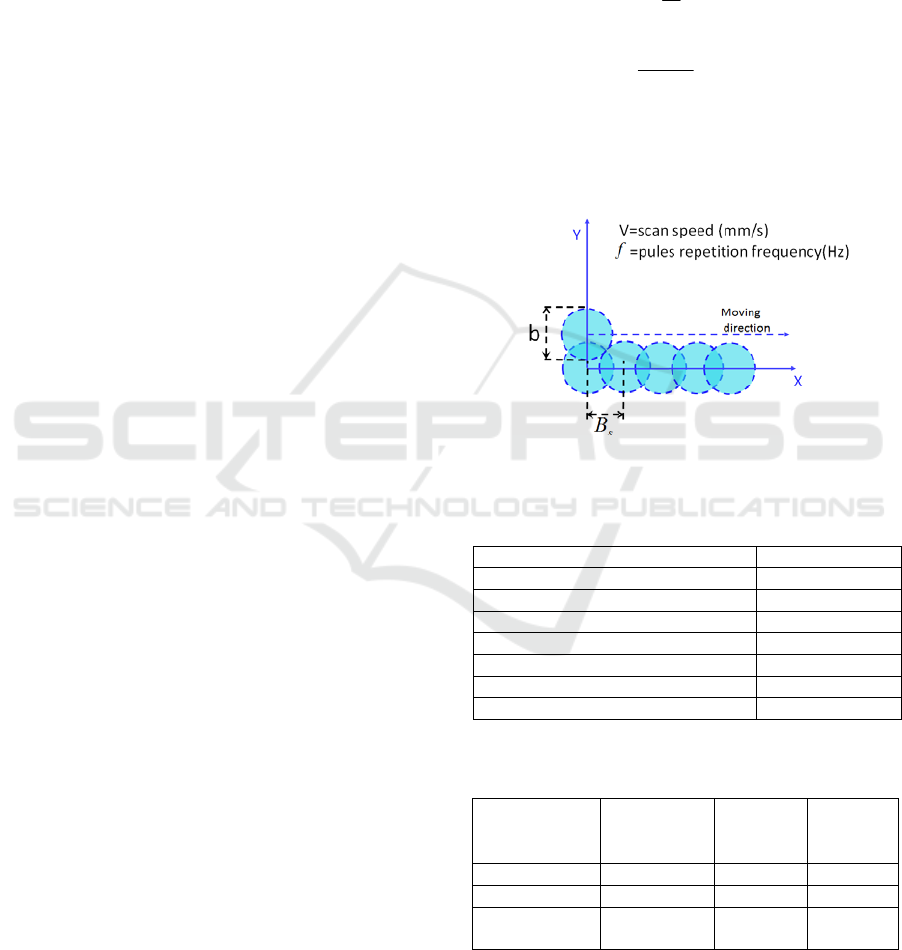
curing at 50 °C for 10 minutes. The overlapping rate
affected the milled edge quality, surface roughness,
and removal rate. The factors influencing the
overlapping rate included the scan speed of the
galvanometric unit, the frequency of the pulse
repetition, the diameter of the focused beam, and the
bite size of each overlapped laser beam. The bite
size and overlapping rate can be calculated using
Equations (1) and (2) respectively:
f
V
B
s
(1)
100(%)
b
Bb
O
s
R
(2)
where B
s
is the bite size (mm), V is the scan speed
(mm/s), f is the pulse repetition frequency (Hz), OR
is the overlapping rate, and b is the laser beam spot
size (mm) as shown in Figure 1.
Figure 1: Schematic diagram of the laser beam
overlapping rate.
Table 1: Specification of the DPSS laser milling system.
Item Parameters
Wavelength (nm) 355
Average power (watt) > 14
Laser mode TEM
00
Pulse repetition frequency (kHz) ~ 400
Pulse width (ns) 28
Focused beam size (μm) 30
Machining field (mm
2
) 60
Table 2: Three types of substrate for the microstructure
fabrication.
Material
Commercial
BK7
EAGLE
XG
○,
R
glass
D263T
T
M
glass
Polished DSP DSP DSP
Thickness 1.5 mm 0.7 mm 0.55 mm
Transmittance
(400-700nm)
> 87% > 92% > 87%
Three types of substrate with thicknesses of 0.7 mm
(EAGLE XG
○,
R
) and 0.55 mm (D263T
TM
) were
used for milling.
To evaluate the illumination,
uniformity, and chromaticity properties, the micro-
PHOTOPTICS 2017 - 5th International Conference on Photonics, Optics and Laser Technology
170
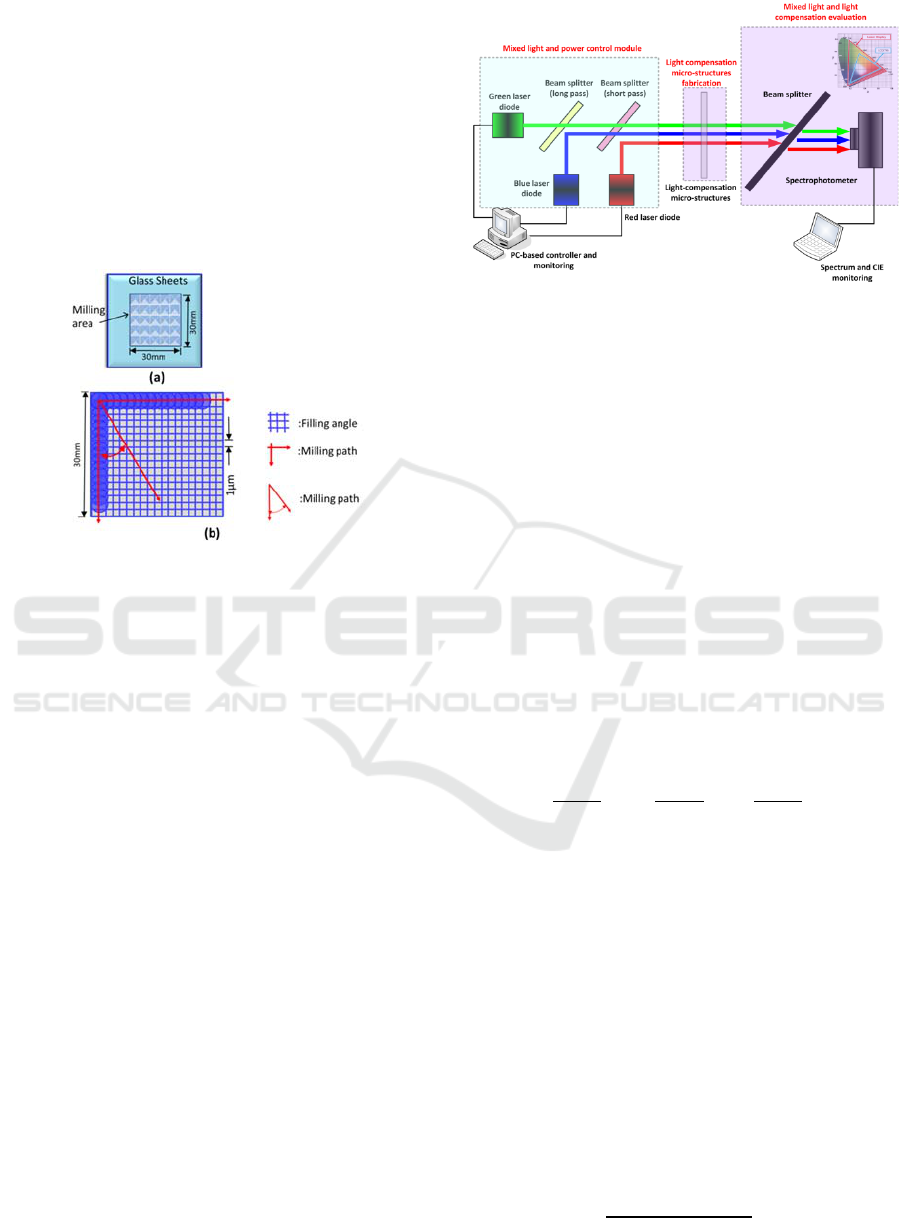
structuring area was fixed at 30 × 30 mm [see Figure
2 (a)]. Figure 2 (b) shows the schematic of the
planned laser milling path. Each milling area (30 ×
30 mm) was used for evaluation at intervals of 1 μm
in the horizontal and vertical directions. Moreover,
the milling angle of the horizontal path was set to 0°
and the vertical path was set to 90°. In addition, the
laser milling speed and frequency was fixed at 2000
mm/s and 100 kHz, respectively.
Table 3 shows the
laser milling parameters for the milling of Corning
EAGLE XG
○,
R
glass and SCHOTT D263T
TM
.
Figure 2: Experimental setup; (a) laser milling region and
(b) laser milling path planning.
3 MEASUREMENT SYSTEM
SETUP
Three monochromatic laser diodes providing R, G,
and B lights, respectively, were mixed sequentially
to assemble a mixed light measurement on the
platform for controlling the single lights (R, G and
B); two-color light mixing (R/G, G/B, and R/B); and
three-color light mixing (R/G/B).
These were subsequently combined with the
machined micro-structuring light compensation
optics. In addition, to characterize the color of the
samples, the transmittance spectra were measured
with a spectrophotometer (OtO, SE1220). From the
spectra evaluation, the standard CIE 1931
chromaticity coordinates of the different colors were
calculated. The illumination, uniformity, color, and
other indicators were measured before and after
compensation. Figure 3 shows the schematic
diagram of the measurement setup of the micro-
optical elements were configured to compensate for
various types of mixed light, according to the optical
properties of the model, for analyse their effects.
To understand the microstructural elements with
and without light compensation for the optical
Figure 3: Schematic diagram of the mixed light module
for RGB laser diode.
characteristics of each type of light-mixing mode of
influence, the laser light intensity calculation system
was analyzed with a laser power meter and laser
beam after quality measurements were recorded of
the actual instrument with microlight compensation
structures for laser power and spot quality. For color
uniformity and analysis, a spectrophotometer was
employed. In this study, the International
Commission on Illumination (CIE) 1931 standard
colorimetric analysis of post-RGB mixed laser light
sources, the common standard color matching
functions of R/G/B wavelengths were 671 nm/532
nm / 473 nm, and the sequential color ratio of 1 :
0.098: 0.329 is defined as the standard for mixed
white light.
The XYZ color space is the sum of the three
colors. Its two-dimensional coordinates are
calculated in Equation (3).
(3)
In addition, its color matching and power
distribution as converted by the RGB spectrum are
represented in Equation (4).
X
k
∙̅
∙y
Z
k
∙̅
(4)
where k is the normalized coefficient in Equation (5)
and P (λ) is the energy distribution of the light
source. In addition, the RGB, CIE, and XYZ values
constitute the 3 × 3 matrix in Equation (6).
k
100
∙
(5)
Laser Micro-Structuring on Glass Substrates with Compensation Function for Multi-wavelength Mixed Laser Diode Module
171
=
3.240479 1.537150 0.498535
0.96925 1.875992 0.041556
0.055648 0.204043 1.057311
*
=
0.412453 0.357580 0.180423
0.212671 0.715160 0.072169
0.019334 0.119193 0.950227
*
(6)
4 RESULTS AND DISCUSSION
4.1 Without Optical Component: RGB
Mixed Light Projection and CIE
Chromaticity Analysis
On the basis of the measurement architecture of
Figure 3, the RGB laser beams were directly
projected onto a white card, after which the voltage
of the lasers was adjusted and spectra of the mixed
laser spots were captured by the spectrophotometer
for the different chromaticities of light. By using
charge-coupled device (CCD) camera to capture the
image on the white paper are shown in Fig 4 (a-f).
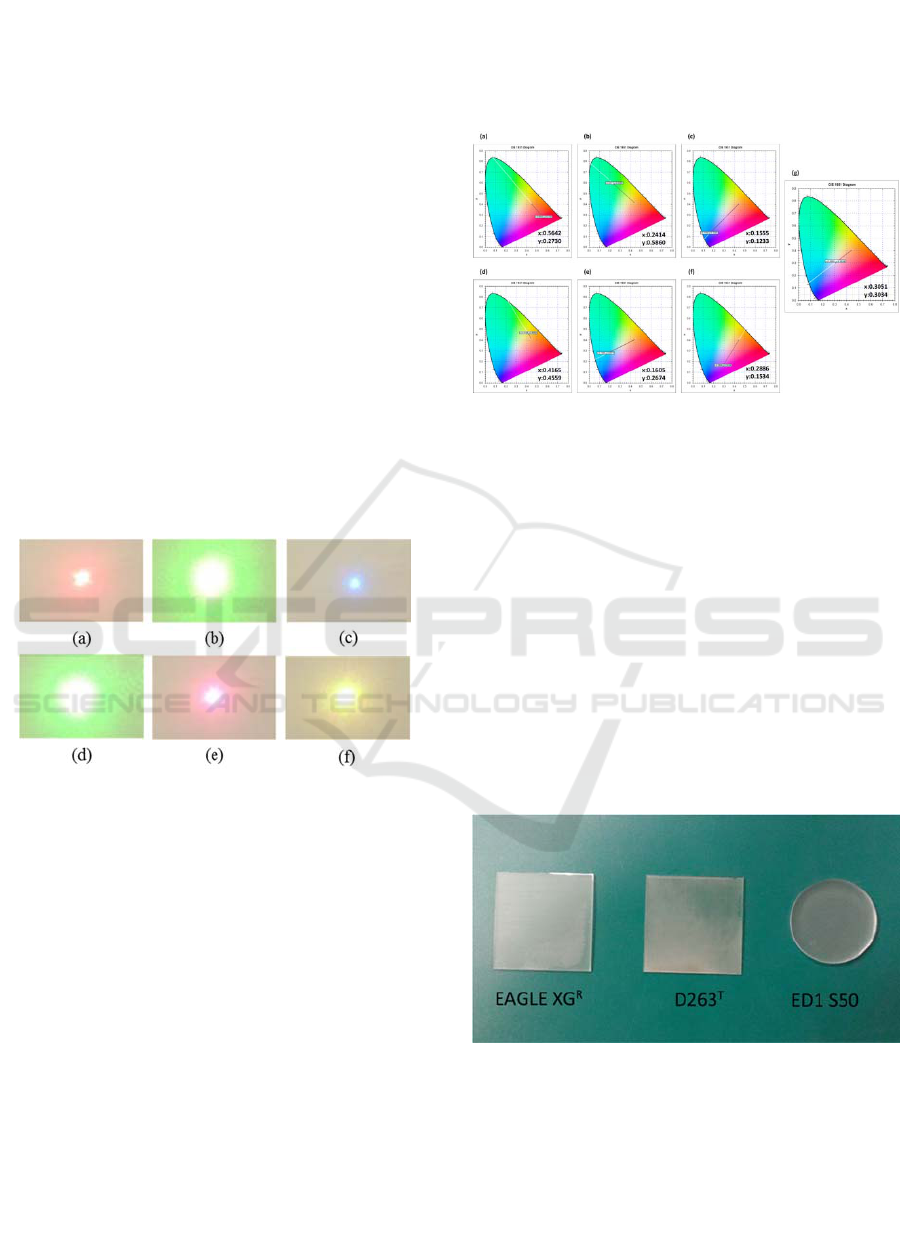
Figure 4: Projection light image on white paper without
any optical compensation components (a) R light, (b) G
light, (c) B light, (d) R/G mixed light, (e) G/B mixed light,
and (f) R/B light captured by CCD camera.
Figure 5 (a-c) shows the CIE 1931 diagram and its x
and y coordinate of single R, G, and B light without
optical compensation component, respectively. The
center point of green light was found to be more
saturated than the others, and therefore the
proportion of green light had to be decreased during
colour mixing. Figure 5 (d-f) shows the spectrum
and CIE 1931 diagram of the two color R/G, G/B,
and R/B color mixing. Figure 5 (d) shows the green
tone obtained when G and B are at full load and R is
off. Figure 5 (e) shows the red tone obtained when R
and B are at full load and G is off. Figure 5 (f)
shows the yellow tone obtained by when R and G
are at full load and B is off. However, because white
light cannot be obtained through two-color mixing,
the voltage of light sources must be adjusted for
color mixing. Figure 5 (g) shows the R/G/B mixed
light generated when the voltage of light sources is
R = 0.74 voltage, G = 0.49 voltage, and B = 2.19
voltage. The x and y coordinate was 0.3051 and
0.3034, respectively.
Figure 5: Results of the monochromatic light without any
optical compensation components (a) R light, (b) G light,
(c) B light, (d) R/G mixed light, (e) G/B mixed light, (f)
R/B light, and (g) R/G/B light captured by
spectrophotometer.
4.2 With Optical Component: RGB
Mixed Light Projection and CIE
Chromaticity Analysis
Figure 6 shows the three types (EAGLE XG
○,
R
,
D263T
TM
, BK7) fabricated optical components with
micro-structuring on surface fabricated by UV laser
milling. As same as the monochromatic light
measurement method, the optical component (with
microstructure) was assembled in the mixed light
module.
Figure 6: Images of the three type optical component with
micro-structure.
Table3 to Table 5 summarized the CIE 1931
diagram evaluation results and its x and y coordinate
of single R, G, and B light and mixed light of three
type components (i.e. Corning EAGLE XG
○,
R
glass,
D263T
TM
and BK7 optical compensation
component, respectively. Compared with the
PHOTOPTICS 2017 - 5th International Conference on Photonics, Optics and Laser Technology
172
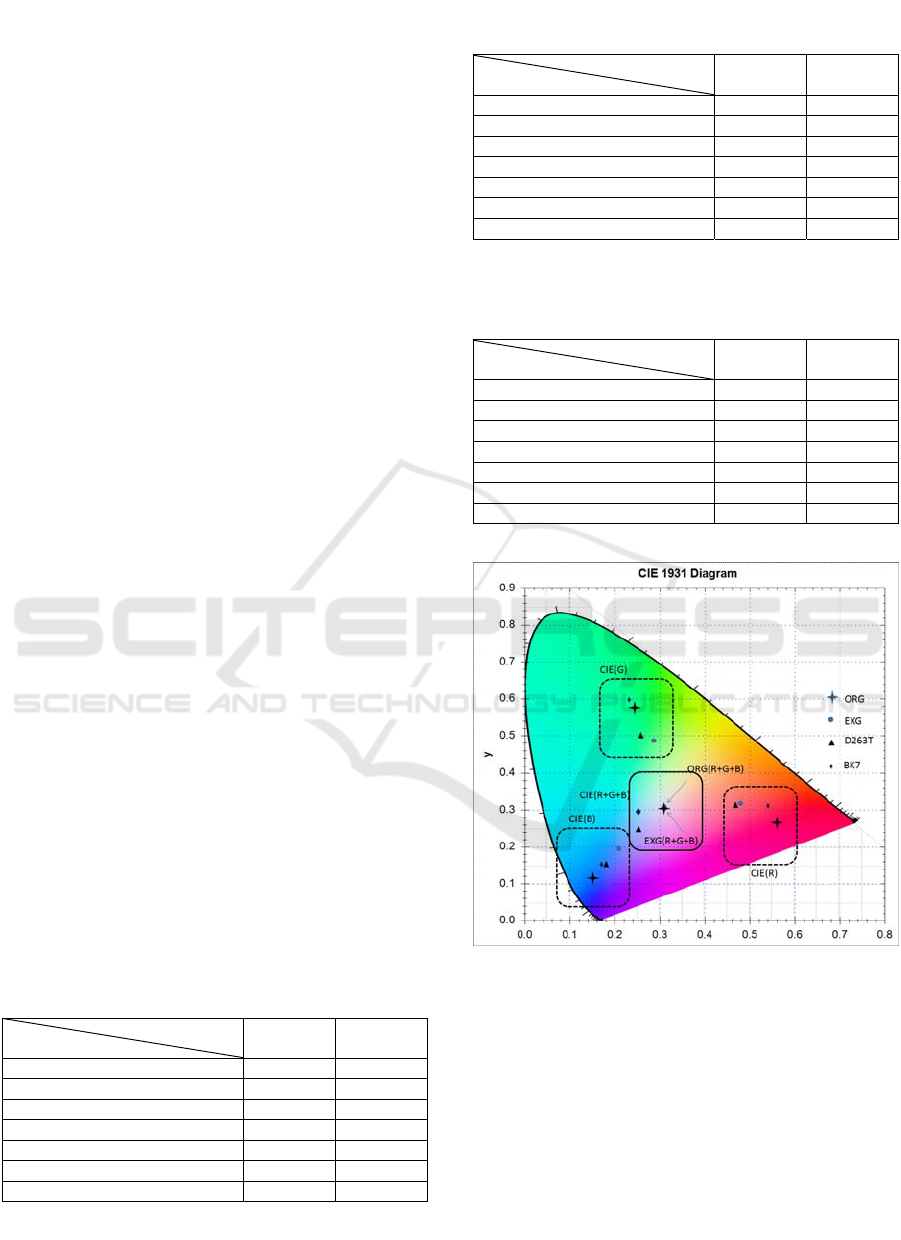
original single monochrome light source (R, G, and
B), by using three type optical components with
microstructure. The CIE 1931 diagram shows the
coordinate moved toward to the white light region
coordinate.
Compared with the two color (R/G) mixed light
source, by using three type optical components with
microstructure. The CIE 1931 diagram shows the
coordinate moved toward to the white light region
coordinate by using EAGLE XG
○,
R
glass and
D263T
TM
glass. By using the BK7 glass, the
coordinate was moved toward to yellow color
spectrum. Compared with the two color (G/B) mixed
light source, by using three type optical components
with microstructure. The CIE 1931 diagram shows
the coordinate moved toward to the white light
region coordinate by using EAGLE XG
○,
R
glass and
BK7 glass. By using the D263T
TM
glass, the
coordinate was moved toward to depth blue
coordinate. Compared with the two color (R/B)
mixed light source, by using three type optical
components with microstructure. The CIE 1931
diagram shows the coordinate moved toward to the
depth blue region coordinate by using D263T
TM
glass and BK7 glass. By using the EAGLE XG
○,
R
glass, the coordinate was moved toward to white
light region coordinate.
Compared with the three color (R/G/B) mixed
light source, by using three type optical components
with microstructure. The CIE 1931 diagram shows
the coordinate moved toward to white light region
coordinate by using EAGLE XG
○,
R
glass. By using
the D263T
TM
glass and BK7 glass, the coordinate
was moved toward to depth blue light region
coordinate. Figure 7 shows the CIE 1931 diagram of
the three type optical component with
microstructure. As the experimental results indicated
that the EAGLE XG
○,
R
glass have the best light
compensation consequent.
Table 3: Summaries the CIE 1931 diagram x and y
coordinate evaluation results using Corning EAGLE
XG
○,
R
glass.
Coordinate
Light source
X Y
R light 0.4794 0.3243
G light 0.2825 0.4891
B light 0.2149 0.1990
R,G mixed light 0.4073 0.4162
G,B mixed 0.2072 0.3021
R,B mixed 0.3364 0.2186
R,G,B mixed 0.3061 0.3034
(R: red, G: green, B: blue)
Table 4: Summaries the CIE 1931 diagram x and y
coordinate evaluation results using SCHOTT D263T
TM
.
Coordinate
Light source
X Y
R light 0.4663 0.3101
G light 0.2562 0.5068
B light 0.1796 0.1483
R,G mixed light 0.3782 0.4324
G,B mixed 0.1790 0.2492
R,B mixed 0.2591 0.1547
R,G,B mixed 0.2527 0.2462
(R: red, G: green, B: blue)
Table 5: Summaries the CIE 1931 diagram x and y
coordinate evaluation results using BK7.
Coordinate
Light source
X Y
R light 0.5434 0.3145
G light 0.2301 0.5988
B light 0.1692 0.1499
R,G mixed light 0.3903 0.4932
G,B mixed 0.1672 0.3006
R,B mixed 0.2885 0.1779
R,G,B mixed 0.2517 0.2900
(R: red, G: green, B: blue)
Figure 7: CIE 1931 diagram of with and without light-
compensation components.
5 CONCLUSIONS
This study used an ultraviolet laser system combined
with a high-speed galvanometric scanner unit to mill
optical glass substrates, creating optical
microstructures, and then analyse them with
software to simulate the area and size of uniform
light projections. By controlling the ratio of laser
Laser Micro-Structuring on Glass Substrates with Compensation Function for Multi-wavelength Mixed Laser Diode Module
173

light at three wavelengths and conducting CIE
analysis, similar white laser light can be modulated
over time. In the experimental results, the CIE 1931
diagram shows the coordinate moved toward to
white light region coordinate by using EAGLE
XG
○,
R
glass. By using the D263TTM glass and BK7
glass, the coordinate was moved toward to depth
blue light region coordinate. As the experimental
results indicated that the EAGLE XG
○,
R
glass has
the best light compensation consequent. This system
can modulate laser light according to user demand in
fields such as medicine, microelectronics, and
conventional lasers.
REFERENCES
Florea, C., Winick, K. A., 2003. Fabrication and
characterization of photonic devices directly written in
glass using femtosecond laser pulses. J. Lightwave
Technol., Vol. 21, pp. 246-253.
Zheng, H. Y., Zhou, W., Qian, H. X., Tan, T. T., Lim, G.
C., 2004. Polarisation-independence of femtosecond
laser machining of fused silica. Appl. Surf. Sci., Vol.
236, pp. 114-119.
Hee, C. W., Ngoi, B. K. A., Lim, L. E. N.,
Venkatakrishnan, K., Liang, W.L., 2005. Effect of
polarization on femtosecond pulsed laser ablation of
surface relief gratings using a novel interferometer.
Opt. Laser Technol., Vol. 37, pp. 93-98.
Florea, C., Sanghera, J. S., Aggarwal, I. D., 2008. Direct-
write gratings in chalcogenide bulk glasses and fibers
using a femtosecond laser. Opt. Mater., Vol. 30, pp.
1603-1606.
Cho, S. H., Chang, W. S., Kim, J. G., Kim, K. R., Hong,
J.W., 2008. Fabrication of internal diffraction gratings
in planar fluoride glass using low-density plasma
formation induced by a 26 femtosecond laser, Appl.
Surf. Sci., Vol. 255, pp. 2069-2074.
Ams, M., Marshall, G. D., Dekker, P., Dubov, M.,
Mezentsev, V.K., Bennion, I., Withford, M.J., 2008.
Investigation of ultrafast laser–photonic material
interactions: challenges for directly written glass
photonics. IEEE J. Sel. Top. Quant., Vol. 14, pp.
1370-1381.
Oliveira, V., Ausset, S., Vilar, R., 2009. Surface
micro/nanostructuring of titanium under stationary and
non-stationary femtosecond laser irradiation. Appl.
Surf. Sci., Vol. 255, pp. 7556-7560.
Hung, M. W., Chen, C. J., Chang, C. L., Hsu, C. W., 2011.
The impacts of high frequency pulse driving on the
performance of LED light", Phys. Procedia, Vol. 19,
pp. 336-343.
Billmeyer, F. W., Saltzman, J. M., 1981. Principles of
Color Technology, 2nd edition, John Wiley & Sons,
Inc., New York.
Zukauskas, A., Shur, M. S., Gaska, R., 2002. Introduction
to Solid State Lighting, John Wiley & Sons, Inc., New
York.
Hsiao, W. T., Yang, C. C., Huang, K. C., Chung, C. K.,
Tseng, S.F., Chiang, D., Chen, M. F., 2016. Optical
glass substrates forming processes using pulsed
ultraviolet laser micromilling technology, J. Laser
Micro. Nanoen., Vol. 11, pp. 30-34.
PHOTOPTICS 2017 - 5th International Conference on Photonics, Optics and Laser Technology
174
