
Search of Periodicity Regions in the Genome A.thaliana
Periodicity Regions in the A.thaliana Genomes
E. V. Korotkov
1
, F. E. Frenkel
1
and M. A. Korotkova
2
1
Institute of Bioengineering, Research Center of Biotechnology of the Russian Academy of Sciences,
Leninsky Ave. 33, bld. 2, 119071, Moscow, Russia
2
National Research Nuclear University “MEPhI”, Kashirskoe shosse, 31. Moscow 115409, Russia
Keywords: Sequence, Dynamic Programming, Repeat, Genome, Matrix.
Abstract: A mathematical method was developed in this study to determine tandem repeats in a DNA sequence. A
multiple alignment of periods was calculated by direct optimization of the position-weight matrix (PWM)
without using pairwise alignments or searching for similarity between periods. Random PWMs were used to
develop a new mathematical algorithm for periodicity search. The developed algorithm was applied to
analyze the DNA sequences of A.thaliana genome. 13997 regions having a periodicity with length of 2 to 50
bases were found. The average distance between regions with periodicity is ~9000 nucleotides. A
significant portion of the revealed regions have periods consisting of 2 nucleotide, 10-11 nucleotides and
periods in the vicinity of 30 nucleotides. No more than ~30% of the periods found were discovered early.
The sequences found were collected in a data bank from the website: http://victoria.biengi.ac.ru/cgi-
in/indelper/index.cgi. This study discussed the origin of periodicity with insertions and deletions.
1 INTRODUCTION
Periodicity is one of the structural regularities of
sequences and is widely represented in DNA
sequences (Korotkov et al. 2003). A periodicity is
considered as latent, if the similarity between any
two periods is not statistically significant or if it
belongs to the twilight zone (Durbin et al. 1998).
Perfect periodicity can become latent periodicity, if
it accumulates over 1.0 mutation per nucleotide in
the studied DNA sequence (Suvorova et al. 2014).
The distinctive property of latent periodicity is that it
cannot be detected by pairwise comparisons of
nucleotide sequences. However, latent periodicity
can be found if a mathematical method is applied to
directly detect the multiple alignment of nucleotide
sequences without constructing pairwise alignments.
The periods of a sequence with latent periodicity are
sequences for multiple alignment and this multiple
alignment may be the statistically significant without
the statistical importance of any pair alignment. The
aim of this study was to develop a mathematical
method which allows finding the periodicity of DNA
sequences as well as latent periodicity.
At present, there is a significant gap in the
mathematical approaches developed in search for
periodicities in symbolic and numeric sequences
(sequence-based methods). Spectral approaches
enable the finding of adequate "fuzzy" periodicity in
nucleotide sequences without the insertion(s) or
deletion(s) of nucleotides. Fourier transform,
Wavelet transform, information decomposition and
some other methods can be attributed to the number
of spectral methods (Lobzin & Chechetkin 2000;
Kravatskaya et al. 2011; Korotkov et al. 2003; Meng
et al. 2013; Afreixo et al. 2004; Kumar et al. 2006).
However, these approaches have a significant
limitation – they do not allow the detection of a
periodicity with insertions and deletions.
On the other hand, methods based on pairwise
alignment can accurately find insertions and
deletions (Benson 1999; Parisi et al. 2003).
However, these methods cannot detect a latent
periodicity, in a situation where the statistical
significance of similarity between any two periodic
sequences is small (Korotkov et al. 2003; Turutina et
al. 2006). This is due to the fact that the periodicity
of DNA sequences (with the number of periods
greater than or equal to 4) is detected by pairwise
similarity between periods. In the absence of
statistically significant pairwise similarity, these
approaches are incapable of finding latent
periodicity. First, it involves algorithms and
Korotkov E., Frenkel F. and Korotkova M.
Search of Periodicity Regions in the Genome A.thaliana - Periodicity Regions in the A.thaliana Genomes.
DOI: 10.5220/0006106001250132
In Proceedings of the 10th International Joint Conference on Biomedical Engineering Systems and Technologies (BIOSTEC 2017), pages 125-132
ISBN: 978-989-758-214-1
Copyright
c
2017 by SCITEPRESS – Science and Technology Publications, Lda. All rights reserved
125

programs, such as TRF (Benson 1999), Mreps
(Kolpakov et al. 2003), TRStalker (Pellegrini et al.
2010), ATRHunter (Wexler et al. 2005), T-REKS
(Jorda & Kajava 2009), IMEX (Mudunuri et al.
2010; Mudunuri & Nagarajaram 2007), CRISPRs
(Grissa et al. 2007), SWAN (Boeva et al. 2006) and
some others (Lim et al. 2013; Moniruzzaman et al.
2016), because the similarity between different
periods is very low in the case of latent periodicity.
It is true for algorithmic methods too (Domaniç &
Preparata 2007; Sokol & Tojeira 2014). This leads to
lack of seeds and identical short strings. Therefore,
this study proposes a mathematical method that
considers this gap and finds the latent periodicity of
any symbolic sequence in the presence of insertions
and deletions (in unknown positions of the analyzed
sequence) and in the absence of a known position-
weight matrix (PWM).
Any periodicity of the sequence S with length N
can be characterized by either the frequency matrix
(E. V. Korotkov et al. 2003) or created on its base,
the PWM M (Shelenkov et al. 2006). Each row of
the matrix is associated to a nucleotide and the signs
of the columns are the positions of the period. The
element of this matrix m(i,j) indicates the weight
m(i,j) which has the nucleotide i in position j of the
period. The positions of the period vary from 1 to n.
The sequence S
1
of length N, which is an artificial
periodic sequence 1,2,...,n,1,2,...,n,... is introduced.
Here, the numbers are treated as symbols and
columns in the matrix M are consistent with them.
For period equal to n, the sequence S corresponds to
a certain frequency matrix and PWM M(4,n). The
problem is formulated as follows: This study has a
sequence S with length N. It is necessary to find such
optimal PWM M
0
, where the local alignment
(Durbin et al. 1998) of sequences S
1
and S have the
greatest statistical significance. Under the statistical
significance, the probability P is that F
r
>mF
max
,
where mF
max
is the maximum weight of a local
alignment of sequences S and S
1
, using the optimal
matrix M
0
. Here, F
r
represents the maximum weight
of a local alignment randomly mixed sequence S and
sequence S
1,
using the optimal matrix M
r
. The search
is for matrix M
0
, which has the lowest probability P.
It is always possible to set the threshold level of the
probability P
0
and if the probability P(F
r
>mF
max
)
will be less than P
0,
then the local alignment found
of sequences S and S
1,
using the optimum matrix M
0
can be considered as statistically significant. It is
possible to use a local alignment algorithm for
alignment of the nucleotide sequence S and an
artificial periodic sequence S
1
, relative to the known
PWM (Smith & Waterman 1981). It is necessary to
find the optimal PWM M
0
by any means. Therefore,
the aim of this study was to develop a mathematical
approach for finding the matrix M
0
, as well as a
method for assessing the probability P. To determine
the optimal PWM, an optimization procedure was
used, as well as a local alignment algorithm in order
to account for insertions or deletions. To estimate
the probability P, the Monte Carlo method was used.
Instead of P
0
we used F
0
for which P(F
r
>F
0
)≤P
0
.
A mathematical method was developed in this
study to find more than 4 tandem repeats in the
DNA sequence. The multiple alignment of periods
was calculated by direct optimization of the PWM
without using pairwise alignments or a search for
similarity between periods. This means that for each
n, a matrix M
0
was found, the probability P was
estimated and the alignment of the sequences S and
S
1
was built using the M
0
matrix. It is not the goal of
this study to analyze all the known DNA sequences,
since the developed method requires large computer
resources. The developed algorithm was applied to
search for periodicity with insertions and deletions
in the A.thaliana genome. This study showed the
presence of periodicity with insertions and deletions
in the A.thaliana genome regions for which the
presence of periodicity was not previously known.
2 METHODS AND ALGORITHMS
In this study, a window which equals 630 base pairs
was used to search for periods in the chromosomes
of A.thaliana genome. This window moved with
step equal to 10 base pairs from the beginning to the
end of each chromosome of A.thaliana. The DNA
sequences in the window were denoted as S. To
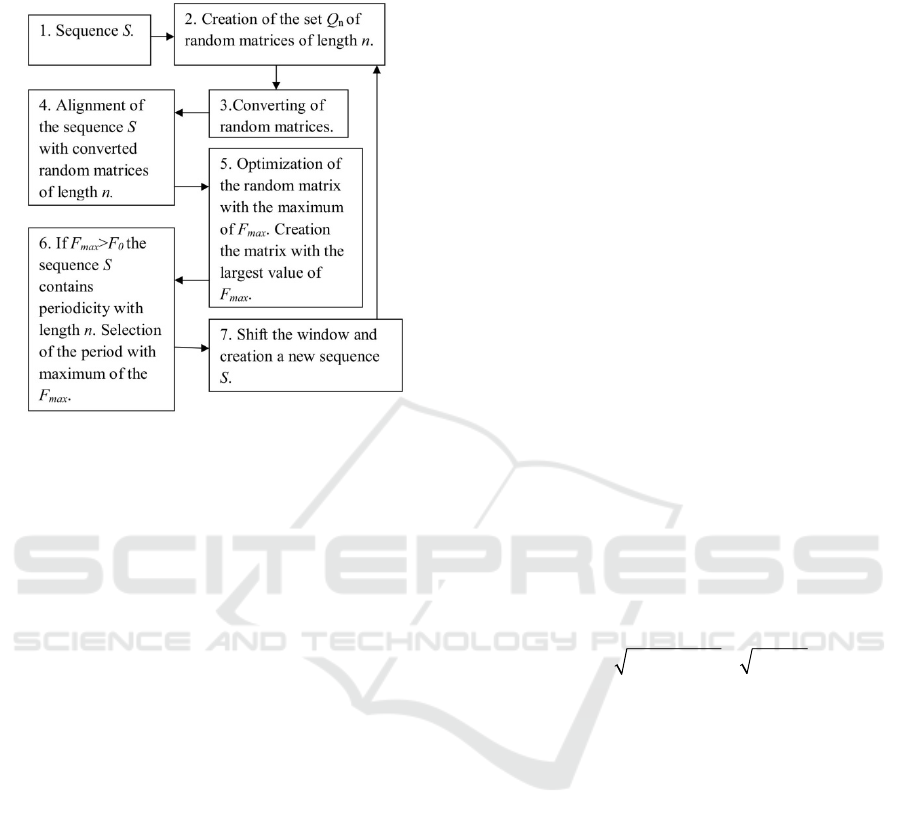
search for periodicity with insertions and deletions
in sequence S, the algorithm shown in Fig. 1 was
used. As seen from the algorithm, firstly, a set of
random matrices Q
n
(Fig. 1, step 2) of size 4xn was
generated, where n is the length of the period, and 4
is the alphabet size of the studied sequence. Then,
the matrices were optimized since the distribution of
the similarity function F
max
for each of the matrices
in the set of all random sequences (set Sr, paragraph
2.5) ought to be similar. Then, a local alignment of
the studied sequence S was built relative to each
optimized random matrix (Fig. 1, step 4). Local
alignment was used to determine the similarity
function F
max
for each optimized matrix. The
optimized matrix having the highest value of the
similarity function F
max
, with the studied sequence S,
was chosen. Thereafter, this matrix was optimized to
achieve the highest value of the similarity function
BIOINFORMATICS 2017 - 8th International Conference on Bioinformatics Models, Methods and Algorithms
126
F
max
(mF
max
) with the studied sequence S (Fig. 1,
step 5) and the optimized matrix was called M
0
.
Figure 1: The main stages of the algorithm used for
calculation mF
max
(n) for analyzed sequence S.
If mF
max
(n)
is more than the cutoff level F
0
then the
sequence S contains the region with periodicity
equal to n. In this study, periodicity in the interval
from 2 to 50 base pairs was evaluated. If several
periods have mF
max
(n)>F
0,
n which has the
maximum value of mF
max
(n) was selected (Fig. 1,
step 6). Selection of the level of F
0
is considered in
paragraph 2.6. Subsequently, the window was
moved for 10 base pairs along the A.thaliana
chromosome and the calculations were repeated
(Fig. 1, step 7). As a result of the algorithm, the
dependence of mF
max
on n was obtained for
sequence S with help of a local alignment. This
means that the boundaries of the regions with
mF
max
(n) may differ from the beginning and end of
the sequence S. It also means that the values of
mF
max
(n) for different n can be obtained for different
fragments of the studied sequence S. The boundaries
of the fragments, obtained for relevant values of
mF
max
(n) are shown. Subsequently, each step of the
algorithm shown in Fig. 1 was examined in more
detail.
2.1 Creation of a Set Q
n
of Random
Matrices with Length N
Random matrices Q
n
with dimension 4xn were used,
where n is the length of the period (Fig. 1, step 2).
Each matrix can be viewed as a point in space 4xn
and elements of a matrix are real random numbers.
A set of random matrices Q
n
was created when the
distance between them in the space 4xn was not less
than a certain value. To calculate the differences
between the two matrices m
1
(i,j)
and m
2
(i,j), the
information measure was used (Kullback 1997):
20
12 1 1
1
20
22
1
20
12 12
1
12 12
112 2
(, ) (,)ln((,))
(, )ln( (, ))
((,) (,))ln((,) (,))
(() ())ln(() ())
()ln( ()) ()ln( ())
j
i
i
i
IMM mij mij
mij mij
mijmij mijmij
sj sj sj s j
sj sj sj sj
(1)
where
20
1
() (,)
kk
i
s
jmij
. 2I
j
has an asymptotic chi-
square distribution with 3-th degrees of freedom
(Kullback 1997). Then we calculated:
12 12
1
(, ) (, )
n
j
j
IM M I M M
(2)
Hence,
12
2( , )
I
MM has an approximate
2
()df
,
and df equal to 3n since
11 2
(, )
I
MM ,
212
(, )
I
MM ,…,
11 2
(, )
n
I
MM
are independent and
12
(, )
n
I
MM is
completely determined by
11 2
(, )
I
MM ,
212
(, )
I
MM
,…,
11 2
(, )
n
I
MM
(Kullback 1997). Then the chi-
square distribution was approximated by means of
the normal distribution:
12 12
(, ) 4(, ) 2 1xM M IM M df
(3)
The value
12
(, )~(0,1)xM M N , где N(0,1) is the
standard normal distribution. N(0,1) is very useful as
a measure of the differences between matrices m
1
(i,j)
and m
2
(i,j). The probability p=P(x>x(M
1
,M
2
)) shows
that differences between the matrices m
1
(i,j) and
m
2
(i,j) are determined by random factors. If the
difference between the matrices m
1
(i,j)
and m
2
(i,j)
increases, then
12
(, )
x
MM becomes larger. The
difference between matrices L=
12
(, )
x
MM not less
than 1.0 was chosen.
Here, an algorithm was used to generate the
matrices. Each element of the matrix m(i,j), i=1,…,4,
j=1,…,n was randomly filled with equal probability
of either 0 or 1. The matrix was then compared with
all matrices that were already included in the set Q
n
.
If at least one matrix has a difference less than
L=1.0, than the generated matrix was not included in
the set Q
n
. If the difference was greater than L=1.0
for all matrices from the set Q
n
, then the matrix is
included in the set Q
n
. The 10
6
of such matrices were
created for each period length n.
Search of Periodicity Regions in the Genome A.thaliana - Periodicity Regions in the A.thaliana Genomes
127
2.2 Optimizing of Random Matrixes
For every matrix M from the set Q
n,
the values R and
K
d
were calculated as:
4
22
11
(, )
n
ij
Rmij
(4)
4
11
(, ) ()( )
n
d
ij
Kmijfitj
(5)
where f(i)=b(i)/N, b(i) is the number of nucleotides
of type i in the sequence S, t(j) is the probability
symbol "j" in the sequence S
1
. In this case, t(j)=1/n.
N is the total number of nucleotides in the sequence
S, N=630. To calculate the alignment, a optimized
matrix
'M
is needed. Calculations of
'M
was
described early in (Pugacheva, V., Korotkov, A. and
Korotkov 2016; Pugacheva V.M. et al. 2016).
2.3 Alignment of Nucleotide Sequence
with Optimized Random Matrices
A local alignment of sequences S
1
and S (Durbin et
al. 1998) was conducted using the PWM (Sinha
2006) and affine function penalty for insertions and
deletions to search for F
max
and the matrix M
0
(Durbin et al. 1998). To construct the alignment, the
matrices for similarity functions F, F
1
and F
2
were
filled for each matrix M from the set Q
n
. The matrix
M changed and turned into a optimized matrix M'.
The principles of this optimization are shown in
paragraph 2.2 and local alignment was described in
(Pugacheva, V., Korotkov, A. and Korotkov 2016;
Pugacheva V.M. et al. 2016).
2.4 Optimization of a Random Matrix
with the Largest Value of
Similarity Function
For all matrices from the set Q
n
, the modified matrix
max(m'), which had the highest value of the
similarity function F
max
was determined. Let call this
value as mF
max
. Thus, the alignment was calculated
and the coordinates of the alignment were
determined (Fig. 1, step 5). However, despite the use
of a very large number of matrices, the matrix
max(m') may have the value mF
max
, which is not the
largest for a sequence S and for length of period n.
This indicates that the largest value can be achieved
for matrix M
0
, which lies at some distance from the
matrix max(m'), that is less than the chosen threshold
L=1.0 (paragraph 2.1). Therefore, approximately 10
6
matrices were created, having distance L from the
matrix max(m') from 1.0-0.1*i to 0.9-0.1*i (for i=0).
These matrices were also used as indicated in
paragraph 2 and a new matrix max(m') was chosen
which had the highest value mF
max
. This procedure
was repeated for i from 1 to 9 and max(m') for i=9
was chosen as M
0
matrix.
2.5 Generation of Random Sequences
and Selection of F
0
A set Sr of random sequences was created by
random shuffling of the sequence S and the set Sr
containing 200 sequences. To generate one random
symbolic sequence, a random number sequence of
length N=630 was generated by the random number
generator. Then, a random number sequence was
arranged in ascending order, storing the generated
permutations. The produced permutations were used
to mix the sequence S, and as a result of this mixing,
the random symbolic sequence from the set Sr was
created.
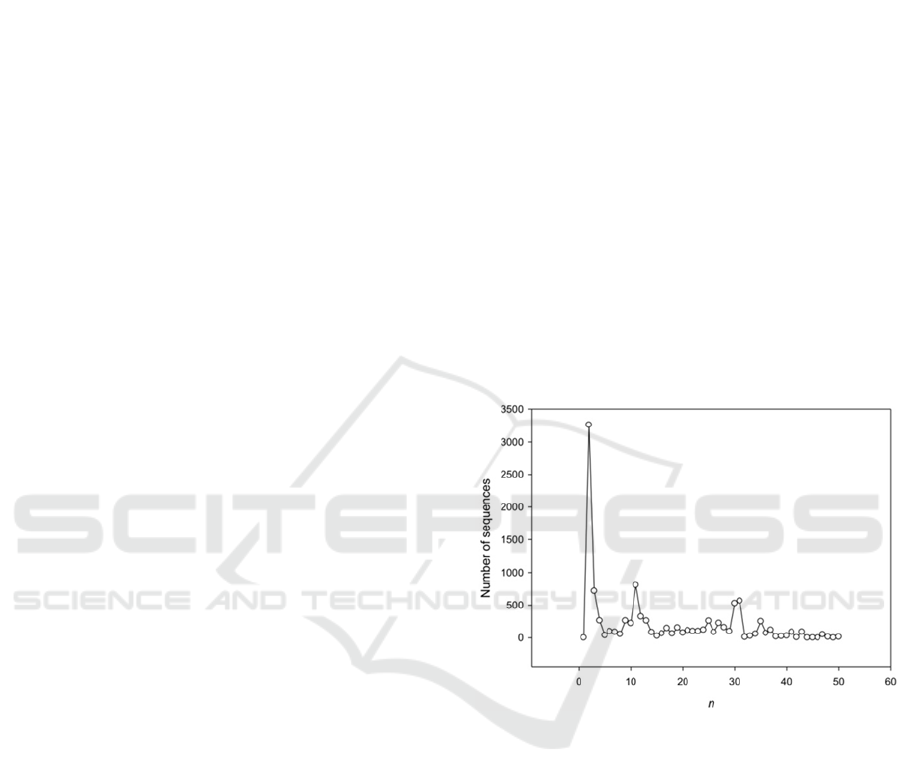
Figure 2: Length distribution of the periods found in
genome A.thaliana. Np is a number of periods, n is a
period length
.
In this study, threshold F
0
was determined as
follows: Firstly, the sequences of A.thaliana
chromosomes were obtained and mixed randomly as
carried out during the creation of set Sr. Thereafter,
using the algorithm illustrated in Fig. 1, we
determined the number of sequences Hr(F), which
have mF
max
(n)>F
for every n in the range of 2 to 50
bases. F runs from 200.0 to 500.0. The length of the
window, as in the case of the analysis of A.thaliana
chromosomes, was equal to 630 nucleotides.
Simultaneously, the number of sequences H(F),
which have mF
max
(n)>F for sequences of the
A.thaliana chromosomes was determined. After that,
F
0,
which has the ratio Hr(F
0
)/H(F
0
)≤0.05, was
BIOINFORMATICS 2017 - 8th International Conference on Bioinformatics Models, Methods and Algorithms
128

chosen. This choice of F
0
gives the number of false
positives (errors of the first kind) less than 5%. In
this study, F
0
=390.0 and it provides
Hr(F
0
)/H(F
0
)≤0.05, for analysis of the A.thaliana
genome.
This study did not analyze the period which had
3 nucleotides. This means that each window was
checked for the presence of a period which equals 3
nucleotides. To do this, the mutual information
between the sequence S and artificial periodic
sequence S
2
={123}
200
was calculated. Thereafter, the
matrix of the triplet periodicity was calculated and
with the help of this matrix, the correlation between
S and S
2
sequences was determined as shown
previously (Frenkel & Korotkov 2008). For the
measurement of correlation, the argument of normal
distribution X was selected. The higher value of X
corresponds to higher correlation between sequences
S и S
2
. It was identified that if X<3.0, it indicates the
absence of a period equal to 3 bases in the sequence
S and the search for periods was carried out using
this study's algorithm (Fig. 1). However, X≥3.0
indicated that the sequence S was not analyzed and
the window was shifted by 10 nucleotides.
3 RESULTS AND DISCUSSION
In general, 5 chromosomes with a total length some
more 116 million bases were analyzed in this study.
Sequences were obtained from the website
ftp://ftp.ncbi.nlm.nih.gov/genomes/archive/old_genb
ank/A_thaliana/OLD/. The calculations were
performed at the supercomputer cluster of the
Russian Academy of Sciences (http://
www.jscc.ru/eng/index.shtml). In A.thaliana
genome, 13997 regions having a periodicity with
length of 2 to 50 bases were found. On the average,
a periodicity of ~9000 nucleotides was found to be
associated with each region. The sequences found
were collected in a data bank from the website:
http://victoria.biengi.ac.ru/cgi-in/indelper/index.cgi.
It is interesting to consider the distribution of the
lengths of periods found in A.thaliana. This
distribution is shown in Fig. 2. From this figure, it is
obvious that the distribution is very nonuniform and
a significant portion of the revealed regions have
lengths of periods equal to 2, 11, 30 and 31
nucleotides. The small peak represents a period
equal to 35 bases. Fig. 2 also shows the absence of a
significant number of regions with period equal to 3
bases. This is due to the fact that DNA with period
equal to 3 bases was not analyzed because it related
with coding regions. In this study, some number of
regions with triplet periodicity were determined in a
situation in which the original X was less than 3.0,
and the period equal or multiple to 3 bases arose
after the creation of alignment with insertions or
deletions.
Also, the repeatability of regions with periods in
A.thaliana genome was studied using the Blast
program. To do this, there was a search for similarity
in the regions found with the A.thaliana genome
sequences having e-value equal to 10
-6
. It was found
that the 5287 regions represent a single copy, 2957
regions had a copy number which ranged from 2 to
5, and 8244 regions had more than 5 copies. We
observed maximum number of copies equal to 1585.
This shows that a significant part of the detected
sequences belongs to the dispersed repeats(Mehrotra
& Goyal 2014).
Figure 3: mF
max
(n) spectrum for fragment of the sequence
NC_003074.1 from chromosome 3 of the A.thaliana
genome. The coordinates of fragment are: 13905712-
13906329.
In this study, one region with period were
considered as examples. The region has a period
length equal to 4 nucleotides, and this period can be
detected only in the presence of deletions or
insertions. The spectrum of mF
max
(n) is shown in
Fig. 3. This region was found in the third
chromosome of the A.thaliana genome, in sequence
NC_003074.1. mF
max
(4)=660.52. This period was
not detected by TRF (Benson 1999), T-REKs (Jorda
& Kajava 2009) programs. These programs revealed
an insignificant periodicity equal to 13, 30 and 40
bases. TRF found 2.9 periods while T-REKs found 3
periods equal to 30 nucleotides. Mreps (Kolpakov et
al. 2003) found three periods equal to 5 bases In this
sequence, the program ATR hunter (Wexler et al.
2005) found 3 periods with length of 30 bases and 2
periods with length of 26 bases and completely did
not see a period equal to 4 bases. Program TRStalker
(Pellegrini et al. 2010) found 3 repeats with length
Search of Periodicity Regions in the Genome A.thaliana - Periodicity Regions in the A.thaliana Genomes
129

of 13 bases and 2.5 repeats with length 60 bases but
did not find 4 base repeats. The program Repfind
(Betley et al. 2002) found 10 dispersed perfect
repeats TCGG, 9 GATC and 11 GGAT. But these
repeats had a lower level of statistical significance.
The BWT program (Pokrzywa & Polanski 2010)
found no repeats in the sequence. According to this
study's estimates, mF
max
(4)=660.3, it corresponds to
P(mF
max
>660.3)<10
-30
, because the average value of
mF
max
for random sequences Sr is about 136.8 and σ
~ 54.2. The resulting alignment and the resulting
matrix M
0
can be received from
http://victoria.biengi.ac.ru/cgi-in/indelper/index.cgi.
A consensus period with length equal to 4
nucleotides is (T/C)CGA. This period was repeated
more than 140 times in the region found and the
period equal to 4 bases had the highest statistical
significance.
Figure 4: Influence of base changes on mF
max
(20) for
sequences 400 and 600 base pairs. X is the number of base
changes per 1 nucleotide. The period length equals to 10
b.p.
In this study, the influence of random base
substitutions on the mF
max
level was evaluated. To
do this, sequences with lengths 600 and 400
nucleotides long and period equal to 20 nucleotides
were used. Random positions were selected in these
sequences and random replacements of the
nucleotides were made on any of a, t, c, and g with
equal probability. Thereafter, mF
max
(20) was
calculated. The resulting function is shown in Fig. 4.
It can be seen that F
0
=390 is equal to approximately
1.6 and 1.0 random substitutions per nucleotide, for
sequences with lengths equal to 600 and 400
nucleotides, respectively. This result shows the
upper boundary of the accumulation of random
substitutions in the discovered regions and this
bound is 1.6 substitutions per nucleotide.
The results of this study were compared with
that of the T-REKs program. To this end, intervals
were introduced: 500-600, 900-1000, 1400-1500,
1900-2000, 2400-2500, 2900-3000. For these
intervals, all the sequences with periods found in this
study were chosen. For each sequence, the period
length n was found. Thereafter, the periods in these
sequences were searched by the program T-REKs.
T-REKs is one of the best tools for finding tandem
repeats in DNA sequences. It is believed that the T-
REKs program reveals the same period, if it detects
a period length which has a difference of no more
than ±1 base from our period. This interval was
chosen, due to the fact that we have developed a
method which may make insertions, deletions and
closed periods to have statistically important mF
max
.
It was also felt that the program T-REKs, finds the
same period, if the number of detectable periods is
not less than L/2n, where L is the length of the
sequence with period equal to n. As a result, the
proportion of regions detected by the program T-
REKs for different intervals was calculated. This
function is shown in Fig. 5. From this graph, it is
clear that before mF
max
=1500, the program T-REKs
can find less than 30% regions and only for
mF
max
>2200 did the program reveal more than 50%
of the regions.
There is a natural question about the biological
significance of the periods found. It applies
primarily to periods of 10 and 11 nucleotides long,
as well as to the nucleotides of multiple periods.
There are earlier suggestions that the periodicity
length of 10 and 11 nucleotides has a relationship
with the α-helices in proteins, as well as with the
processes of DNA compaction (Herzel et al. 1999;
Larsabal & Danchin 2005). In this study, sequences
without period equal to 3 bases were analyzed which
is specific for the protein-coding regions. This
means that most parts of the detected regions could
be linked with DNA compaction (Schieg & Herzel
2004; Kumar et al. 2006). Also, this study identified
regions with periods (with insertions and deletions)
which are impossible to detect by the methods of
searching for correlations in DNA (Herzel et al.
1999; Larsabal & Danchin 2005). It is very likely
that work regions with periods ranging from 9 to 11
bases and associated with the formation of
chromatin loops, are found in this study. If we take
into account that the number of these regions is
about 1,4x10
3
(Fig. 2) and we have analyzed about
1,16x10
8
bases, the average distance between these
regions (having periods in interval from 9 to11
nucleotides) is about 9x10
4
. This is consistent with
the size of 30 nm chromatin loops (Kadauke &
Blobel 2009). These regions could be "hot spots" for
chromosomal rearrangements also (Kantidze &
BIOINFORMATICS 2017 - 8th International Conference on Bioinformatics Models, Methods and Algorithms
130

Razin 2009). At the same time, regions were found
with periods which could be micro- and minisatellite
sequences (Richard et al. 2008). In this case, classic
micro and mini minisatellites were identified with
insertions and deletions of nucleotides which have
mF
max
>2000. According to Fig. 4, in this case the
number of substitutions is not more than 50% per
nucleotide. When mF
max
<2000, ancient copies of
micro- and minisatellite sequences were discovered
that have accumulated a considerable number of
nucleotide substitutions, insertions and deletions of
nucleotides.
Figure 5: Comparison of developed algorithm with the
program T-REKs (Jorda & Kajava 2009). ID shows the
part of periodicities regions which can find the T-REKs.
We can assume that the results are the same if the T-REKs
detects at least 50% of the number of periods and the
period length differs not by more than one base.
It is also interesting to estimate the part of the
A.thaliana genome which has period regions. The
average length of the region which was found with
the periods is 400 bases and the number of regions
found is 13997. This corresponds to a total length
equal to about 6,6x10
6
nucleotides, which is ~5% of
the total length of the A.thaliana genome.
There are the limits of applicability of the
method developed in this study. As was noted earlier
(paragraph 2.2.1), an average value,
l
=150, was
chosen using the random sequences. This means that
micro and mini satellite sequences less than this
length are detected as not very good by this method.
The fact is that these lengths can not overcome the
threshold F
0
= 390.0;thus, these sequences can be
missed by this study's method. This means that even
perfect micro- and minisatellites may be skipped, if
they have a length equal to or less than 150
nucleotides. On the basis of this limitation, a
comparison can be made between the earlier work
on the search for micro and minisatellite and the
results of this study. Previously, micro- and
minisatellite sequences from A.thaliana genome
were investigated (Richard et al., 2008; Tóth et al.,
2000) and mathematical methods for finding the
micro and mini satellites sequences shown in
Moniruzzaman et al. (2016.).
Above, the approach of this study was compared
with the main methods used, when searching for
micro and minisatellite sequences (Moniruzzaman et
al. 2016). The programs used included TRF (Benson
1999), T-REKs (Jorda & Kajava 2009), Mreps
(Kolpakov et al. 2003), BWTRs (Pokrzywa and
Polanski, 2010), ATR hunter (Wexler et al. 2005),
Repfind (Betley et al. 2002). Therefore, it can be
assumed that the developed approach misses perfect
micro and minisatellite sequences which have a
length of less than 100 bases. However, the method
used in this study was able to find a highly diverged
periodic region which have a considerable length
(200 or more bases) and which passed by previously
developed approaches. This study's method is
suitable when it comes to searching for highly
divergent tandem repeats, having a total length of
more than 200 nucleotides.
This work was supported by the Russian Science
Foundation.
REFERENCES
Afreixo, V., Ferreira, P.J.S.G. & Santos, D., 2004. Fourier
analysis of symbolic data: A brief review. Digital
Signal Processing, 14(6), pp.523–530.
Benson, G., 1999. Tandem repeats finder: a program to
analyze DNA sequences. Nucleic acids research,
27(2), pp.573–580.
Betley, J.N. et al., 2002. A ubiquitous and conserved
signal for RNA localization in chordates. Current
biology : CB, 12(20), pp.1756–61.
Boeva, V. et al., 2006. Short fuzzy tandem repeats in
genomic sequences, identification, and possible role in
regulation of gene expression. Bioinformatics (Oxford,
England), 22(6), pp.676–84.
Domaniç, N.O. & Preparata, F.P., 2007. A novel approach
to the detection of genomic approximate tandem
repeats in the Levenshtein metric. Journal of
computational biology a journal of computational
molecular cell biology, 14(7), pp.873–891.
Durbin, R. et al., 1998. Biological Sequence Analysis:
Probabilistic Models of Proteins and Nucleic Acids,
Cambridge University Press.
Frenkel, F.E. & Korotkov, E. V, 2008. Classification
analysis of triplet periodicity in protein-coding regions
of genes. Gene, 421(1-2), pp.52–60.
Grissa, I., Vergnaud, G. & Pourcel, C., 2007.
CRISPRFinder: a web tool to identify clustered
regularly interspaced short palindromic repeats.
Search of Periodicity Regions in the Genome A.thaliana - Periodicity Regions in the A.thaliana Genomes
131

Nucleic acids research, 35(Web Server issue),
pp.W52–7.
Herzel, H., Weiss, O. & Trifonov, E.N., 1999. 10-11 bp
periodicities in complete genomes reflect protein
structure and DNA folding. Bioinformatics, 15(3),
pp.187–193.
Jorda, J. & Kajava, A. V, 2009. T-REKS: identification of
Tandem REpeats in sequences with a K-meanS based
algorithm. Bioinformatics (Oxford, England), 25(20),
pp.2632–8.
Kadauke, S. & Blobel, G.A., 2009. Chromatin loops in
gene regulation. Biochimica et biophysica acta,
1789(1), pp.17–25.
Kantidze, O.L. & Razin, S. V, 2009. Chromatin loops,
illegitimate recombination, and genome evolution.
BioEssays: news and reviews in molecular, cellular
and developmental biology, 31(3), pp.278–86.
Kolpakov, R., Bana, G. & Kucherov, G., 2003. mreps:
Efficient and flexible detection of tandem repeats in
DNA. Nucleic acids research, 31(13), pp.3672–8.
Korotkov, E.V., Korotkova, M.A. & Kudryashov, N.A.,
2003. The informational concept of searching for
periodicity in symbol sequences. Molekuliarnaia
Biologiia, 37(3), pp.436–451.
Korotkov, Korotkova & Kudryashov, 2003. Information
decomposition method to analyze symbolical
sequences. Physics Letters, Section A: General,
Atomic and Solid State Physics, 312(3-4), pp.198–210.
Kravatskaya, G.I. et al., 2011. Coexistence of different
base periodicities in prokaryotic genomes as related to
DNA curvature, supercoiling, and transcription.
Genomics, 98(3), pp.223–231.
Kullback, S., 1997. Information Theory and Statistics S.
Kullback, ed., New York: Dover publications.
Kumar, L., Futschik, M. & Herzel, H., 2006. DNA motifs
and sequence periodicities. In silico biology, 6(1-2),
pp.71–8.
Larsabal, E. & Danchin, A., 2005. Genomes are covered
with ubiquitous 11 bp periodic patterns, the “class A
flexible patterns”. BMC bioinformatics, 6, p.206.
Lim, K.G. et al., 2013. Review of tandem repeat search
tools: a systematic approach to evaluating algorithmic
performance. Briefings in bioinformatics, 14(1),
pp.67–81.
Lobzin, V. V. & Chechetkin, V.R., 2000. Order and
correlations in genomic DNA sequences. The spectral
approach. Uspekhi Fizicheskih Nauk, 170(1), p.57.
Mehrotra, S. & Goyal, V., 2014. Repetitive sequences in
plant nuclear DNA: types, distribution, evolution and
function. Genomics, proteomics & bioinformatics,
12(4), pp.164–71.
Meng, T. et al., 2013. Wavelet analysis in current cancer
genome research: a survey. IEEE/ACM transactions
on computational biology and bioinformatics / IEEE,
ACM, 10(6), pp.1442–59.
Moniruzzaman, M. et al., 2016. Development of
Microsatellites: A Powerful Genetic Marker. The
Agriculturists, 13(1), p.152.
Mudunuri, S.B. et al., 2010. G-IMEx: A comprehensive
software tool for detection of microsatellites from
genome sequences. Bioinformation, 5(5), pp.221–3.
Mudunuri, S.B. & Nagarajaram, H.A., 2007. IMEx:
Imperfect Microsatellite Extractor. Bioinformatics
(Oxford, England), 23(10), pp.1181–7.
Parisi, V., De Fonzo, V. & Aluffi-Pentini, F., 2003.
STRING: Finding tandem repeats in DNA sequences.
Bioinformatics, 19(14), pp.1733–1738.
Pellegrini, M., Renda, M.E. & Vecchio, A., 2010.
TRStalker: an efficient heuristic for finding fuzzy
tandem repeats. Bioinformatics (Oxford, England),
26(12), pp.i358–66.
Pokrzywa, R. & Polanski, A., 2010. BWtrs: A tool for
searching for tandem repeats in DNA sequences based
on the Burrows-Wheeler transform. Genomics, 96(5),
pp.316–21.
Pugacheva V.M., Korotkov A.E & Korotkov E.V., 2016.
Search of latent periodicity in amino acid sequences
by means of genetic algorithm and dynamic
programming. Statistical application in genetics and
molecular biology, 15(4).
Pugacheva, V., Korotkov, A. and Korotkov, E., 2016.
Search for Latent Periodicity in Amino Acid
Sequences with Insertions and Deletions. In
Proceedings of the 9th International Joint Conference
on Biomedical Engineering Systems and Technologies
(BIOSTEC 2016). SCITEPRESS – Science and
Technology Publications, Lda., pp. 117–127.
Richard, G.-F., Kerrest, A. & Dujon, B., 2008.
Comparative genomics and molecular dynamics of
DNA repeats in eukaryotes. Microbiology and
molecular biology reviews: MMBR, 72(4), pp.686–
727.
Schieg, P. & Herzel, H., 2004. Periodicities of 10-11bp as
indicators of the supercoiled state of genomic DNA.
Journal of molecular biology, 343(4), pp.891–901.
Shelenkov, A., Skryabin, K. & Korotkov, E., 2006. Search
and classification of potential minisatellite sequences
from bacterial genomes. DNA research: an
international journal for rapid publication of reports
on genes and genomes, 13(3), pp.89–102.
Sinha, S., 2006. On counting position weight matrix
matches in a sequence, with application to
discriminative motif finding. In Bioinformatics.
Smith, T.F. & Waterman, M.S., 1981. Identification of
common molecular subsequences. Journal of
Molecular Biology, 147, pp.195–197.
Sokol, D. & Tojeira, J., 2014. Speeding up the detection of
tandem repeats over the edit distance. Theoretical
Computer Science, 525, pp.103–110.
Suvorova, Y.M., Korotkova, M.A. & Korotkov, E. V,
2014. Comparative analysis of periodicity search
methods in DNA sequences. Computational biology
and chemistry, 53 Pt A, pp.43–48.
Turutina, V.P. et al., 2006. Identification of Amino Acid
Latent Periodicity within 94 Protein Families. Journal
of Computational Biology, 13(4), pp.946–964.
Wexler, Y. et al., 2005. Finding approximate tandem
repeats in genomic sequences. Journal of
computational biology: a journal of computational
molecular cell biology, 12(7), pp.928–42.
BIOINFORMATICS 2017 - 8th International Conference on Bioinformatics Models, Methods and Algorithms
132
