
Characterization of Tor Traffic using Time based Features
Arash Habibi Lashkari, Gerard Draper Gil, Mohammad Saiful Islam Mamun and Ali A. Ghorbani
Canadian Institute for Cybersecurity (CIC), University of New Brunswick (UNB), Fredericton, Canada
{a.habibi.l, gerard.draper, msi.mamun, ghorbani}@unb.ca
Keywords:
Tor, Network Traffic Characterization, Network Traffic Analysis, Time-based Features, Machine Learning.
Abstract:
Traffic classification has been the topic of many research efforts, but the quick evolution of Internet services
and the pervasive use of encryption makes it an open challenge. Encryption is essential in protecting the
privacy of Internet users, a key technology used in the different privacy enhancing tools that have appeared in
the recent years. Tor is one of the most popular of them, it decouples the sender from the receiver by encrypting
the traffic between them, and routing it through a distributed network of servers. In this paper, we present a
time analysis on Tor traffic flows, captured between the client and the entry node. We define two scenarios,
one to detect Tor traffic flows and the other to detect the application type: Browsing, Chat, Streaming, Mail,
Voip, P2P or File Transfer. In addition, with this paper we publish the Tor labelled dataset we generated and
used to test our classifiers.
1 INTRODUCTION
Traffic classification technologies have experienced
great advances over the last decade due to its applica-
tion in systems like Quality of Service (QoS)s mech-
anisms or SIEM (Security Information and Event
Management) tools. The industry as well as the re-
search community have dedicated many efforts to the
study of these technologies, developing several clas-
sification techniques (Nguyen and Armitage, 2008;
Callado et al., 2009). However, the continuous growth
of Internet and its offer of services, along with the
latest trend to encrypt and/or disguise these services,
makes traffic classification a great challenge for the
Internet research community (Dainotti et al., 2012).
One of the obstacles to traffic classification is en-
cryption, a key technology to protect Internet users’
freedom and privacy, providing them with anonymity
and the means to protect themselves against network
surveillance systems.
Tor (Dingledine et al., 2004) is currently the most
popular privacy enhancing tool. It can anonymize
the identity of users as well as their Internet activ-
ity by encrypting and tunneling the traffic through a
distributed network of servers, known as Tor nodes.
In this paper we focus on the characterization of
Tor traffic, that is, downgrading privacy to some ex-
tent by exposing the activity within the Tor traffic.
Given a traffic flow, we aim to detect whether it is
Tor traffic or not. Moreover, once we identify it as
Tor, we also want to know what kind of application
is running within the Tor flow: browsing?, chat?, file
transfer?, etc. Our experiment relies on the assump-
tion that different types of traffic have different time
constrains, allowing us to characterize the traffic be-
ing routed through a Tor node. A clear example may
be the time constraints of real time voice applications
(VoIP), where we require a minimum bandwidth, but
at the same time we have a maximum, i.e. we will not
be able to transmit more bytes than we generate. In
comparison, Audio Streaming applications will also
have a minimum bandwidth, but the maximum will
be determined by the server and network capacity.
We believe that these differences should reflect on the
time statistics, therefore we could use them to identify
different traffic applications.
The novelty of our work is an approach chosen to
analyze the traffic flows, we focus on time-related fea-
tures only. In the literature we can find many papers
using features extracted from flows, but none of them
have focused exclusively on time based features. The
authors in (Quinlan, 1993) use the size of the first n
packets to detect Tor traffic. Authors in (Juarez et al.,
2014; Bai et al., 2008) use a combination of time fea-
tures and other packet based features like size, ports,
flags, etc. Moreover, they focus on particular appli-
cations like Skype and SSH. Our main objective is
to classify traffic into different types, where one type
of traffic will include different applications, e.g. we
captured Voip traffic from Hangouts, Facebook and
Skype.
Our Contribution: Our contribution in this pa-
Lashkari, A., Gil, G., Mamun, M. and Ghorbani, A.
Characterization of Tor Traffic using Time based Features.
DOI: 10.5220/0006105602530262
In Proceedings of the 3rd International Conference on Information Systems Security and Privacy (ICISSP 2017), pages 253-262
ISBN: 978-989-758-209-7
Copyright
c
2017 by SCITEPRESS – Science and Technology Publications, Lda. All rights reserved
253

per is twofold. First, we propose a set of time-based
features to identify and characterize Tor traffic, and
we prove that using time-based features only we can
identify and characterize Tor traffic to some extent.
Second, we study the impact of the length of the flows
in the efficiency of the traffic classification, according
to our experiments, 15s is the optimal length. In addi-
tion, we publish a labelled dataset of Tor traffic along
with the tool we used to generate it. The dataset con-
tains 8 different labels, corresponding to the 8 differ-
ent types of traffic captured: browsing, audio stream-
ing, chat, video streaming, mail, VoIP, P2P and file
transfer. We choose only time-related features to ex-
pedite the efficiency and to ensure an encryption in-
dependent traffic classifier.
2 RELATED WORK
Tor has been the subjective of many research
papers, focusing many of them on compromis-
ing Tor’s anonymity or improving its performance
(Chakravarty et al., 2014; AlSabah et al., 2012). An-
other topic of interest related with the Tor network,
and closer to the problem we address, is the analysis
of the Tor traffic (Bai et al., 2008; Chaabane et al.,
2010; Ling et al., 2014; AlSabah et al., 2012), but in
almost all of cases the analysis is performed within
a Tor node. In fact, we haven only found one paper
that addresses the problem of characterizing Tor traf-
fic observing the network traffic between the client
and the entry node (He et al., 2014). In the following
paragraphs, we review some of these works.
In (Juarez et al., 2014), the authors exploit the
user’s browsing behaviour, along with location data
and the version of the browser to execute a website
fingerprinting attack. The main objective of the pa-
per differs from ours, while they try to identify the
different websites a user is browsing, we aim at iden-
tifying the traffic category, which in this case would
be browsing. Moreover, they conclude with around
37% false positives.
In (Chakravarty et al., 2014) Chakravarty et al.
present an attack against the Tor network, with the
objective of revealing the identity (IP address) of the
clients. The paper proposes an active traffic analy-
sis attack based on deliberately perturbing the char-
acteristics of user traffic at the server side (collud-
ing server), and observing a similar perturbation at
the client side through statistical correlation. Their
method achieves an accuracy of 100% in in-lab tests,
and more than 81% in real-world experiments.
AlSabah et al. (AlSabah et al., 2012) propose a
QoS mechanism to improve the performance of the
Tor network, distinguishing between Bulk Transfer
(e.g. Bittorrent), Interactive (e.g. web traffic) and
Streaming traffic. As classifiers they use Tor Circuit
Lifetime, Data Transferred, Cell inter-arrival times
and Number of Cells sent recently. They test dif-
ferent algorithms (Nai
¨
ve Bayes, Bayesian Networks,
and Decision Trees) on an artificial dataset (Bayesian
Networks, 3 classes, over 90% accuracy) , and in a
live experiment (Nai
¨
ve Bayes, Bulk and Interactive
classes, 77% accuracy).
In (Bai et al., 2008) Bai et al. propose a finger-
printing method to identify Tor and Web-Mix net-
works. Their method uses specific strings, packet
length and frequency of the packets. They test their
method on simulated networks obtaining more than
95% of accuracy in both systems (Tor and Web-Mix).
In (Chaabane et al., 2010) Chaabane et al. use
Deep Packet Inspection (OpenDPI) to analyze the
traffic from a group of 6 exit nodes deployed for
that purpose. Their results show that more than 50%
of the traffic belongs to Bittorrent applications. Al-
though OpenDPI is not able to identify encrypted con-
nections, around 30% of the total traffic, the authors
claim that these connections also belong to P2P, after
analyzing the usage of encryption in Bitorrent con-
nections.
In (Ling et al., 2014) the authors present an analy-
sis of Tor traffic using an Intrusion Detection System
(IDS). The papers presents the results on an analysis
done using Suricata, and a commercial IDS rule-set
(ETPro). According to their results, 10% of the Tor
traffic is malicious, i.e. it triggers an alert. From that
10%, more than 70% of the alerts where triggered by
P2P traffic.
In (He et al., 2014) the authors propose a method
based on HMM (Hidden Markov Models) to clas-
sify encrypted Tor traffic in 4 categories: P2P, FTP,
IM and Web (anything else is unknown). As classi-
fiers (features) they use burst volumes and directions,
extracted from Tor flows. They use HMM to build
ingress and egress models of the different application
types (P2P, FTP, IM and Web). They obtain a maxi-
mum overall accuracy value of 92%.
Authors in (Serjantov and Sewell, 2003) discussed
about the anonymity in connection-oriented system
by outlining the attack scenarios against anonymous
web browsing. By running web clients with a small
additional latency (without adding dummy traffic
to minimize bandwidth requirement), they design a
threat model for a passive attacker to identify the
browsing activities of the user. They measure the
number of simultaneous connections per second to be
initiated in order to provide anonymity. It appears
that 100 users with 2-4 network links provide 92%
ICISSP 2017 - 3rd International Conference on Information Systems Security and Privacy
254

compromised connections (poor anonymity) whereas
a scenario with 20 users with 200 connections ends
up with only 2.5% compromised connection, that
is, probability of a very high anonymous system.
Nonetheless, they did not consider any active attacks
related to connection-based anonymity systems, spe-
cially attacks related to tracing source and destination
of an established connection (that was solved later in
(Shmatikov and Wang, 2006)).
In (Mittal et al., 2011), Mittal et al. combine
information extracted from the forwarding capacity
between intermediate relay Tor nodes to link con-
nections from the same initiator with 98.5% accu-
racy. Circuits sharing the same bottleneck relay yield
highly correlated throughput. Applying attacks on
the live Tor network they revealed the identities of
the guard relays. However, authors use their self-
generated circuit to avoid non-participating clients.
All the experiments were done within only 25 Tor re-
lays and regarding the guard relay they consider only
burst sized data. This throws a big question about the
scalability of the attack.
Low latency mix networks are vulnerable to traffic
analysis due to inherent statistical characteristics of
packet data stream and stringent latency requirement
incurred by interactive applications. Note that even if
the established communication channel and payloads
are encrypted and padded to hide payload size, In-
ter packet arrival time (time differences between con-
secutive packets) cannot be concealed because of the
low latency requirement of the application. One of
the papers that focus on the same area of timing anal-
ysis is (Shmatikov and Wang, 2006)- where the au-
thors find a correlation of inter-packet arrival time
and packet flows in order to identify network traf-
fic in mix-networks. By modifying packet flows they
were able to fingerprint origin (e.g. browser) and des-
tination (e.g. destination) of IP traffic. To get rid of
this privacy attack, authors propose adaptive padding
algorithm- where an expected inter-packet interval
(EIPI) is randomly chosen in order to destroy natural
fingerprints. As the experiment shows- the correlation
coefficient between two links of the same path based
on Inter-packet intervals lies to 0.9 while 0.3 for un-
related links. Introducing adaptive padding reduces
correlation within the same flow to 0.2-0.4.
The very first attack on Tor network anonymity
was proposed by Aaron et al. in (Johnson et al.,
2013), where authors show that typical Tor users are
more vulnerable to compromise than expected in the
prior works. They present a security model of a realis-
tic Tor path simulator that includes users, adversaries,
Tor network relays, group of Internet exchange points
and Autonomous Systems (AS). Their results show
that anonymity of the users can be broken 80% (of all
users) by a Tor-relay adversary within 6 months and
completely by a single AS adversary within 3 months.
However, unlike (Johnson et al., 2013; Shmatikov and
Wang, 2006), we do not consider any attack models,
circuit clogging, or network adversaries, that is be-
yond the goal of this paper. Instead, we focus on in-
depth correlation between network-bound traffic flow
interval and the characteristic of Internet applications.
2.1 Comparing with Related Work
Based on our study, the papers closer to our work
were done by AlSabah et al. (AlSabah et al., 2012),
Bai et al. (Bai et al., 2008), and Luoet al. (He et al.,
2014). Figure 1 shows a comparison between these
papers and our proposed method at a glance. The first
paper (AlSabah et al., 2012) is based on the onion
routers to extract cells information such as circuit life-
time, cell inter-arrival times and the number of cells
sent recently from the network packet but since one
packet may contain many cells, so it is not possible
to extract cell information from network traffic. The
second research paper (Bai et al., 2008) is focused on
the detection of Tor and Web-Mix networks. They did
not extend their work to characterization based on the
type of application. The third paper (He et al., 2014),
the closest one to our proposal, is focused on the iden-
tification of only four protocols: P2P, FTP, IM and
Web which we distinguish between 8 different types.
Moreover, to test their proposal they set up a private
Tor network, whereas we used traffic captured from
the public Tor network.
3 DATASET GENERATION
One of the contributions of this paper is the labelled
Tor traffic dataset that we used in our experiments. To
generate a representative dataset of real-world traffic
we defined a set of tasks, assuring that our dataset is
rich enough in diversity and quantity. We created ac-
counts for users Alice and Bob in order to use ser-
vices like Skype, Facebook, etc. The dataset contains
8 types of traffic (browsing, chat, audio-streaming,
video-streaming, mail, VOIP, P2P and File Transfer)
from more than 18 representative applications (e.g.,
facebook, skype, spotify, gmail etc.).
Figure 2 shows the configuration we have used
to generate the dataset. We have used Whonix
(https://www.whonix.org), a ready-to-use Linux OS
configured to route all traffic through the Tor network.
The Whonix distribution is composed of two virtual
machines, the gateway and the workstation. As we
Characterization of Tor Traffic using Time based Features
255
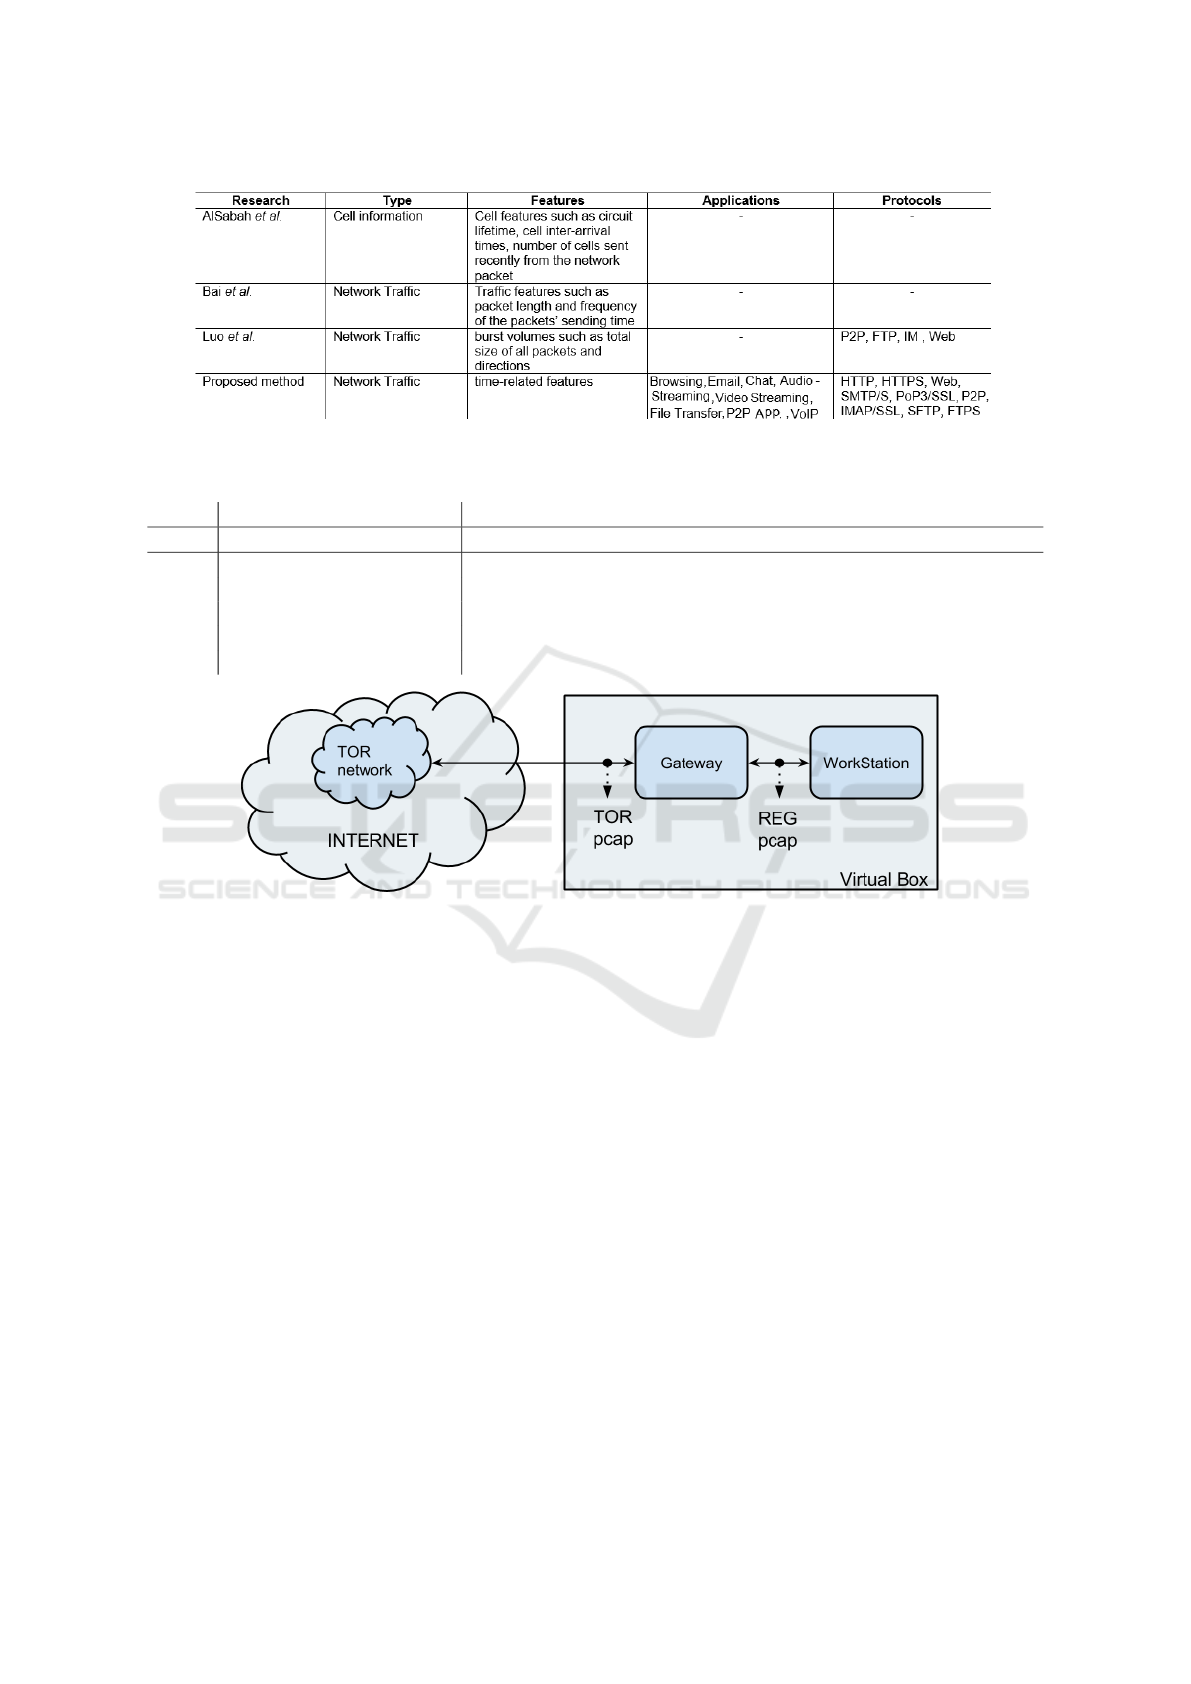
Figure 1: Comparison of related works.
Table 1: Contents of the Datasets (number of samples).
Scenario A Scenario B
TOR NOTOR Total Bro Ema Chat Aud Vid FT VoIP P2P Total
10s. 8044 59790 67834 1604 282 323 721 874 864 2291 1085 8044
15s. 5631 48123 53754 1194 194 249 510 617 590 1544 733 5631
30s. 3130 43892 47022 694 111 153 332 364 311 790 375 3130
60s. 1723 41376 43099 411 60 90 190 196 165 413 198 1723
120s. 969 38285 39254 239 34 151 119 105 86 225 110 969
Figure 2: Tor capture scenario.
can see in Figure 2, the workstation connects to the
Internet through the gateway virtual machine, which
in turn routes all the traffic through the Tor network.
With this configuration, using the Tor network at the
workstation virtual machine becomes transparent. We
captured the outgoing traffic at the workstation and
the gateway simultaneously, collecting a set of pairs
of .pcap files: one regular traffic pcap (workstation)
and one Tor traffic pcap (gateway) file. Later, we la-
belled the captured traffic in two steps. First, we pro-
cessed the .pcap files captured at the workstation: we
extracted the flows, and we confirmed that the ma-
jority of traffic flows were generated by application
X (skype, ftps, etc.), the object of the traffic capture.
Then, we labelled all flows from the Tor .pcap file
as X. The reason behind this method for labelling the
Tor traffic is that Tor is a circuit oriented protocol: all
traffic from the gateway to the entry node will be en-
crypted and sent through the same connection.
Therefore the flows generated from the Tor traffic
captured will look the same, i.e. same source ip, des-
tination ip, source port, destination port and protocol
(TCP), we will not be able to distinguish them. But
since we are working in a controlled environment, and
we are executing one application at a time, lets say ap-
plication Y, most of the Tor flows will belong to this
application Y. As a consequence of our la labelling
process our training and validation datasets will in-
clude some noise, flows of type X labelled as type Y,
which in turn it will affect the accuracy of our clas-
sifiers. In Table 1 we have a description of the con-
tents of the different datasets, in terms of number of
samples of each type (label). Following, we give a de-
tailed description of the different types of traffic gen-
erated:
Browsing: Under this label we have HTTP and
HTTPS traffic generated by users while browsing
(Firefox and Chrome).
Email: Traffic samples generated using a Thun-
derbird client, and Alice and Bob Gmail accounts.
The clients were configured to deliver mail through
SMTP/S, and receive it using POP3/SSL in one client
ICISSP 2017 - 3rd International Conference on Information Systems Security and Privacy
256

and IMAP/SSL in the other.
Chat: The chat label identifies instant-messaging ap-
plications. Under this label we have Facebook and
Hangouts via web browser, Skype, and IAM and ICQ
using an application called pidgin (https://pidgin.im).
Audio-Streaming: The streaming label identifies au-
dio applications that require a continuous and steady
stream of data. We captured traffic from Spotify.
Video-Streaming: The streaming label identifies
video applications that require a continuous and
steady stream of data. We captured traffic from
Youtube (HTML5 and flash versions) and Vimeo ser-
vices using Chrome and Firefox.
File Transfer: This label identifies traffic applica-
tions whose main purpose is to send or receive files
and documents. For our dataset we captured Skype
file transfers, FTP over SSH (SFTP) and FTP over
SSL (FTPS) traffic sessions.
VoIP: The Voice over IP label groups all traffic gen-
erated by voice applications. Within this label we
captured voice-calls using Facebook, Hangouts and
Skype.
P2P: This label is used to identify file-sharing proto-
cols like Bittorrent. To generate this traffic we down-
loaded different .torrent files from the Kali linux dis-
tribution (https://www.kali.org) and captured traffic
sessions using the Vuze (https://www.vuze.com) ap-
plication. We used different combinations of upload
and download speed to accommodate a more general
behaviour.
3.1 Flow and Features Generation
We use a common definition of flow, where a flow
is defined by a sequence of packets with the same
values for {Source IP, Destination IP, Source Port,
Destination Port and Protocol (TCP or UDP)}. In
the case of Tor traffic, all flows will be TCP, since
it does not support UDP. Along with the flow gener-
ation we calculate the features associated with each
flow. In most of the previous publications the authors
use Netmate (Nguyen and Armitage, 2008),(Aghaei-
Foroushani and Zincir-Heywood, 2015) to extract the
traffic flows and features. But Netmate cannot gen-
erate all the features we need, and it is not officially
available anymore. For this experiment, we used a
new application, the ISCXFlowMeter (ISCXFlowMe-
ter, 2016) to generate the flows and calculate all nec-
essary parameters.
The FlowMeter generates bidirectional flows,
where the first packet determines the forward (source
to destination) and backward (destination to source)
directions, hence the statistical time-related features
are also calculated separately in the forward and re-
verse direction. Note that TCP flows are usually ter-
minated upon connection teardown (by FIN packet)
while UDP flows are terminated by a flow timeout.
The flow timeout value can be assigned arbitrarily
by the individual scheme e.g., 600 seconds for both
TCP and UDP in (Aghaei-Foroushani and Zincir-
Heywood, 2015). In this paper, we also study several
flow timeout (FT) values to determine the impact of
the flow timeout on the final results. In particular, we
set the duration of flows to 10, 15, 30, 60 and 120
seconds.
As previously mentioned in Section 1, we focus
on time-related features. When choosing time-related
features, we consider two different approaches. In the
first approach we measure the time, e.g. time between
packets or the time that a flow remains active. In the
second approach, we fix the time and measure other
variables, e.g., bytes per second or packets per sec-
ond. Following we have a list and description of the
features measured, a total of 23 values:
fiat: Forward Inter Arrival Time, the time between
two packets sent forward direction (mean, min,
max, std).
biat: Backward Inter Arrival Time, the time be-
tween two packets sent backwards (mean, min,
max, std).
flowiat: Flow Inter Arrival Time, the time between
two packets sent in either direction (mean, min,
max, std).
active: The amount of time time a flow was active
before going idle (mean, min, max, std).
idle: The amount of time time a flow was idle before
becoming active (mean, min, max, std).
fb psec: Flow Bytes per second.
fp psec: Flow packets per second.
duration: The duration of the flow.
As one can see, except the duration, which shows
the total time of one flow, there are six groups of fea-
tures. The first three groups are namely: -fiat, -biat,
and -flowiat, and are focused respectively on the for-
ward, backward and bi-directional flows. The fourth
and fifth groups of features, are calculated regarding
to the idle-to-active or active-to-idle states and are
named -idle and -active. Finally, the last group fo-
cuses on the size and number of packets per second
and is named -psec feature.
4 EXPERIMENTS
To test our time-based features we have defined 2 dif-
ferent experiments. The first experiment corresponds
Characterization of Tor Traffic using Time based Features
257

Table 2: Results of feature selection used in the Validation experimen.
Scenario A 15s. Dataset Scenario B 15s. Dataset
SE+BF IG+RK SE+BF IG+RK
min flowiat 1.1815 flowBytesPerSecond duration 0.31552 mean biat
std biat 1.1617 mean fiat flowBytesPerSecond 0.30565 max biat
mean biat 1.1188 mean flowiat mean flowiat 0.29642 std biat
max biat 1.1179 flowPktsPerSecond max flowiat 0.28279 min flowiat
1.0795 max fiat min flowiat 0.26069 flowBytesPerSecond
1.0582 max flowiat mean fiat 0.25335 std fiat
1.0403 max biat std fiat 0.25173 mean fiat
0.9683 std flowiat max fiat 0.24698 mean flowiat
0.9552 mean biat min fiat 0.24666 std flowiat
0.9517 min biat min biat 0.23993 flowPktsPerSecond
0.9128 std fiat 0.23816 duration
0.825 std biat 0.23676 max fiat
0.7877 min fiat 0.19956 max flowiat
0.7289 min flowiat 0.1893 min biat
... ... ... ...
to the Scenario A, and focuses on the detection of
Tor traffic. The second experiment, Scenario B, fo-
cuses on the characterization of Tor traffic, i.e., iden-
tifying applications within Tor traffic. Following, we
describe the scenarios in more detail:
Scenario A: To create this scenario we have merged 2
different datasets, the Tor dataset presented in this pa-
per and an available public dataset of encrypted traffic
generated by Draper-Gil et al. in (Draper-Gil et al.,
2016), which includes the same applications on the
same network. We generated the flows and extracted
our proposed time-based features from each dataset,
and we labelled all flows from the Tor dataset as Tor,
and all flows from Draper-Gil et al. in (Draper-Gil
et al., 2016) as NonTor. We merged and flushed both
groups of labelled flows and used them as input to
the Scenario A experiment. The use case in this sce-
nario is an application that, given a set of time-based
features (Table 2) extracted from an encrypted traffic
flow (input), will tell us if it belongs to Tor (output).
Scenario B: In this scenario, we have used only the
Tor dataset presented in this paper. As we discussed
in Section 3, we generated the flows from the .pcap
files captured at the gateway, and we labelled them
(Browsing, Audio, CHAT, Mail, P2P, FT, VOIP, and
Video) according to application executed on the work-
station (See Figure 2). The use case in this scenario is
an application that given a set of time-based features
(Table 2) extracted from a Tor flow (input), will de-
tect (label) the application type running in this flow
(output).
As we mention in Section 3.1 that we will use 5
different flow-timeout values: 10s., 15s, 30s, 60s and
120s. Therefore, for each scenario (scenarios A and
B) we will have 5 different datasets, one for each flow
timeout value.
4.1 Feature Selection and Validation
To run the experiments we used Weka (Hall et al.,
2009), an open source implementation of a collection
of machine learning algorithms. We have divided our
analysis process in two steps, testing and validation,
dividing our datasets accordingly: 80% for testing and
20% for validation.
In the first step of the analysis we applied differ-
ent feature selection algorithms to each testing dataset
(10s, 15s, 30s, 60s, and 120s), and measured its per-
formance in terms of weighted average precision and
recall. In the Table 2 we can see the results of the fea-
ture selection for each scenario (for readability rea-
sons, we only show the combinations used in the final
step, the validation process), whereas Table 3 presents
the testing results.
In the second step, we evaluated the best com-
bination of features + dataset using the correspond-
ing validation dataset. These results are presented
in figure 3 and discussed in Section 5. Our com-
bination algorithms for feature selection are Cfs-
SubsetEval+BestFirst (SE+BF) and Infogain+Ranker
(IG+RK).
In the Scenario A, as we only have two classes
(Tor and NonTor), we selected the ZeroR, C4.5 and
KNN algorithms. But, in the Scenario B we have
eight classes, therefore we chose Random Forest,
C4.5 and KNN as algorithms to build our classifier.
We executed the tests using 10 fold evaluation on the
test (80%) datasets, and the final evaluation using the
ICISSP 2017 - 3rd International Conference on Information Systems Security and Privacy
258

Table 3: Training results for Scenarios A and B.
Scenario A
Zero R C4.5 KNN
SE+BF IG+RK SE+BF IG+RK SE+BF IG+RK
PR RC PR RC PR RC PR RC PR RC PR RC
10s. 0.777 0.881 0.777 0.881 0.950 0.950 0.973 0.973 0.940 0.940 0.953 0.953
15s. 0.801 0.895 0.801 0.895 0.976 0.976 0.987 0.987 0.967 0.967 0.971 0.970
30s. 0.871 0.933 0.871 0.933 0.979 0.979 0.987 0.987 0.975 0.975 0.976 0.976
60s. 0.922 0.960 0.922 0.960 0.985 0.986 0.990 0.990 0.981 0.981 0.983 0.983
120s. 0.951 0.975 0.951 0.975 0.988 0.988 0.990 0.991 0.985 0.985 0.988 0.988
Scenario B
Random Forest C4.5 KNN
SE+BF IG+RK SE+BF IG+RK SE+BF IG+RK
PR RC PR RC PR RC PR RC PR RC PR RC
10s. 0.760 0.762 0.842 0.840 0.728 0.732 0.790 0.790 0.675 0.676 0.702 0.704
15s. 0.833 0.831 0.841 0.836 0.797 0.798 0.796 0.796 0.688 0.691 0.704 0.707
30s. 0.799 0.799 0.808 0.808 0.760 0.760 0.754 0.756 0.656 0.660 0.664 0.666
60s. 0.744 0.748 0.750 0.754 0.696 0.698 0.690 0.695 0.612 0.611 0.615 0.618
120s. 0.725 0.728 0.741 0.743 0.665 0.664 0.674 0.675 0.595 0.600 0.607 0.609
SE+BF is CfsSubsetEval+BestFirst PR is Precision
IG+RK is Infogain+Ranker RC is Recall
validation datasets (20%) as supplied test set.
To evaluate the quality of our classification pro-
cesses, we used two common metrics: Precision (Pr)
or Positive Predictive value and Recall (Rc) or Sensi-
tivity. The Precision represents the ratio of correctly
classified instances (TP), lets say X, in front of all
the instances classified as X (TP+FP). Whereas the
Recall represents the ratio of correctly classified in-
stances (TP), lets say Y, in front of all Y instances
(TP+FN).
Pr =
T P
T P + FP
Rc =
T P
T P + FN
5 ANALYSIS OF THE RESULTS
In this section we analyze the results obtained in the
testing and validation experiments, for each scenario.
The results of the testing experiment are presented in
Tables 2 ans 3, and the results of the validation exper-
iments are shown in Figure 3.
5.1 Analysis of Scenario A
The results of the feature selection of Scenario A are
presented in Table 2. The results of the combination
CfsSubsetEval+BestFirst (SE+BF) are almost iden-
tical in all 5 datasets, reducing the number of fea-
tures from 23 to 5. In the case of Infogain+Ranker
(IG+RK), the result is a ranked list of the 23 features.
To decide the number of features to include in the test-
ing experiments, we looked for a large decrease of
weight between two consecutive features. In the case
of the features presented in Table 2, the weight of the
last selected feature, the 14th (min flowiat), is 0.7289
and the weight of the next one is 0.4998 (duration), a
large difference compared with the previous ones.
We used the results from the feature selection al-
gorithms to test different machine learning algorithms
(ZeroR, C4.5 and KNN) using 10 fold cross validation
and we measured the weighted average precision and
recall. The results are presented in Table 3. Since it
is a binary classification (Tor vs. NonTor), we used
ZeroR to establish a lower boundary reference. The
Zero R classifier will always classify a sample as the
most common class in the dataset, that explains why
its results improve with the flow timeout value: the
longer the flow timeout, the more unbalanced is the
dataset (we have less Tor samples), as we can see in
Table 1. The results obtained in this step of the pro-
cess, Table 3, show that in all cases C4.5 and KNN
are better that Zero R, the lower boundary.
From the results, it seems that longer timeout val-
ues (120s dataset) provide better results than shorter
ones (e.g., 15s dataset), but this trend also shows that
longer timeout values make our results closer to the
lower bound (Zero R). As example, using C4.5 and
IG+RK, the difference in precision and recall for 10s.
Characterization of Tor Traffic using Time based Features
259
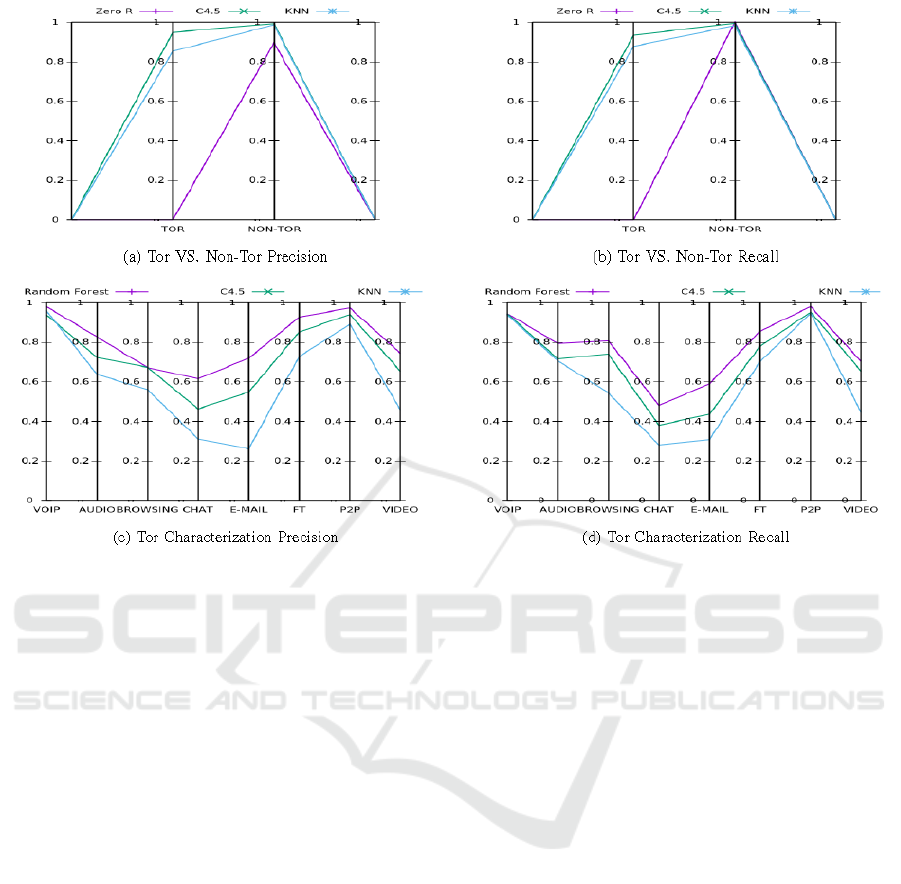
Figure 3: Precision and Recall of Validation experiments.
is 0.196 and 0.092, whereas for 120s is 0.041 and
0.015 respectively. With these results, our candidate
for the validation experiments should be either the
10s. or the 15s. dataset. But we will choose the 15s.
dataset to match the result of the scenario B. In a prac-
tical scenario, it would make sense to have only one
flow generator, and use its result as input to detect and
classify Tor traffic:
• Zero R: the results are independent of the set of
features they only depend on the distribution of
samples. We used 15s dataset to compare with the
C4.5 and KNN results.
• C4.5: 15s dataset and IG+RK.
• KNN: 15s dataset and IG+RK.
Finally, we used the validation dataset to calculate the
precision and recall of the best combinations from the
testing process. The results are presented in Figure
3 (a,b), showing the values of precision and recall for
each class (Tor, nonTor). The best results are obtained
using the C4.5 algorithm, with both precision and re-
call above 0.9. The results for Zero R are 0 and 0.895
for precision and 0 and 1 for recall. Which means
that the Zero R classifier will not detect any Tor sam-
ple, whereas our C4.5 classifier will be able to de-
tect 93.4% of all Tor samples (recall), and every time
it labels one sample as Tor, it will do it with 94.8%
probability of success (precision). Regarding nonTor
samples, by definition the Zero R classifier will detect
100% of nonTor samples (it labels everything as non-
Tor, recall = 1), and its labels will be 89.5% accurate
(precision). Our C4.5 classifier will detect 99.4% (re-
call) of the nonTor samples, and its nonTor labels will
be 99.2% accurate (precision). Following we have the
confusion matrix for the C4.5 algorithm, the one with
best performance:
=== Confusion Matrix ===
a b <--
1053 74 | a = Tor
58 9567 | b = nonTor
The confusion matrix of our classifier shows us
the number of samples correctly classified (matrix di-
agonal), and the number of samples incorrectly clas-
sified, specifying the label with which they were con-
fused. In this case we only have two labels, therefore
Tor labels will always be confused with Non-Tor and
vice versa.
5.2 Analysis of Scenario B
The Scenario B focuses on the characterization of Tor
traffic in 8 different types of traffic (Section 3). The
results of the feature selection are presented in Table
2. In this case, using SE+BF we reduced the number
of features from 23 to 10, and using IG+RK from 23
to 15. In the IG+RK case presented in Table 2, the
ICISSP 2017 - 3rd International Conference on Information Systems Security and Privacy
260

16th (min fiat) feature is weighted with 0.17356 and
the next feature (min active) with 0.02018. Interest-
ingly, in all cases the features discarded by the IG+RK
are the ones measuring the idle and active features.
After the feature selection process, we tested the
results obtained with the 3 different algorithms: Ran-
dom Forests, C4.5 and KNN, using 10 fold cross vali-
dation. The results are presented in Table 3 and show
a clear relation between the flow timeout and the ef-
ficiency of the algorithms tested: the shorter the flow
timeout, the better the results, with an optimal value
of 15s, i.e. with a flow-timeout lower than 15s. the
results are worse. Regarding the efficiency of the al-
gorithms, Random Forest obtained the best results, in
combination with the features selected by the IG+RK
algorithm. From the results presented in Table 3 we
selected the following combination for the validation
experiment:
• Random Forest: 15s. dataset and IG+RK.
• C4.5: 15s. dataset and SE+BF. The results are
similar with both feature selection algorithms, but
for efficiency reasons we chose SE+BF, it requires
less features.
• KNN: 15s. dataset and IG+RK.
Finally, we used the validation dataset to evaluate the
precision and recall of the different algorithms. The
results are presented in Figure 3 (c and d), showing
the values of precision and recall for each of the 8
classes. As the Figure clearly shows, the best results
are obtained with Random Forest, and if we calculate
the weighted average (see Section 4), we obtain the
following values 0.843,0.788,0.705 for precision and
0.838,0.790,0.705 for recall (Random Forest, C4.5
and KNN respectively). If we focus on the particular
values for each class (type of traffic), we can group the
classes in two sets, depending on the results obtained.
In the first group, we have the classes with good pre-
cision and recall results: VOIP, P2P, AUDIO, FT and
VIDEO. In another group, we have the classes our
classifier fails to obtain good results: BROWSING,
CHAT and E-MAIL. To have a better understanding
of the results, following we have the confusion matrix
resulting of the Random Forest experiment:
=== Confusion Matrix ===
a b c d e f g h <--
292 1 11 0 0 2 2 1 | a = VOIP
1 81 15 1 2 0 0 2 | b = AUDIO
2 9 193 12 3 1 0 19 | c = BROWSING
0 1 24 24 1 0 0 0 | d = CHAT
0 3 10 0 23 1 0 2 | e = MAIL
0 0 8 1 2 101 1 5 | f = FT
1 0 1 0 0 0 144 1 | g = P2P
2 3 25 1 1 4 1 87 | h = VIDEO
VOIP and P2P are the best classes, with very few
false positives. In the case of VOIP, the most com-
mon error is to label as BROWSING a VOIP sam-
ple, which makes sense, some of the applications used
for capturing VOIP are web based, therefore they will
also generate some browsing traffic. In the case of
P2P we have almost a perfect match. AUDIO and
VIDEO have a similar pattern, being most confused
with BROWSING, and viceversa. Again, this confu-
sion makes sense, all video applications used are web
based.
If we look at the BROWSING column, which
shows how many classes have been wrongly labelled
as BROWSING, we can see that it is the most com-
mon mistake. At the same time, the AUDIO, VIDEO
and CHAT are the most common mistakes when la-
belling BROWSING traffic, i.e. we label as BROWS-
ING a sample that belongs to CHAT, AUDIO or
VIDEO. Since many applications are web-based or
use https as communication protocol it is normal that
the BROWSING class becomes the most common
mistake. Moreover, as we explain in Section 3, we
label all flows generated from the class X .pcap file
as X, which means that our dataset will have some
background noise that may difficult the detection of
certain types of traffic, like BROWSING which may
be present in all samples with independence of the la-
bel.
6 CONCLUSIONS
In this paper we presented a time analysis to detect
and characterize Tor traffic. The set of features cho-
sen are time-based statistics only (-fiat, -biat, -flowiat,
-idle, -active and -psec) derived from the observation
of traffic flows between a Tor client and a Tor entry
node. The results obtained prove that time base fea-
tures can be used to detect Tor traffic efficiently: only
10 features are needed. Moreover, time base features
can be used to characterize Tor traffic and efficiently
detect different traffic applications like VoIP, Audio
Streaming, P2P, File-Transfer and Video Streaming.
In addition to the Tor detection and classification con-
tributions, our results show that flow timeout has an
influence on the efficiency of the solution our classi-
fiers perform better when the flows are generated us-
ing shorter timeout values, with 15s. as the optimal
value, which contradicts the common assumption of
using 600s as timeout duration. As part of this work,
we published the labelled dataset used in this exper-
iment and the tool used to generate it, so that other
researchers can use them to replicate this experiment
and to test their own proposals in future. As future
work we plan to extend our dataset and further study
the application of time-based features to characterize
Characterization of Tor Traffic using Time based Features
261

encrypted traffic. Also, we planned to extend our IS-
CXFlowMeter application to extract the other features
such as Flow-based and Packet-based to experiment
the combination of these feature sets.
REFERENCES
Aghaei-Foroushani, V. and Zincir-Heywood, A. N. (2015).
A proxy identifier based on patterns in traffic flows.
In 2015 IEEE 16th International Symposium on High
Assurance Systems Engineering, pages 118–125.
AlSabah, M., Bauer, K., and Goldberg, I. (2012). Enhanc-
ing tor’s performance using real-time traffic classifi-
cation. In Proceedings of the 2012 ACM Conference
on Computer and Communications Security, CCS ’12,
pages 73–84, New York, NY, USA. ACM.
Bai, X., Zhang, Y., and Niu, X. (2008). Traffic identifica-
tion of tor and web-mix. In 2008 Eighth International
Conference on Intelligent Systems Design and Appli-
cations, volume 1, pages 548–551.
Callado, A., Kamienski, C., Szabo, G., Gero, B., Kelner,
J., Fernandes, S., and Sadok, D. (2009). A survey on
internet traffic identification. Commun. Surveys Tuts.,
11(3):37–52.
Chaabane, A., Manils, P., and Kaafar, M. A. (2010). Dig-
ging into anonymous traffic: A deep analysis of the
tor anonymizing network. In Proceedings of the 2010
Fourth International Conference on Network and Sys-
tem Security, NSS ’10, pages 167–174, Washington,
DC, USA. IEEE Computer Society.
Chakravarty, S., Barbera, M. V., Portokalidis, G., Poly-
chronakis, M., and Keromytis, A. D. (2014). On the
effectiveness of traffic analysis against anonymity net-
works using flow records. PAM 2014, pages 247–257,
New York, NY, USA. Springer-Verlag New York, Inc.
Dainotti, A., Pescap, A., and Claffy, K. (2012). Issues and
future directions in traffic classification. IEEE Net-
work, 26(1):35–40.
Dingledine, R., Mathewson, N., and Syverson, P. (2004).
Tor: The second-generation onion router. In Proceed-
ings of the 13th Conference on USENIX Security Sym-
posium - Volume 13, SSYM’04, pages 21–21, Berke-
ley, CA, USA. USENIX Association.
Draper-Gil, G., Lashkari, A. H., Mamun, M. S. I., and Ghor-
bani, A. A. (2016). Characterization of encrypted and
vpn traffic using time-related features. In Proceedings
of the 2nd International Conference on Information
Systems Security and Privacy - Volume 1: ICISSP,,
pages 407–414.
Hall, M., Frank, E., Holmes, G., Pfahringer, B., Reute-
mann, P., and Witten, I. H. (2009). The WEKA data
mining software: An update. SIGKDD Explorations,
11(1):10–18.
He, G., Yang, M., Luo, J., and Gu, X. (2014). Inferring
application type information from tor encrypted traf-
fic. In 2014 Second International Conference on Ad-
vanced Cloud and Big Data, pages 220–227.
ISCXFlowMeter (2016). Information security cen-
ter of excellence, university new brunswick.
http://www.unb.ca/research/iscx/dataset /iscxflowme-
ter.html.
Johnson, A., Wacek, C., Jansen, R., Sherr, M., and Syver-
son, P. (2013). Users get routed: Traffic correlation
on tor by realistic adversaries. In Proceedings of the
2013 ACM SIGSAC Conference on Computer &
Communications Security, CCS ’13, pages 337–348,
New York, NY, USA. ACM.
Juarez, M., Afroz, S., Acar, G., Diaz, C., and Greenstadt, R.
(2014). A critical evaluation of website fingerprint-
ing attacks. In Proceedings of the 2014 ACM SIGSAC
Conference on Computer and Communications Secu-
rity, CCS ’14, pages 263–274, New York, NY, USA.
ACM.
Ling, Z., Luo, J., Wu, K., Yu, W., and Fu, X. (2014).
Torward: Discovery of malicious traffic over tor. In
IEEE INFOCOM 2014 - IEEE Conference on Com-
puter Communications, pages 1402–1410.
Mittal, P., Khurshid, A., Juen, J., Caesar, M., and Borisov,
N. (2011). Stealthy traffic analysis of low-latency
anonymous communication using throughput finger-
printing. In Proceedings of the 18th ACM Conference
on Computer and Communications Security, CCS ’11,
pages 215–226, New York, NY, USA. ACM.
Nguyen, T. T. T. and Armitage, G. (2008). A survey of
techniques for internet traffic classification using ma-
chine learning. IEEE Communications Surveys Tuto-
rials, 10(4):56–76.
Quinlan, J. R. (1993). C4.5: Programs for Machine Learn-
ing. Morgan Kaufmann Publishers Inc., San Fran-
cisco, CA, USA.
Serjantov, A. and Sewell, P. (2003). Passive Attack Analysis
for Connection-Based Anonymity Systems, pages 116–
131. Springer Berlin Heidelberg, Berlin, Heidelberg.
Shmatikov, V. and Wang, M.-H. (2006). Timing analysis
in low-latency mix networks: Attacks and defenses.
In Proceedings of the 11th European Conference on
Research in Computer Security, ESORICS’06, pages
18–33, Berlin, Heidelberg. Springer-Verlag.
ICISSP 2017 - 3rd International Conference on Information Systems Security and Privacy
262
