
Characterisation of Resting Brain Network Topologies across the
Human Lifespan with Magnetoencephalogram Recordings:
A Phase Slope Index and Granger Causality Comparison Study
Elizabeth Shumbayawonda
1
, Alberto Fernández
2
, Javier Escudero
3
,
Michael Pycraft Hughes
1
and Daniel Abásolo
1
1
Centre for Biomedical Engineering, Department of Mechanical Engineering Sciences,
Faculty of Engineering and Physical Sciences, University of Surrey, Guildford, U.K.
2
Departamento de Psiquiatría y Psicología Médica UCM,
Laboratorio UPM-UCM de Neurociencia Cognitiva y Computacional, 28040 Madrid, Spain
3
Institute for Digital Communications, School of Engineering, The University of Edinburgh, Edinburgh, EH9 3FB, U.K.
Keywords: Granger Causality, Phase Slope Index, Graph Theory, Complex Network, Ageing, Magnetoencephalography.
Abstract: This study focuses on the resting state network analysis of the brain, as well as how these networks change
both in topology and location throughout life. The magnetoencephalogram (MEG) background activity from
220 healthy volunteers (age 7-84 years), was analysed combining complex network analysis principles of
graph theory with both linear and non-linear methods to evaluate the changes in the brain. Granger Causality
(GC) (linear method) and Phase Slope Index (PSI) (non-linear method) were used to observe the connectivity
in the brain during rest, and as a function of age by analysing the degree, clustering coefficient, efficiency,
betweenness, modularity and maximised modularity of the observed complex brain networks. Our results
showed that GC showed little linear causal activity in the brain at rest, with small world topology, while PSI
showed little information flow in the brain, with random network topology. However, both analyses produced
complementary results pertaining to the resting state of the brain.
1 INTRODUCTION
The brain is the main hub of all intellectual activity,
the coordination centre of all levels of conscious and
subconscious movement as well as the interpretation
centre of all activity (Fornito, et al., 2015; Rescorla,
2015). It is made up of soft nervous tissue and is one
of the largest organs in the body (Orrison, 2008).
Similarly, like any other organ in the body, the brain
is subject to changes with age. Thus, many studies
have been conducted in a bid to understand how the
structure and function of the brain are affected by the
ageing process throughout life (Lebel, et al., 2007;
Schafer, et al., 2014).
Complex network analysis, a subset of methods
from graph theory, has been successfully used to
analyse multidimensional, multimodal systems
containing various levels of directed, undirected,
symmetric, and unsymmetrical connections
(Chowdhury & Stauffer, 2000; Hsu, et al., 2003;
Sporns, et al., 2004; Dehemer, 2010). At its core, a
graph is defined as a mathematical representation of
a network made up of nodes and edges. Graph theory
principles, such as degree, clustering coefficient,
betweenness centrality, efficiency, modularity, and
maximised modularity, can be used to estimate
robustly the structure of observed networks in the
brain (Dehemer, 2010). Centrality measures such as
degree and betweenness provide a description of local
centrality and connectivity, segregation measures
such as clustering coefficient provide a description of
the subdivision within in a network, and modularity
and maximised modularity provide a description of
the overall structure of the detected graph network.
Thus, centrality measures provide the intimate details
of the structures alluded to by the topology analyses,
and so enable robust descriptions of the observed
network topologies (Bullmore & Sporns, 2009).
When applied to neuroscience, these graphs can
be used to define robust estimates of structural,
functional and anatomic networks present in the brain
(Papo, et al., 2013; Fornito, et al., 2015). Many
studies have been conducted to determine the changes
in the brain at rest, task or due to pathology using
118
Shumbayawonda E., Fernà ˛andez A., Escudero J., Hughes M. and Abà ˛asolo D.
Characterisation of Resting Brain Network Topologies across the Human Lifespan with Magnetoencephalogram Recordings: A Phase Slope Index and Granger Causality Comparison Study.
DOI: 10.5220/0006104201180125
In Proceedings of the 10th International Joint Conference on Biomedical Engineering Systems and Technologies (BIOSTEC 2017), pages 118-125
ISBN: 978-989-758-212-7
Copyright
c
2017 by SCITEPRESS – Science and Technology Publications, Lda. All rights reserved

functional magnetic resonance imaging (fMRI),
magnetoencephalography (MEG),
electroencephalography (EEG), and
electrocorticography (ECoG) to determine the
changes in the brain either at rest, task or due to
pathology (Ogawa, et al., 1990; Niedermeyer &
Lopes da Silva, 2005; Jafarpour, et al., 2013).
A study performed by Goldenberg and Galvan
(2015) using fMRI and dynamic causal modelling
(DCM) revealed that in resting state, brain network
topologies resembled small world architecture when
studied using graphs theory. However, when the brain
was studied using Pearson’s Correlation, Cao et al.
(2013) observed that the brain networks present in the
brain throughout life, move from being local to
distributed and revert back to having local functional
structure. Furthermore studies performed by
Huttenlocher, et al. (1982), Good, et al. (2001), Salat,
et al. (2005), and Giedd and Rapoport (2010) show
that changes in the brain networks were attributed to
the maturation of nerve fibres, changes in myelination
in the brain as it matures, synaptic pruning as well as
changes in the dendrite structures throughout life.
Over the years, there has been a notable increase
in the use of magnetoencephalograms (MEGs) to
study the background activity of the brain.
Magnetoencephalography is a non-invasive analysis
technique used to record, reference free, the magnetic
fields generated by electrical activity in the human
brain (Gomez, et al., 2008; Escudero, et al., 2009;
Jafarpour, et al., 2013). Due to the weak magnetic
fields generated by the brain, large arrays of
superconducting quantum interface devices
(SQUIDs) immersed in liquid helium at 4.2K and
below are used to record the brains activity in a
magnetically shielded room to reduce contamination
by environmental noise (Ahonen, et al., 1993; Stam,
2005; Carlson, et al., 2007).
With the advances in technology and a higher life
expectancy, it becomes necessary to be able to map
and define the changes that networks in the brain
undergo throughout life. In so doing, this knowledge
of healthy ageing could help in the early diagnosis of
pathologies such as dementia and epilepsy as they can
assist with the identification of activity lying outside
the normal ranges defined by the healthy ageing brain
networks.
The use of linear vs. non-linear analysis to
accurately describe brain dynamics, has been under
debate, with researchers using either branch of
analysis to validate their preferences (Stam, 2005).
Therefore, in this study, the use of both linear and
non-linear methods to analyse the brain networks
recorded using MEG was performed so as to
determine if non-linear analysis is superior to linear
analysis or if these analyses are complementary
(Nolte, et al., 2010; Haufe, et al., 2012).
In this study, we examined MEG background
activity in healthy subjects using GC and PSI. The
main aim of this work was to test the hypothesis that
linear analysis tools reveal less information when
compared to non-linear analysis tools. The results
from GC and PSI were then used in combination with
network analysis tools to determine if the topology of
the brain networks changed with age.
2 MATERIALS AND METHODS
2.1 Materials
MEGs were recorded in a shielded room using a
whole head magnetometer with 148 channels
(MAGNES 2500WH, 4D Neuroimaging) at ‘Centro
de Magnetoencefalografía Dr. Pérez-Modrego’
(Madrid, Spain). The subjects lay comfortably in an
awake relaxed state with eyes closed while 5 minutes
of recording was acquired. The MEGs were recorded
at sampling frequency of 678.17Hz using a hardware
bandpass filter from 0.1 to 200Hz after which down
sampling using Nyquist criterion followed to obtain a
sampling rate of 169.55Hz. The MEG data were
acquired from 220 subjects aged between 7 and 84
and were grouped according to age. Table 1
summarises the relevant information about the
different age groups.
Table 1: Grouping of subjects according to age.
Group Age Subjects Male Female
1 7-10 12 7 5
2 11-20 27 11 16
3 21-30 39 15 24
4 31-40 30 19 11
5 41-50 15 9 6
6 51-60 22 12 10
7 61-70 44 12 32
8 71-80 27 12 15
9 81-84 4 1 3
2.2 Methods
2.2.1 Granger Causality
Granger causality (GC) is a linear asymmetric method
used to predict causality between two simultaneously
occurring signals. The results from the use of GC
have been successfully used to characterise functional
circuits in the brain by identifying regional
Characterisation of Resting Brain Network Topologies across the Human Lifespan with Magnetoencephalogram Recordings: A Phase Slope
Index and Granger Causality Comparison Study
119

activations (Seth, et al., 2015). For instance, the study
of lexical influences on speech perception performed
by Gow et al. (2008) used GC to reveal the functional
architecture of cognition. Furthermore the use of GC
to analyse monkey brain dynamics has revealed
causal relationships in the alpha, beta and gamma
ranges (Friston, et al., 2013).
Though GC is a powerful analysis tool lying
between fully model-free and light model dependent
methods, it only models linear interactions (Bressler
& Richter, 2014). Therefore, though the use of a
higher model order can be used to try analyse non-
linear systems, more often than not this leads to
confound results (Gao, et al., 2015; Winkler, et al.,
2015).
GC can be determined using the following
equations where the univariate autoregressive model
is used to calculate the regression of
which is
added to the past values of
. The model
parameters
are estimated using least squares
method while the order is estimated using the Akaike
and Bayesian Information Criterion (Akaike, 1974;
Schwarz, 1978):
→
|
̅
|
̅
,
(1)
|
̅
,
(2)
|
̅
,
(3)
|
̅
|
(4)
where var (.) is the variance over time and |̅, is
the prediction of
by the past samples of values
of
and
and the residuals which depend on
the past values of both signals are:
|,
|,
|,
|,
(5)
The results of this analysis range from 0
→
∞
, with the lower limit implying that the
past of p (t) does not improve the prediction of q (t).
However, the upper limit implies that the past of p (t)
improves the prediction of q (t) therefore implying
that q is causal to p (Niso, et al., 2013).
2.2.2 Phase Slope Index
Phase slope index (PSI) is a non-linear asymmetric
method that makes use of the complex coherency
function to detect synchronous statistically
significant time delays between two signals (Niso, et
al., 2013). By calculating a combination of both
instantaneous and delayed causal relationships
between two signals PSI can be used to determine the
flow direction of information and thus can be used to
determine the level of synchronisation in a network.
The use of PSI has increased over the years. Nolte et
al. (2010) applied PSI to EEG data and found that
there was a net flow of information between default
regions of the brain when the eyes are open.
Furthermore, Rana et al. (2012) detected an increase
in information flow in the brain at the onset of
epileptic seizures using PSI. PSI can be determined
using:
Ψ
Ψ
Ψ
(6)
Ψ
∗
(7)
Where
is the complex coherence, is the
frequency resolution, . is the imaginary part and
is the set of frequencies over which the slope is
summed (Niso, et al., 2013).
In this study, the entire 5 minute length of
recording was used un-epoched so as to extract as
much information as possible. The data was filtered
using an FIR bandpass filter with cut-off frequencies
at 1.5 Hz and 40 Hz. Additionally, the HERMES
toolbox was used to do the GC and PSI calculations
on the data set (Niso, et al., 2013). Graph theory
complex network analysis was then used to determine
the connectivity of the brain networks. By evaluating
the node degree, betweenness centrality, local (nodal)
and global efficiencies, modularity and maximised
modularity, the structure of the brain networks was
inferred.
3 RESULTS
Before processing the MEG signals with GC and PSI.
They were tested for stationarity using the augmented
Dickey–Fuller test (ADF). To avoid the potential loss
of information associated with the selection of a
threshold that can be used to binarise the data for
network analysis, the results presented below for both
GC and PSI were saved as weighted data in adjacency
matrices, after which they were combined with
complex network analysis tools.
Figures 1 and 2 illustrate the results observed
using GC and graph theory principles on the MEG
dataset. Sparsely connected global networks with low
BIOSIGNALS 2017 - 10th International Conference on Bio-inspired Systems and Signal Processing
120

nodal degree, low clustering coefficient, and low
betweenness were observed throughout life.
Furthermore, low nodal and global network
efficiencies were observed despite the maximised
modularity results showing that the module
topologies reflected ordered structures. Therefore,
though the structure and number of identified
modules changes throughout life, it was observed that
the topology of these structures does not.
Figures 3 and 4 show a graphical representation
of the observed results using PSI and graph theory on
the MEG dataset. Densely connected global networks
with high nodal degree, low clustering coefficient and
high betweenness were observed throughout life.
However, low network efficiency was also observed
on both local (nodal) and global scales. Furthermore,
the maximised modularity values for the brain
networks were all high, i.e. >0.7, therefore implying
that the structure of the identified modules were
similar to random networks, a result echoed by the
modularity analysis.
4 DISCUSSION
In this pilot study we explored the ability of GC and
PSI to identify the structure of brain networks in
MEG recordings of 220 healthy volunteers. The
results obtained by applying GC and graph theory
revealed that there is very little causal activity present
in the brain during rest throughout life. These results
complement those obtained by Stam et al. (2016) who
observed that the brain at rest resembles a system that
is in phase transition and thus, until an input disrupts
the rest state, the system will remain in ‘limbo’.
Therefore, the presence of simple non-causal modules
in the brain aide in maintaining this rest state to ensure
that the brain operates optimally upon reception of an
input.
It has been argued that PSI, being a non-linear
analysis tool, reveals more information than a linear
analysis tool. Nolte et al. (2010) observed in EEGs
that PSI enabled them to determine robust estimations
of the net flow of information between regions of the
brain when eyes are open, while GC was not able to
reveal this. Complementary to this study, Rana et al.
(2012) also observed an increase in the information
flow in the brain before the onset of an epileptic
seizure using PSI, therefore suggesting that there is a
net flow of information in the brain during task and
pathology. Literature has shown that brain networks
resemble small world network topology, however
contrary to this, the results from this study have
revealed that at rest, the brain networks resemble a
more random topology. Rubinov et al. (2011) and
Deco et al. (2013) suggested that the meaningful
relation between structure and function can be
identified when a system is near a critical state.
Therefore, if the resting brain, which is assumed to be
in a metastable state, is analysed using PSI, very little
synchronisation between MEG channels,
representing network nodes, can be observed, thus
resulting in the complex brain network resembling a
densely connected random network structure. With
this in mind it is then plausible that in a healthy brain
at rest, i.e. without mind wandering or daydreaming,
there is no distinct flow of information between
network nodes (Bullmore & Sporns, 2009; Rubinov,
et al., 2011; Deco, et al., 2013).
The results obtained using GC and PSI, both
reveal different aspects of the resting state brain
networks. While GC showed the absence of Granger-
causality between any of the brain regions, PSI
revealed that there were no regions of the brain that
exhibited efficient information flow.
Nevertheless both linear and non-linear
approaches have shown that the brain has very low
efficiency at rest and resembles a metastable state
(Stam, et al., 2016). Evidently, the connectivity of the
brain networks have shown that both linear and non-
linear analysis tools show complementary
information i.e. that there is very low causal activity
in the brain at rest, and that though there are many
paths for information flow in the brain, there is little
observable net information flow at rest (Nolte, et al.,
2010; Haufe, et al., 2012). Though PSI and GC
revealed different network topological structures of
the resting brain, the low granger-causal information
present in the brain coupled with the difficulty in
prediction of the direction of information flow in the
brain, can be used in combination to give a more
complete image of the metastable state of the brain at
rest. Thus, the results from this study show that non-
linear and linear analysis tool work hand-in-hand as
they give complementary information about brain
network topology at rest. Finally, this study was also
observing if there were any changes in the topological
structures of the resting brain throughout life. The
results in Figure 1(e) show that the network
topologies for all groups had maximized
modularity<0.3, which implies that across all ages
when analysed using GC the network topologies were
all of simple network topology. Similarly, the results
in Figure 2(e) show that the maximized
modularity>0.7 thus implying random network
topology for the PSI results across all groups
(Dehemer, 2010). These results suggest that when
analysed using GC and PSI there are no differences
Characterisation of Resting Brain Network Topologies across the Human Lifespan with Magnetoencephalogram Recordings: A Phase Slope
Index and Granger Causality Comparison Study
121
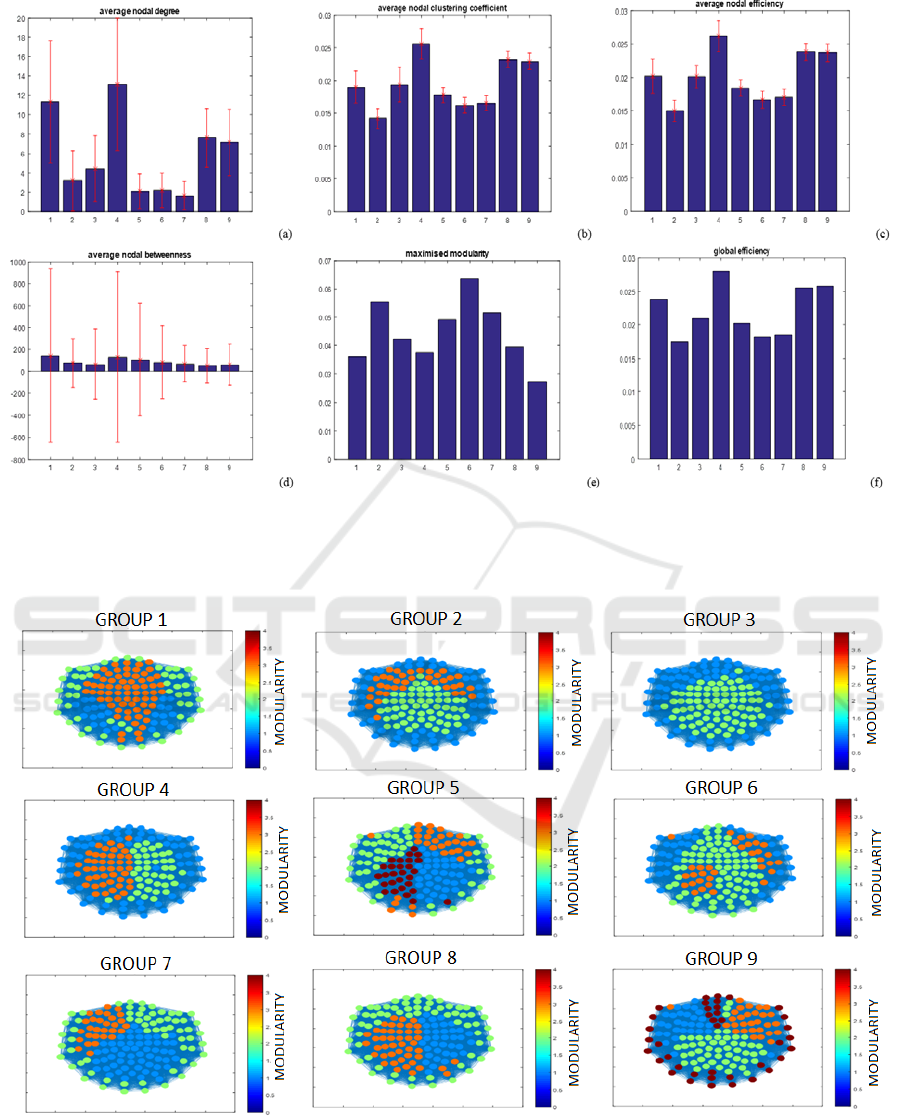
Figure 1: Averaged results for analysis performed using Granger Causality for (a) nodal degree, (b) clustering coefficient, (c)
local efficiency, (d) betweenness, (e) maximised modularity and (f) global efficiency, with the error bars representing the
standard deviation for each group (where the numbers on the x axis represent the subject group number i.e. 1 represents group
1).
Figure 2: Modularity results obtained after using GC to determine the different clusters detected in the brain resting state
network, as well as their location.
BIOSIGNALS 2017 - 10th International Conference on Bio-inspired Systems and Signal Processing
122
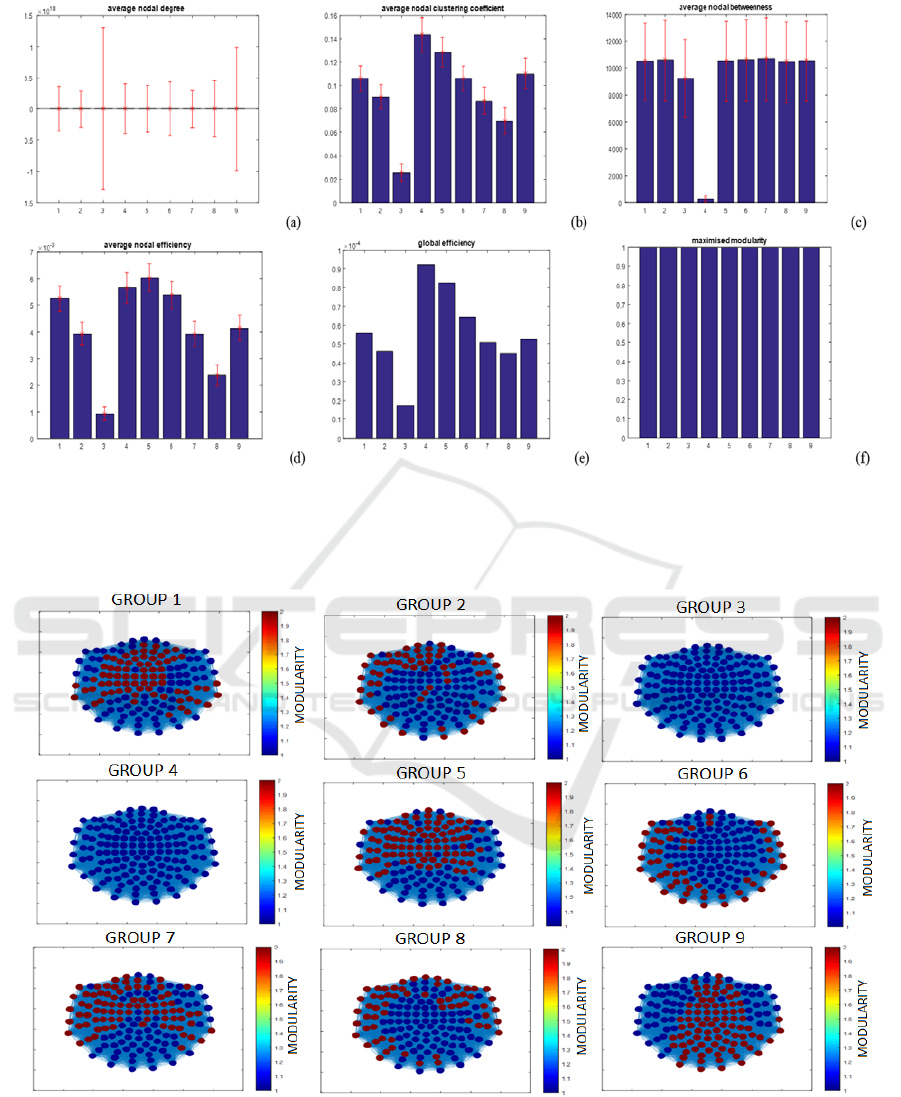
Figure 3: Averaged results for analysis performed using Granger Causality for (a) nodal degree, (b) clustering coefficient, (c)
local efficiency, (d) betweenness, (e) maximised modularity and (f) global efficiency, with the error bars representing the
standard deviation for each group (where the numbers on the x axis represent the subject group number i.e. 1 represents group
1).
Figure 4: Modularity results obtained after using PSI to determine the different clusters detected in the brain resting state
network, as well as their location.
in network topology throughout life.
Some limitations of the study should be
mentioned. Firstly, the groups did not contain similar
number of subjects with group 7 having 44 subject
and group 9 only 4. Thus, the results for the latter
group may not be conclusive. Furthermore, analysis
Characterisation of Resting Brain Network Topologies across the Human Lifespan with Magnetoencephalogram Recordings: A Phase Slope
Index and Granger Causality Comparison Study
123

was done using only two methods, and so more
methods should be used to explore the MEG
background activity of the brain. Thus, future lines of
research will include further signal processing using
methods such as synchronisation likelihood, transfer
entropy and mutual information so as to obtain a more
complete description of the MEG background activity
with ageing. In addition, statistical analysis will be
performed to ascertain the significance of the
obtained results.
5 CONCLUSIONS
A study of brain network topology was conducted
using granger causality and phase slope index, in
combination with graph theory, on data acquired from
MEG recordings. The results observed showed that
both linear and non-linear analysis tools reveal
different complementary aspects of brain
connectivity.
REFERENCES
Ahonen, A., Hämäläinen, M., Kajola, M., Laine, P.,
Lounasmaa, O., Parkkonen, L., Simola, J. and Tesche,
C. (1993) '122-channel squid instrument for
investigating the magnetic signals from the human
brain', Physica Scripta, vol. T49A, pp. 198-205.
Akaike, H. (1974) 'A new look at the statistical model
identification', IEEE Transactions on Automatic
Control, vol. 19, no. 6, pp. 716-723.
Bressler, S.L. and Richter, C.G. (2014) ' Interareal
oscillatory synchronization in top-down neocortical
processing', Current Opinion in Neurobiology, vol.
31C, pp. 62-66.
Bullmore, E. and Sporns, O. (2009) 'Complex brain
networks: Graph theoretical analysis of structural and
functional systems', Nature Reviews Neuroscience, vol.
10, no. 3, pp. 186-198.
Cao, M., Wang, J., Dai, Z., Cao, X., Jiang, L., Fan, F., Song,
X., Xia, M., Shu, N., Dong, Q., MPMilham, Milham,
M., Castellanos, F., Zuo, X. and He, Y. (2013)
'Topological organization of the human brain functional
connectome across the lifespan', Developmental
cognitive neuroscience, vol. 7, pp. 76-93.
Carlson, N.R., Heth, C.D., Miller, H., Donahoe, W, Buskist,
J.W and Martin, N.G. (2007) 'BIOLOGY OF
BEHAVIOR', in PSYCHOLOGY: THE SCIENCE OF
BEHAVIOR, Boston: Pearson.
Chowdhury, D. and Stauffer, D. (2000) Principles of
equilibrium statistical mechanics, Weinheim: Wiley-
VCH.
Deco, G., Ponce-Alvarez, A., Mantini, D., Romani, G.L.,
Hagmann, P. and Corbetta, M. (2013) 'Resting-state
functional connectivity emerges from structurally and
dynamically shaped slow linear fluctuations', The
Journal of Neuroscience, vol. 33, no. 27, pp. 11239-
11252.
Dehemer, M. (2010) Structural Analysis of Complex
Networks, Illustrated edition, Vienna: Springer Science
& Business Media.
Escudero, J., Hornero, R., Abasolo, D. and Fernandez, A.
(2009) 'Blind source separation to enhance spectral and
non-linear features of magnetoencephalogram
recordings. Application to Alzheimer's disease',
Medical Engineering and Physics, vol. 31, pp. 872-879.
Fornito, A., Zalesky, A. and Breakspear, M. (2015) 'The
connectomics of brain disorders', Neuroscience, vol.
16, no. 3, pp. 159-172.
Friston, K., Moran, R. and Seth, A.K. (2013) 'Analysing
connectivity with Granger causality and dynamic
causal modelling.', Current Opinion in Neurobiology,
vol. 23, pp. 172-178.
Gao, L., Sommerlade, L., Coffman, B., Zhang, T., Stephen,
J.M., Li, D., Wang, J., Grebogi, C. and Schelter, B.
(2015) 'Granger causal time-dependent source
connectivity in the somatosensory network', Scientific
Reports 5, vol. 5, no. 10399, pp. 1-10.
Giedd, J.N. and Rapoport, J.L. (2010) 'Structural MRI of
pediatric brain development: what have we learned and
where are we going?', Neuron, vol. 67, pp. 728-734.
Goldenberg, D. and Galvan, A. (2015) 'The use of
functional and effective connectivity techniques to
understand the developing brain', Developmental
cognitive neuroscience, vol. 12, pp. 156-164.
Gomez, C., Hornero, R., Mediavilla, A., Fernandez, A. and
Abasolo, D. (2008) 'Nonlinear forecasting
measurement of magnetoencephalogram recordings
from alzheimers disease patients', British Columbia,
2153-2156.
Good, C.D., Johnsrude, I.S., Ashburner, J., Henson, R.N.,
Friston, K.J. and Frankowiak, R.S. (2001) 'A voxel-
based morphometric study of ageing in 465 normal
adult human brains', Neuroimage, vol. 16, pp. 21-36.
Gow, D.W.J., Segawa, J.A., Ahlfors, S.A. and Lin, F.
(2008) 'Lexical influences on speech perception: A
Granger causality analysis of MEG and EEG source
estimates', NeuroImage, vol. 43, pp. 614-623.
Haufe, S., Nikulin, V.V., Muller, K.R. and Nolte, G. (2012)
'A critical assessment of connectivity measures for EEG
data: a simulation study.', Neuroimage, vol. 64, pp. 120-
133.
Hsu, H.P., Mehra, V. and Grassberger, P. (2003) 'Structure
optimization in an off-lattice protein model', Physical
Reviews E, vol. 68, no. 037703, pp. 1-4.
Huttenlocher, P.R., De Courten, C., Garey, L.J. and Van der
Loos, H. (1982) 'Synaptic development in human
cerebral cortex', International Journal of Neurology,
vol. 16-17, pp. 144-154.
Jafarpour, A., Barnes, G., Fuentemilla, L., Duzel, E. and
Penny, W.D. (2013) 'Population Level Inference for
Multivariate MEG Analysis', Public Library of Science,
vol. 8, no. 8, pp. 1-8.
Lebel, C., Walker, L., Leemans, A., Phillips, L. and Beauli,
C. (2007) 'Microstructural maturation of the human
BIOSIGNALS 2017 - 10th International Conference on Bio-inspired Systems and Signal Processing
124

brain from childhood to adulthood', NeuroImage, vol.
40, pp. 1044-1055.
Niedermeyer, E. and Lopes da Silva, F.H. (2005)
Electroencephalography: Basic Principles, Clinical
Applications, and Related Fields, 5th edition, London:
Lippincott Williams & Wilkins.
Niso, G., Bruña, R., Pereda, E., Gutiérrez, R., Bajo, R.,
Maestú, F. and del-Pozo, F. (2013) 'HERMES: towards
an integrated toolbox to characterize functional and
effective brain connectivity', Neuroinformatics, vol. 11,
pp. 405-434.
Nolte, G., Ziehe, A., Kramer, N., Popescu, F. and Müller,
K.R. (2010) 'Comparison of Granger Causality and
Phase Slope Index', Journal of Machine Learning
Research, vol. 6, pp. 267-276.
Ogawa, S., Lee, T.M., Nayak, A.S. and Glynn, P. (1990)
'Oxygenation-sensitive contrast in magnetic resonance
image of rodent brain at high magnetic fields', Magnetic
Resonance in Medicine, vol. 14, no. 1, pp. 68-78.
Orrison, W.W. (2008) Atlas of Brain Function, Illustrated
edition, New York: Thieme.
Papo, D., Buldu, J.M., Boccaletti, S. and Bullmore, E.T.
(2013) 'Complex network theory and the brain',
Philosophical Transactions of the Royal Society B, vol.
369, pp. 1-7.
Peters, R. (2005) 'Ageing and the brain', Postgraduate
Medical Journal, vol. 82, no. 964, pp. 84-88.
Rana, P., Lipor, J., Lee, H., van Drongelen, W., Kohrman,
M.H. and Van Veen, B. (2012) 'Seizure detection using
the phase-slope index and multichannel ECoG.', IEEE
Transactions on Biomedical Engineering, vol. 59, no. 4,
pp. 1125-1134.
Rescorla, M. (2015) The Computational Theory of Mind,
7th edition, Stanford: The Stanford Encyclopedia of
Philosophy.
Rubinov, M., Sporns, O., Thivierge, J.P. and Breakspear,
M. (2011) 'Neurobiologically realistic determinants of
self-organized criticality in networks of spiking
neurons', Public library of Science Computational
Biology, vol. 7, no. 6, pp. 1-14.
Salat, D.H., Tuch, D.S., Greve, D.N., van der Kouwe, A.J.,
Hevelone, N.D., Zaleta, A.K., Rosen, B.R., Fischl, B.,
Corkin, S., Rosas, H.D. and Dale, A.M. (2005) 'Age-
related alterations in white matter microstructure
measured by diffusion tensor imaging', Neurobiology
of Aging, vol. 26, pp. 1215-1227.
Schafer, C.B., Morgan, B.R., Ye, A.X., Taylor, M. and
Doesburg, S.M. (2014) 'Oscillations, networks and their
development: MEG connectivity changes with age',
Human Brain Mapping, vol. 35, no. 10, pp. 5249-5261.
Schwarz, G. (1978) 'Estimating the dimension of a model',
Annals off Statistics, vol. 6, no. 2, pp. 461-464.
Seth, A.K., Barrett, A.B. and Barnett, L. (2015) 'Granger
Causality Analysis in Neuroscience and
Neuroimaging', The Journal of Neuroscience, vol. 35,
no. 8, pp. 3293-3297.
Sporns, O., Chialvo, D., Kaiser, M. and Hilgetag, C. (2004)
'Organization, development and function of complex
brain network', TRENDS in Cognitive Sciences, vol. 8,
no. 9, pp. 418-425.
Stam, C. (2005) 'Nonlinear dynamical analysis of EEG and
MEG: Review of an emerging field', Clinical
Neurophysiology, vol. 116, pp. 2266-2301.
Stam, C.J., van Straaten, E.C., Van Dellen, E., Tewarie, P.,
Gong, G., Hillebrand, A., Meier, J. and Van Mieghem,
P. (2016) 'The relation between structural and
functional connectivity patterns in complex brain
networks.', International Journal of Psychophysiology,
vol. 103, pp. 149-160.
Winkler, I., Haufe, S., Porbadnigk, A.K., Muller, K.R. and
Dahne, S. (2015) 'Identifying Granger causal
relationships between neural power dynamics and
variables of interest', NeuroImage, vol. 111, pp. 489-
504.
Characterisation of Resting Brain Network Topologies across the Human Lifespan with Magnetoencephalogram Recordings: A Phase Slope
Index and Granger Causality Comparison Study
125
