
Endogenous Fluorescence Analysis under Deep UV Excitation to
Discriminate Human Brain Tumor Tissue
Difference between Glioblastoma and Healthy Control Tissue
F. Poulon
1
, F. Jamme
2
, A. Ibrahim
1
, C. Métais
1
, P. Varlet
4,5
, M. Juchaux
1
, B. Devaux
3,5
,
M. Refregiers
2
and D. Abi Haidar
1,6
1
IMNC Laboratory, UMR 8165-CNRS/ IN2P3, Paris-Saclay University, 91405 Orsay, France
2
DISCO beamline, Synchrotron SOLEIL, Gif-sur-Yvette, France
3
Neurosurgery Department, Sainte-Anne Hospital, Paris, France
4
Neuropathology Department, Sainte-Anne Hospital, Paris, France
5
Paris Descartes University, Paris, France
6
Paris Diderot University, Sorbonne Paris Cité, F-75013, Paris, France
Keywords: Endomicroscopy, Brain Tumours, Deep UV, Synchrotron SOLEIL, Spectroscopy, Wide-field Imaging.
Abstract: In order to build a multimodal nonlinear endomicroscope to image brain border during operation, our group
is building an optical database on brain biopsy tissues analysis collected with excitation panning from deep
UV to near infrared. This paper focuses on the results from deep UV excitation of endogenous fluorescence
from glioblastoma and control human brain samples. The samples were imaged and spectrally analysed. The
excitation wavelengths were tuned from 275 nm to 340 nm. Two promising indicators to discriminate
tumorous tissue from the control were found. A preliminary correspondence between fluorescence images
and histological H&E staining open a huge door to confirm results with a medical expertise.
1 INTRODUCTION
Cancer is one of the major causes of death
worldwide, in 2012, there were 14 million new cases
and 8.2 million cancer-related deaths(“Cancer
Statistics,” n.d.). Brain tumour may only be the 17
th
most common cancer in the world, recent studies in
the US showed that it is one of the most dangerous
one, inducing the most important number of cancer
related death in the population aged between 15 to
39 years (“Brain Tumor Statistics | American Brain
Tumor Association,” n.d., “Worldwide data | World
Cancer Research Fund International,” n.d.).
Improving survival rate and recovery from such
tumours is a constant key challenge for the medical
community. One of the major issues to tackle in
brain surgery is the extent of resection. Indeed, most
of the brain tumours tend to infiltrate quickly the
surrounding healthy area, and if actual technologies,
such as scanner and IRM give a clear margin around
necrosis, they do not give any information on the
rate of infiltration from the surrounding. The
surgeons today follow the rule of maximum possible
resection; stopping before touching any vital
functional part of the brain(Sanai and Berger, 2008).
The aim of our project is to give new optical contrast
and information on the tissue during the operation in
order to identify this infiltrated region. To succeed in
such project we are building a new endomicroscopic
tool combining different imaging modalities to give
the more precise answer to the surgeon. In parallel to
the instrumental development, it was crucial to
discriminate tissue nature in order to confirm the
power of multimodal optical analysis. For that
purpose, we are creating a database of optical
signature from the different tumour tissue and their
corresponding control using different optical
contrast. This database will help to give a discrimi-
natory answer on the nature of the tissue and to
define different indicators. This database groups
different optical response: (i) fluorescence imaging,
(ii) spectroscopy, (iii) lifetime fluorescence analysis
and (iv) second harmonic generation imaging. These
data were acquired using an excitation ranging from
the deep UV to the near infrared.
In this article we will focus on the results from the
deep UV excitation of tissues. Under this excitation
window we were able to make full field imaging and
152
Poulon F., Jamme F., Ibrahim A., MÃl’tais C., Varlet P., Juchaux M., Devaux B., Refregiers M. and Abi Haidar D.
Endogenous Fluorescence Analysis under Deep UV Excitation to Discriminate Human Brain Tumor Tissue - Difference between Glioblastoma and Healthy Control Tissue.
DOI: 10.5220/0006103601520157
In Proceedings of the 5th International Conference on Photonics, Optics and Laser Technology (PHOTOPTICS 2017), pages 152-157
ISBN: 978-989-758-223-3
Copyright
c
2017 by SCITEPRESS – Science and Technology Publications, Lda. All rights reserved

precise spectral measurements. Emission-collection
matrixes of different endogenous molecules were
measured and analysed. Some molecules of interest
were spectrally followed using different excitation
wavelength. Fluorescence images were compared to
the hemotoxylin and eosin (H&E) staining standard
of the Sainte-Anne hospital. Interesting structures
were identified in optical images and matched finely
with anatomopathologist diagnostic indicator.
2 MATERIELS AND METHOD
2.1 Imaging and Spectroscopic
Measurements
The data have been acquired on the DISCO
beamline at the Synchrotron SOLEIL. Two
microscopic set-ups are available on the beamline
and were used in this study.
The samples are excited with the continuous
emittance from the DISCO beamline bending
magnet at 275nm and between 310 and 340 nm.
First the samples were analysed under a full-field
microscope (Zeiss Axio-observer Z-1) with a x40
glycerine immersion objective (Zeiss Ultrafluar, NA
0.6). Emitted fluorescence was collected via a PIXIS
1024 BUV camera (Princeton, USA) through four
bandpass filters: 307-323nm, 323-357nm, 408-
438nm and 435-455nm (Semrock), with an
integration time of 10s. This set-up is completely
controlled by an open source microscopy software
Micro-Manager (Edelstein et al., 2014). Spectral
measurements were recorded with an inverted
Olympus IX71 microscope stand with homemade
DUV lenses. Light detection was collected through a
DUV lens and an adjustable pinhole. Then, the
fluorescence emission spectrum was projected onto
a −70◦C peltier-cooled iDus CCD detector (Andor)
of 1024 × 256 pixels with a 26 × 26 μm pixel size
and a 26.6 × 6.7 mm detector size.(Jamme et al.,
2013)
2.2 Samples
A strong collaboration has been established with the
departments of anatomopathology and neurology of
the Saint-Anne Hospital (Paris, France). The result
of this collaboration was the access to a large cohort
of human biopsy samples. The protocol of experi-
mentation was approved by the Institutional Review
Board of Sainte Anne Hospital (Ref CPP S.C.3227).
For this specific study, ten samples have been
selected, five of them were from glioblastoma
tumour and the other five were control sample from
epileptic surgery. The DISCO beamline microscopic
set-up requiring 10 microns slices of each sample, a
very strict process was put in place. The biopsies
were fresh samples conserved at -80°C. A
specialized transport service (360°, France) brought
the selected cohort to the IMNC lab. Samples were
then conserved at -80°C. These samples were kept
under -20° freezer 24 hours before being cut with a
cryostat (Leica CM 1950). Then 10 microns from
samples were deposited on quartz coverslips. Serial
10 microns slices were cut for different colorations.
Once on the coverslips or glass slides the samples
were fixed at hundred percent alcohol solution. The
quartz coverslips were brought to the Synchrotron in
a box dedicated to microscopic slides transportation
2.3 Histological Staining
One of the slices was used to perform the gold
standard H&E staining. Staining protocol was
provided by Sainte-Anne hospital anatomopatho-
logical staff. The sample has to go through
hydratation, hematoxylin and Eosin coloration,
deshydratation and toluene fixation. The stained
samples were then imaged in a slide scanner. A
comparison between UV results and H&E staining
was possible and performed thanks to the expertize
of the Sainte-Anne anatomopathologists.
2.4 Data Analysis
Spectral data were acquired with the Labspec
software, on each image a square of 12 by 12 points
with 5 microns between each points was selected, a
spectrum was acquired for every point with a 10s
integration time. Preliminary treatments were
applied to suppress noise and detector dead pixel
using a Matlab script developed by the DISCO team.
The treated data are then fitted with a homemade
Matlab script. This script was already used and
published in the visible (Haidar et al., 2015) and
near infrared range and readapted here for the deep
UV spectral analysis. Four molecules fluorescence
emission were fitted: Tyrosine, tryptophan, collagen
and NADH. These molecules were chosen through a
complete review of the literature and the expertise of
the DISCO scientists (Croce and Bottiroli, 2014;
Jamme et al., 2013). The first three components
were fitted by a Gaussian curve, the NADH
component was fitted by an experimental curve
established during previous studies of the group
(Haidar et al., 2015).
Endogenous Fluorescence Analysis under Deep UV Excitation to Discriminate Human Brain Tumor Tissue - Difference between
Glioblastoma and Healthy Control Tissue
153
3 RESULTS
The deep UV excitation range excites four different
molecules: Tyrosine, Tryptophan, Collagen and the
NADH (Nicotinamide adenine dinucleotide) the
acquired emission spectra were fitted in regards of
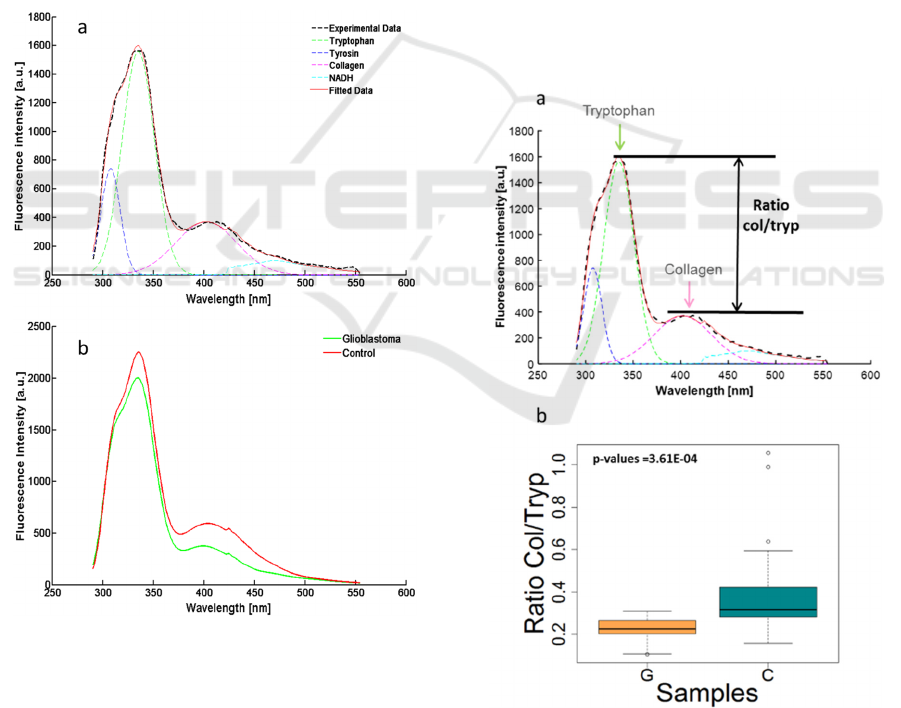
these four molecules. An example of a fitted
spectrum is given in the figure 1a. It shows that the
main contributing fluorescent molecule in the deep
UV range is the tryptophan, its response is two times
higher than the other identified molecules. The mean
of the fitted curve in each group (glioblastoma and
control) were calculated and plotted on the figure 1b,
in order to compare the two types of sample. The
first thing we observe is that the intensity is 20%
lower in Glioma tissue, this phenomenon seems to
be in adequacy with some of the literature (Butte et
al., 2005; Palmer et al., 2003).
Figure 1: (a) Example of experimental data fitted with our
homemade script. (b) Comparison of the mean spectra for
the two groups: Glioblastoma and Control samples.
In the figure1b, we can hint that the ratio
between tryptophan and collagen change with the
type of tissue. To precise the tryptophan-collagen
ratio, for each type of tissue, we measured it in all
the spectra recorded for the five samples. The results
were then presented in a boxplot using the software
R, the ratio was calculated from the max of emission
obtained in the Matlab fit and rearranged in boxplot,
see figure 2b. A significant difference appeared
between the mean of the two boxplots, to confirm
this hypothesis a Mann-Whitney analysis was
performed on the ratio data. The hypothesis of
identical groups, gave a p value of 3.6.10
-4
which is
lower than 5.10
-2
and rejected the hypothesis. This
statistical result gives more confidence to confirm
that the collagen-tryptophan ratio can discriminate
glioblastoma from control samples.
A spectral analysis was accomplished using
different excitation wavelengths. This study was
performed from 310 to 340 nm by step of 5 nm. We
could follow the behavior of different endogenous
molecules through the excitation and go further in
the exploration of the characteristics of the tissue.
From the spectra, we obtained a closer look to the
maximum emission of NADH component to look for
the most appropriate excitation wavelength. Results
are shown in Figure 3.
Figure 2: (a) Illustrate the chosen ratio for a statistical
analysis of the tissues. (b) Box plots of the ratio.
This graph shows that the NADH component
increases with the wavelength. This results is
PHOTOPTICS 2017 - 5th International Conference on Photonics, Optics and Laser Technology
154
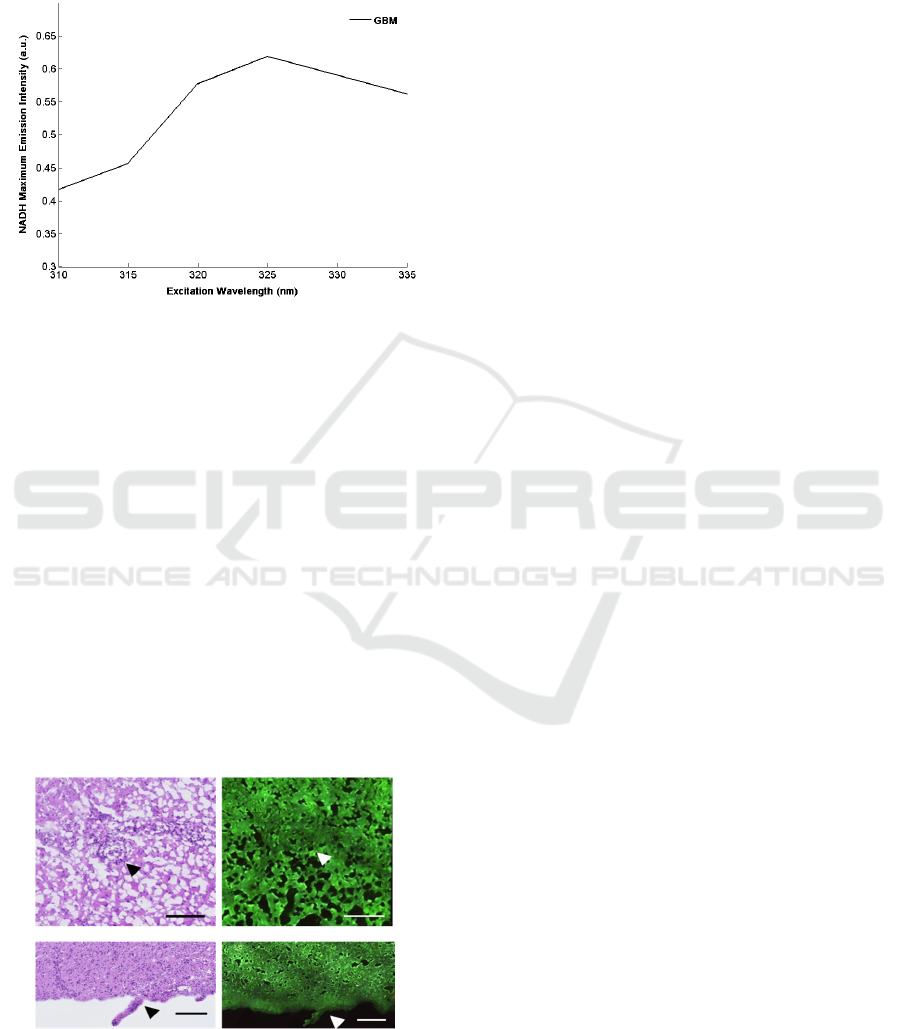
explained by an optimal excitation wavelength at
345nm(Jamme et al., 2013), nevertheless here in
tumorous tissue, the maximum of emission is at an
excitation at 325nm, this shift could be a new
indicator of change in cancerous cells.
Figure 3: Variation of NADH maximum emissions as a
function of the excitation wavelength.
Our collaboration with the Sainte-Anne hospital
gives us access to a histological analysis. The deep
UV wide-field images have been compared to the
H&E staining, figure 4. Deep UV fluorescence
images as presented in the figure 4 are the
combination of four channels: Tyrosine for red
channel, Tryptophan for Green channel, Collagen
for Blue channel and the NADH for yellow channel,
all combined with an identical coefficient. While
pointing out specific structures in each type of tissue
is difficult, we were still able to extract some
information; indeed the area showing high density of
cells on the H&E images appears darker on the deep
UV images. The tryptophan being the main
component (green images) these darker areas could
correspond to a loss of tryptophan, but also to an
increase of blue channel, corresponding to collagen.
Figure 4: Comparison between H&E staining images, (a,c)
and wide-field fluorescence (b,d) in control tissue (a,b)
and in glioblastoma (c,d). The scales are 250 (a), 200
(b,c), 100 nm (d).
4 DISCUSSION
This study was accomplished thanks to the
straightforward collaboration between physicist,
neurosurgeon and anatomopathologists team of
Sainte-Anne hospital and DISCO beamline Staff of
Synchrotron SOLEIL.
In this paper we performed a preliminary study
on two groups of biopsy samples: a healthy control
group and glioblastoma tissues. For this preliminary
study, we choose a tumorous group in an advanced
stage that shall present major differences compared
to the control. This choice shall allow us to find
indicators of discrimination more easily. Thereafter
we will be able to analyze infiltrated tissues, which
have a lower density of cancerous cells, with
analysis tools strengthened by this preliminary work.
Tissues were analyzed under deep UV excitation,
through imaging and spectroscopic techniques. Deep
UV is a well-known energy range to look at
endogenous fluorescence molecules of interest to
discriminate the nature of tissue. However, the
literature lack of analysis on human tissues and the
different types of tumor. It will be completed by an
analysis at visible and near-infrared excitation to
cover the whole spectrum and establish relationships
between the endogenous molecules.
In the paper we were able to highlight two
indicators that discriminate the nature of tissue: the
fluorescence intensity and the ratio collagen-
tryptophan.
The fluorescence intensity was already found
useful in our previous study on the grade of
meningioma in the visible and near infrared (Zanello
et al., 2016) and appears so as one of the promising
way to find an optical signature on tumorous brain
tissues. However, the spectral response is controlled
by numerous environmental and experimental
factors such as molecules concentration or laser
power, creating a huge experimental uncertainty and
needing as much parameters as possible into
consideration to make a realistic comparison
between signals intensities. In the literature a lot of
groups have already started to work with a spectral
response of endogenous fluorescence(Chorvatova
and Chorvat, 2014; Croce and Bottiroli, 2014),
looking for changes in the quantity of molecules
present between types of tissues. In this paper and
our future works we want to correlate the spectral
data to other modalities such as lifetime
measurement or second harmonic generation to
build a matrix of optical characteristics for each type
of tissue.
a
b
c
d
Endogenous Fluorescence Analysis under Deep UV Excitation to Discriminate Human Brain Tumor Tissue - Difference between
Glioblastoma and Healthy Control Tissue
155

The second indicator presented in this article is a
ratio on two major components of the tissue, the use
of a ratio eliminates all the previous bias enumerated
before and will bring more reliable results. Finding a
change in Tryptophan-Collagen ratio seems realistic
in tumorous tissues, knowing that tryptophan is
linked to vascular region and the tumorous tissue
present increased vascularity. Necrosis tissues in
glioblastoma are poor in collagen such as control
tissues and the change in tryptophan can be
highlighted through this ratio, however in other
tumorous tissues such as metastasis, a collagen
matrix spreads to organize cells migration inducing
both an increase of tryptophan and collagen,
therefore this ratio will not change as significantly as
in glioblastoma, giving false negative. It will be
interesting to look at other ratio and increase the
number of tumor types in the cohort.
The data showed that in this excitation range we
were able to fit the NADH component, this molecule
plays an essential role in metabolism, as a coenzyme
in redox reactions. And appears in the literature as a
major indicator in endogenous fluorescence. Its
behavior in tissues under visible and two photon
excitation has been well documented (Huang et al.,
2002; Skala et al., 2007). Articles looked at its cross
section over the excitation range or the redox ratio.
Knowing the role of this component we followed it
in deep UV, with a study over the excitation
wavelength from 310 to 340nm. The maximum in
excitation for the NADH in solution is at 345nm, so
we should get a curve increasing with the
wavelength. In our result we noticed a decrease at
340nm in the glioblastoma tissue. It could be either a
new indicator for cancerous tissue or just an
experimental artifact, due to the fact that this
measurement has been done on a very small number
of sample. Increasing the statistic of this analysis
could give significance to this result and highlight an
important phenomenon in tumorous metabolism.
Wide field images of endogenous fluorescence
allow us to correlate an area on each sample to the
H&E staining, the gold standard in histology to
validate the tumorous nature of a sample. This
correlation was possible thanks to the help of
anatomopathologists from Sainte-Anne hospital.
Correlation allowed us to demonstrate that high cells
density area in H&E images correspond to darker
area in wide-field images. Green channel in images
represent Tryptophan filter, these areas could
correspond to a loss of tryptophan or an increase if
the other channels, especially the collagen one.
Correlation with two-photon imaging could be an
interesting way to find more information.
All this promising resulfts encourage to increase
the cohort in order to have a better statistic on the
results.
ACKNOWLEDGEMENTS
This Work as a part of the MEVO and IMOP project
was supported by “Plan Cancer” program founded
by INSERM (France), by CNRS with “Défi
instrumental” grant, and the Institut National de
Physique Nucléaire et de Physique des Particules
(IN2P3).
We would like to thank Synchrotron SOLEIL for
beamtime under project #20160206. Thanks also to
PIMPA Platform partly funded by the French
program “Investissement d’Avenir” run by the
“Agence Nationale pour la Recherche” (grant
“Infrastructure d’avenir en Biologie Santé – ANR –
11-INBS-0006”).
REFERENCES
Brain Tumor Statistics | American Brain Tumor
Association [WWW Document], n.d. URL
http://www.abta.org/about-us/news/brain-tumor-
statistics/ (accessed 9.6.16).
Butte, P. V., Pikul, B. K., Hever, A., Yong, W. H., Black,
K. L., Marcu, L., 2005. J. Biomed. Opt. 10, 064026.
Cancer Statistics [WWW Document], n.d. Natl. Cancer
Inst. URL http://www.cancer.gov/about-cancer/under
standing/statistics (accessed 9.6.16).
Chorvatova, A., Chorvat, D., 2014. Tissue fluorophores
and their spectroscopic characteristics, in: Marcu, L.,
French, P., Elson, D. (Eds.), Fluorescence Lifetime
Spectroscopy and Imaging. CRC Press, pp. 47–84.
Croce, A. C., Bottiroli, G., 2014. Eur. J. Histochem. 58.
Edelstein, A. D., Tsuchida, M. A., Amodaj, N., Pinkard,
H., Vale, R. D., Stuurman, N., 2014. J. Biol. Methods
1, 10.
Haidar, D. A., Leh, B., Zanello, M., Siebert, R., 2015.
Biomed. Opt. Express 6, 1219–1233.
Huang, S., Heikal, A. A., Webb, W. W., 2002. Biophys. J.
82, 2811–2825.
Jamme, F., Kascakova, S., Villette, S., Allouche, F., Pallu,
S., Rouam, V., Réfrégiers, M., 2013. Biol. Cell 105,
277–288.
Palmer, G. M., Keely, P. J., Breslin, T. M., Ramanujam,
N., 2003. Photochem. Photobiol. 78, 462–469.
Sanai, N., Berger, M. S., 2008. Neurosurgery 62,753–766.
Skala, M. C., Riching, K. M., Gendron-Fitzpatrick, A.,
Eickhoff, J., Eliceiri, K. W., White, J. G., Ramanujam,
N., 2007. Proc. Natl. Acad. Sci. 104, 19494–19499.
Worldwide data | World Cancer Research Fund
International [WWW Document], n.d. URL
PHOTOPTICS 2017 - 5th International Conference on Photonics, Optics and Laser Technology
156

http://www.wcrf.org/int/cancer-facts-figures/world
wide-data (accessed 9.6.16).
Zanello, M., Poulon, F., Varlet, P., Chretien, F.,
Andreiuolo, F., Pages, M., Ibrahim, A., Pallud, J.,
Dezamis, E., Abi-Lahoud, G., Nataf, F., Turak, B.,
Devaux, B., Abi-Haidar, D., 2016. J. Biophotonics
n/a-n/a.
Endogenous Fluorescence Analysis under Deep UV Excitation to Discriminate Human Brain Tumor Tissue - Difference between
Glioblastoma and Healthy Control Tissue
157
