
Comparison of Wearable Optical See-through and Handheld Devices as
Platform for an Augmented Reality Museum Guide
Sule Serubugo, Denisa
ˇ
Skant
´
arov
´
a, Lasse Kjærsg
˚
ard Nielsen and Martin Kraus
Department of Architecture, Design, and Media Technology, Aalborg University,
Rendsburggade 14, 9000 Aalborg, Denmark
Keywords:
Augmented Reality, Museum Guide, Smartphones, Smart Glassess, Gamification, Interactive Storytelling.
Abstract:
Self-service guides are a common way of providing information about artworks exhibited in museums. Mod-
ern advances in handheld mobile applications and wearable optical see-through devices that use augmented
reality offer new ways of designing museum guides that are more engaging and interactive than traditional
self-service guides such as written descriptions or audio guides. In this study we compare wearable (smart
glasses) and handheld (smartphone) devices as a platform for an augmented reality museum guide. We have
developed a museum guide for both a smartphone and smart glasses that can identify artwork, direct the vis-
itors’ attention to specific details in it, as well as engage them through a game. The platforms are compared
based on participants’ preference feedback and game performance, and are also evaluated by a coordinator
from a collaborating museum. We conclude with a discussion of potentials of these platforms as augmented
reality museum guides and suggest promising future work.
1 INTRODUCTION
While written descriptions or audio guides are com-
mon ways of providing self-service guidance in mu-
seums, they are limited in the way information is pro-
vided. Audio guides, for instance, are limited to only
listening, and often, the viewer might not know which
part of the artwork the guide is referring to. There is
also often a lack of elements that would stimulate vis-
itors to interact with the artwork. Currently, a new
trend of smart devices has evolved that has the ca-
pability to promote active participation for visitors of
cultural heritage sites. Devices such as smartphones
or smart glasses allow visitors to get more involved
in the museum experience. Furthermore, recent de-
velopments in new media such as games, augmented
and virtual reality, and interactive storytelling, have
brought new effective ways of experimenting with im-
mersion in virtual storyworlds (Lombardo and Dami-
ano, 2012).
With these advances in both smart technologies
and immersive media, several researchers (Chang
et al., 2014; Tillon et al., 2010) have found new ways
of addressing limitations of traditional guides. By
using tablets and smartphones, their studies devel-
oped handheld augmented reality (AR) guides that
superimposed virtual descriptions and graphics on
artworks. Besides the handheld guides, there have
also been advances in wearable optical see-through
technology (smart glasses) which have introduced a
different approach towards overcoming these limita-
tions. Both smartphones and smart glasses have ad-
vanced functionalities such as camera, audio, image
display, and touch input, which allow for new exciting
ways of presenting cultural heritage narrative content
and making it interactive. These platforms have their
pros and cons. Handhelds are very accessible since
most people own a smartphone, while smart glasses
are hands-free. They both have the capability to be
used as self-service museum guides, however there
has not yet been a study that has compared them in
this context.
This work therefore aims to investigate this gap
and evaluates which of the guides is more intuitive
to use, provides better guidance and involves or en-
gages visitors more in the museum’s artworks. We
developed a museum guide for both platforms that can
direct visitors’ attention to where they should look
at in an artwork while a narrative is presented. Fur-
thermore, the guides also include a game where users
have to match clues shown on the device display to
that of the physical artwork. To compare the two
platforms, an experiment was set up, where partici-
pants evaluated the guides in questionnaires and semi-
Serubugo S., Å
˘
akantà ˛arovà ˛a D., KjÃ˛ersgÃ
ˇ
erd Nielsen L. and Kraus M.
Comparison of Wearable Optical See-through and Handheld Devices as Platform for an Augmented Reality Museum Guide.
DOI: 10.5220/0006093901790186
In Proceedings of the 12th International Joint Conference on Computer Vision, Imaging and Computer Graphics Theory and Applications (VISIGRAPP 2017), pages 179-186
ISBN: 978-989-758-224-0
Copyright
c
2017 by SCITEPRESS – Science and Technology Publications, Lda. All rights reserved
179

structured interviews. In addition, the participants’
game performance was logged to evaluate how in-
volved or motivated they were during the experience.
This paper presents the following main novelties
and contributions:
• A comparison of smartphone and smart glasses
as devices that can be used to develop AR self-
service museum guides.
• A discussion of how to develop AR museum
guides for smart glasses.
• A discussion of how to design and implement an
AR game that works on both handheld devices
and smart glasses.
The paper continues with an in-depth look at re-
lated work in Section 2. In Section 3, we describe how
the museum guides were implemented, and how they
were compared in an experiment. Results from the
experiment are presented in Section 4 and discussed
in Section 5. Lastly, we conclude on our findings in
Section 6.
2 RELATED WORK
AR displays can be categorized into different types,
which include head-mounted, handheld, and spatial
displays, etc. In their paper, Bimber and Raskar
(2006) state that the augmented image can be formed
at different places along the optical path between the
eyes and the physical object. For the smartphone,
the image is formed on a handheld display, while for
the smart glasses, it is generated on a wearable head-
mounted display. In both cases, the image is gener-
ated on a plane. To combine the augmented graphics
with the physical scene, the smartphone uses a tech-
nique called video-mixing, where a live video stream
of the physical scene is combined with the rendered
augmented graphics and this combination is displayed
on the screen. The smart glasses on the other hand
use a technique called optical combination, where the
augmented graphics are rendered and projected in the
viewer’s field of view, which makes the graphics ap-
pear as if they were in the physical scene. Both wear-
able optical see-through and handheld devices have
been used in various research projects in the cultural
heritage context.
Wearable optical see-through devices have been
researched by Dalens et al. (2014) and Baraldi et
al. (2015) who implemented computer vision meth-
ods on devices such as Google Glass to recognize
paintings in real time, and detect hand gestures which
visitors could use to naturally interact with the art-
work. These studies however did not test user ex-
perience. Bower and Sturman (2015) examined the
potential of wearable technologies, where they iden-
tified affordances such as experiencing various sce-
narios that otherwise would be risky or not possible
(e.g. a tour in a medieval village, zooming in), raising
involvement and engagement, communication, real-
time guidance, feedback, and gamification.
In parrellel, handheld AR guides have been ex-
plored by Damala et al. (2008), Chang et al. (2014),
and Tillon et al. (2010). Findings from these stud-
ies have shown that AR guides recieved positive
feedback and helped participants to better appreciate
paintings. A few participants in Chang et al.’s (2014)
study however found the tablet heavy and inconve-
nient. It could be investigated whether wearable op-
tical see-through devices can have an advantage since
they are hands-free.
Several of the presented works were concerned
with improving visitors’ experience in cultural her-
itage settings. In order to evaluate these improve-
ments, Othman et al. (2013) proposed a Multimedia
Guide Scale that can be used to evaluate guides in
terms of general usability, the quality of interaction,
and learnability & control. Othman et al. (2011) also
proposed a Museum Experience Scale for the purpose
of evaluating the experience, where the guide can be
evaluated through engagement, knowledge & learn-
ing, meaningful experience, and emotional connec-
tion. Although these scales were not tested on AR
guides, they can be used as inspiration when compar-
ing the handheld and wearable AR guides in terms of
enhancing the user experience.
Engagement and active participantion with the art-
works have been explored by Rubino et al. (2015) and
Schmalstieg and Wagner (2007) who have included
gamification in handheld AR guides. Through use
of storytelling adventure games and pervasive games,
their studies suggest that games are an engaging way
of bringing an active role to the visitors, and thereby,
increase their satisfaction during the museum expe-
rience. These studies indicate that games could also
be used to evaluate the effectiveness of the guide and
compare handheld AR guides with wearable optical
see-through AR guides. The work presented in this
paper took inspiration from several of the related stud-
ies and developed a museum guide that was used in an
architectural museum.
3 MATERIALS AND METHOD
To investigate the use of wearable optical see-through
and handheld AR museum guides for self-service
guidance, two conditions were designed: a handheld
GRAPP 2017 - International Conference on Computer Graphics Theory and Applications
180
AR guide condition and a wearable AR guide condi-
tion. The guides were evaluated in terms of the overall
museum experience they provide, visitors’ involve-
ment and engagement into the artworks, and their sat-
isfaction with the guidance. Our assumption was that
the handheld AR guide would be perceived as more
intuitive and easier to use. On the other hand, be-
cause the augmented graphics in the smart glasses are
directly in the viewers’ field of view and appear as if
they were in the physical scene, we assumed that the
wearable AR guide would provide a more engaging
experience and involve the visitor more with the art-
works.
A game was included to assess how easy visitors
would find it to interact with and explore the artwork.
Our assumption was that a high game performance
with a good score and a short completion time would
imply that the visitors were engaged and the guide
was intuitive to use and interact with, while low per-
formance or long completion time would imply low
engagement or less intuitive interaction.
3.1 AR Museum Guide Design
The design of both wearable and handheld AR guides
consisted of several parts: interactive storytelling and
gamification, tracking the artwork, and superimpos-
ing the graphics. Furthermore, two artwork collages
were used, which were part of the exhibition “Fata-
morgana: Utzon meets Jorn” at the Utzon Center mu-
seum in Aalborg, Denmark. The two collages can be
seen in Figure 1, where two men are surrounded by
their inspiration from each other’s field. Artist Asger
Jorn is on the left and as can be seen, images in his
collage are of architectural buildings. Architect Jørn
Utzon is on the right, surrounded by artistic images.
Figure 1: Asger Jorn collage (left) and Jørn Utzon collage
(right).
3.1.1 Interactive Digital Storytelling and
Gamification
The objective of the museum guide was to present in-
formation about Jørn Utzon, Asger Jorn, and their in-
spirations from art and architecture, which inspired
them to collaborate on designing Silkeborg Museum
for exhibiting Asger’s art. In the actual exhibition,
there was a big text panel describing the two men and
the images in the collages were given numbers. Vis-
itors could then read the description to get a general
understanding of each of the collages, as well as read
the names of the images based on their numbers in a
small text panel on the side of the collages. All infor-
mation was available in both Danish and English be-
cause the museum had both Danish and international
visitors.
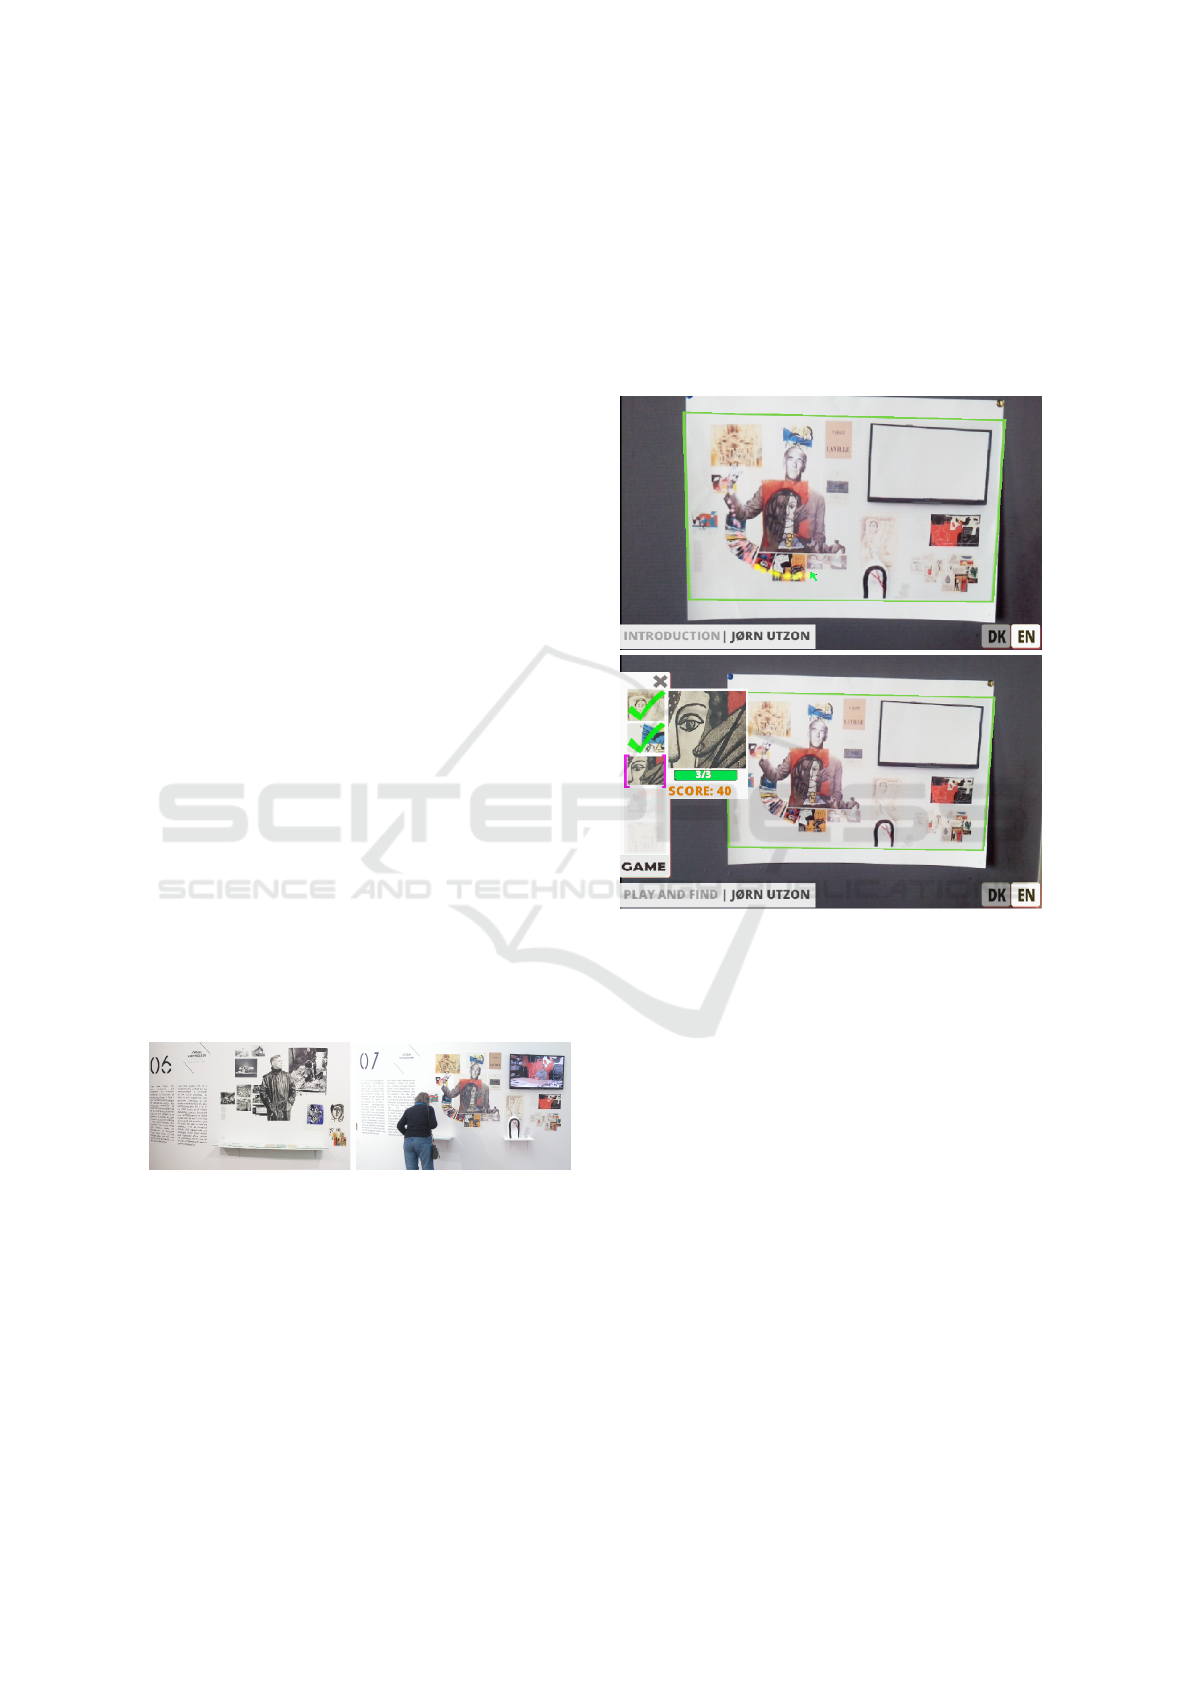
Figure 2: The introduction stage with the pointer directing
attention (top) and the game stage with clues in the game
panel (bottom).
Our guide system used this information and en-
hanced it by adding audio, visuals, and interaction. To
present the guidance, a narrative was created, which
consisted of three stages: introduction, exploration,
and game. The structure of the narrative was inspired
from the complete graph narrative structure, where
the visitor can access information and parts of the nar-
rative in any desired order (Ryan, 2001). Once the
visitors approached the collage, they could use the
device as a guide. They would start by selecting the
language to be used during the guidance and after-
wards, the introduction was played in form of audio
with a pointer to guide the visitors’ attention to the el-
ement being presented. The introduction covered the
description information from the big text panel, and
when it was finished, the guide proceeded to the sec-
ond stage – the exploration. Here the user could in-
teractively select images in the collage for more spe-
cific information that was inspired from the small text
panel. In the corner of the guide display, there was a
Comparison of Wearable Optical See-through and Handheld Devices as Platform for an Augmented Reality Museum Guide
181
“Game” button, which when clicked caused the user
to go to the third stage – the game, as seen in Figure 2.
The game involved matching the clues displayed
in the game panel to the images in the collage. These
clues were small images cut out from five of the col-
lage’s images, where the objective was to match the
clue and image correctly within three attempts. If the
visitor matched them correctly on the first attempt,
they would get 20 points, on the second attempt 13
points, and on the third attempt 7 points. Thus, if all
clues were matched correctly on the first attempt, the
visitor would get 100 points. Every clue had corre-
sponding audible information that related to the im-
ages in the collage and was inspired by the small text
panel. This information was played when the clue
was presented for matching. Audio feedback was
given when the visitor found a match or made a mis-
take. Upon completing the game, information that
was otherwise not displayed in the collages was nar-
rated to the visitor as a reward. For Asger Jorn, the
visitor would learn that he invented three-sided foot-
ball, and for Jørn Utzon, they were told that he wanted
to be a sculptor, but was convinced by his uncle to be-
come an architect.
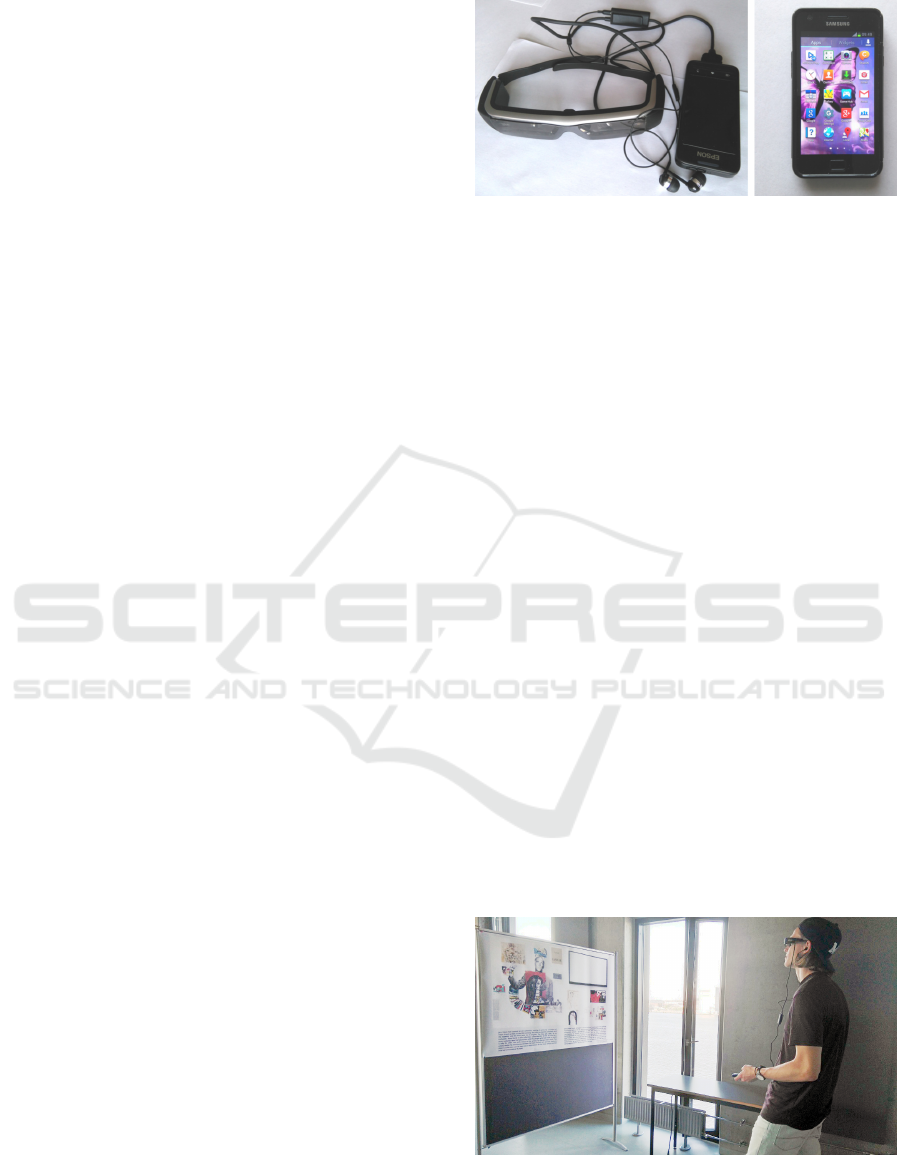
3.1.2 Augmented Reality Setup
The equipment (see Figure 3) used for the handheld
AR guide was a Samsung I9100 Galaxy SII with a
display size of 4.3 inches, screen resolution of 480 ×
800 pixels, an 8 megapixel camera, and a weight of
116 grams. For the wearable AR guide, a set of Ep-
son Moverio BT-200 smart glasses was used, which
had two LCDs, each with the size of 0.42 inches, a
screen resolution of 540 × 960 for each eye, a field of
view of 23 degrees, a VGA front camera, and a weight
of 88 grams. Users interacted with the smartphone via
touch directly on the display, while the smart glasses
had a touchpad connected. The interaction mecha-
nism for the touchpad was similar to that of the smart-
phone, however the display and the touchpad were
two separate units. Both devices ran on the Android
4 operating system, which allowed for the guide to
be developed as an application with the 32-bit Unity
5.3.1f1 game engine. Unity made it possible to build
the application on Android and also to use the Move-
rio SDK plugin for the smart glasses.
The Vuforia SDK v5.0.10 plugin for Unity was
used to track the collages. No additional fiducial
markers had to be set up in the exhibition because
the collages were used directly as tracking markers.
Tracking was possible by using the frontal camera on
the glasses and the back camera of the phone. When
the collages were not in the camera’s view, a message
“Lost picture...” would be displayed at the bottom of
Figure 3: Platforms for the AR guide: Epson Moverio BT-
200 smart glasses connected to the touchpad and Samsung
Galaxy I9100 SII.
the guide’s display. Once the camera was tracking one
of the collages, the application would play its content.
If tracking was lost again, the application would sim-
ply pause until tracking was resumed. To enable the
system to recognize the two collages, they were up-
loaded to Vuforia’s Target Manager, where features
were detected in the images and stored in a database.
Therefore, the guide was able to automatically iden-
tify the two physical collages via its camera, and su-
perimpose the augmented graphical content on them.
3.2 Experimental Procedure
To compare the smartphone and the smart glasses
AR guides, an experiment was designed as a within-
subjects experiment and conducted at Aalborg Uni-
versity, where the collages were exhibited to simulate
the museum setting as shown in Figure 4. 34 partic-
ipants, 20 males and 14 females, aged 21 - 28 (M =
23.35, SD = 1.86) were tested. All participants had
previous experience with touch mobile devices, while
none of them had experience with smart glasses. 47%
stated that they had used traditional museum guides
during their museum visits. 38% of the participants
had normal eye sight and did not use prescription
glasses or contact lenses.
Figure 4: Test setup.
Each test session started with a short demographic
questionnaire to learn about participants’ background
GRAPP 2017 - International Conference on Computer Graphics Theory and Applications
182

and their experience with museums. This was fol-
lowed by instructions on how to use one of the smart
AR guides, after which the participants used it to un-
derstand either Jørn Utzon’s or Asger Jorn’s collage,
as shown in Figure 4. They then got instructions for
the other guide before trying it on the second col-
lage. By pseudorandomizing the order in which par-
ticipants tried the smart AR guides and experienced
the collages, bias was prevented. The guidance pre-
sented in the device had three stages. An introduc-
tion that presented the collage. An exploration stage,
where participants exploratively interacted with the
separate images in the collage by clicking to hear
more information. After clicking on a minimum of
five images, they could move on to the game stage,
which consisted of matching clues displayed in the
guide’s graphical user interface to images in the col-
lage.
During the three stages, the guide logged data in
a file for assessment, which included how much time
each participant spent completing each of the three
stages, how many images they clicked in the explo-
ration stage, and their score from the game. After go-
ing through all stages for each smart AR guide, par-
ticipants filled out a questionnaire, where they evalu-
ated their experience with that guide on a seven-point
Likert scale. The topics of the evaluated questions
were inspired from the Multimedia Guide Scale and
the Museum Experience Scale proposed by Othman
et al. (2011; 2013), as is shown in Table 1. Lastly, a
short semi-structured interview was conducted to get
more insight in the participants’ experience.
Besides the experiment, the smart AR guides were
presented to the exhibition coordinators at the mu-
seum to get some insight into which smart AR guide
they felt worked well for the exhibits. Their feedback
was important to evaluate the guides in a practical set-
ting and assess whether this new technology could po-
tentially be used for their exhibition professionally.
4 RESULTS
4.1 Questionnaire
Ratings obtained from questionnaires were plotted in
boxplots shown in Figure 5, which also present the
means. These ratings were statistically analyzed us-
ing a two-tailed Wilcoxon signed-rank test, and corre-
lations between them were calculated using Pearson’s
product-moment correlation. In addition to responses
from the questionnaire, feedback was obtained from
semi-structured interviews. This was used to better
understand the results from the questionnaire. The
Table 1: Questionnaire to evaluate both smart glasses and
smartphone as museum guides (7 point scale: 1. Not at all,
7. Very much).
ENGAGEMENT
Q1: To what extent did the guide engage you to the
exhibit?
Q2: To what extent were you experiencing the ex-
hibit, rather than just visiting it?
Q3: To what extent did the guide connect you with
the exhibit?
GUIDANCE
Q4: To what extent did the guide direct your attention
where to look in the exhibit?
Q5: To what extent did the guide help you understand
the exhibit?
INTERACTION & INTUITIVENESS
Q6: How easy was the guide to use?
Q7: How easy was it to learn how to use the guide?
Q8: How intuitive was it to interact with the guide,
e.g. clicking buttons and clicking on images?
GAMIFICATION
Q9: To what extent did the game in the guide involve
you in the exhibit?
OVERALL SATISFACTION
Q10: To what extent were you overall satisfied with
the guidance the guide provided?
Q11: If the guide was available for your next museum
visit, to what extent would you like to use it?
Wilcoxon signed-rank test analysis of the ratings (see
Table 2) showed significant differences between the
smartphone and the smart glasses for how easy the
guides were to use (Q6: p = 0.0096) and how easy it
was to learn how to use the guides (Q7: p = 0.0090) in
favor of the smartphone guide. Similar results could
also be found in the interviews, where seven partic-
Figure 5: Smartphone and smart glasses ratings for Q1 to
Q11 (P = smartphone, G = smart glasses).
Comparison of Wearable Optical See-through and Handheld Devices as Platform for an Augmented Reality Museum Guide
183

ipants mentioned that the smartphone was easier to
use and focus on. Smart glasses, on the contrary, had
a higher rating in engagement (Q1: p = 0.072, Q3: p =
0.075), although no significant difference was found.
Table 2: Ratings from all participants compared in
Wilcoxon signed-rank test (* = p <0.05).
Smartphone Smart Glasses
Question M SD M SD p-value
Q1 4.74 1.16 5.27 1.19 0.072
Q2 4.61 1.39 4.94 1.37 0.31
Q3 4.74 1.56 5.24 1.37 0.075
Q4 4.88 1.53 4.41 1.76 0.18
Q5 4.97 1.09 5.09 1.22 0.57
Q6 5.71 1.36 4.65 1.63 0.0096∗
Q7 5.94 1.01 5.27 1.40 0.0090∗
Q8 5.65 1.32 5.27 1.76 0.13
Q9 4.77 1.42 4.62 1.65 0.76
Q10 4.85 1.33 4.71 1.62 0.58
Q11 4.24 1.81 4.50 2.14 0.59
During the experiment, it was observed that fe-
males and males had divided opinions about the two
smart AR guides, and therefore the statistical data was
split for genders. Results showed that females did not
find any of the guides significantly different from the
other. However, males reported differences on intu-
itiveness and found it significantly easier to learn how
to use the smartphone (Q7: p = 0.049). Males also felt
that the guide presented on the smart glasses engaged
them in the exhibit more than the smartphone (Q1: p
= 0.017, Q2: p = 0.022, Q3: p = 0.0064).
There was no significant difference between the
two smart AR guides in the ratings on guidance, gam-
ification, and overall satisfaction. Pearson’s product-
moment correlation, however, showed that the partic-
ipants’ ratings on whether they would use the guide
if available in the museum, had a high degree of cor-
relation with ratings on engagement (Q1: r = 0.61,
Q2: r = 0.63, Q3: r = 0.59), understanding (Q5: r
= 0.56), gamification (Q9: r = 0.52) and the overall
satisfaction with the guide (Q10: r = 0.75).
4.2 Performance and Time Data
Interaction, game score, and time data was analyzed
using a two-tailed two-sample t-test, and a Fisher’s
exact test was used to analyze how many clues par-
ticipants matched correctly in the game. As can be
seen in Figure 6, participants took longer time inter-
acting with the smart glasses than the smartphone.
They spent significantly longer time during the ex-
ploration stage (p = 0.00008) and during the overall
experience with the three stages (p = 0.00002). The
time spent for the game stage alone was, on the other
hand, not significantly different for the two guides (p
= 0.055), and the introduction stage was fixed and
took approximately 60 seconds for both. Similar to
the questionnaire, these significant time differences
also show that the smartphone was easier to use and
interact with. In the exploration stage (see Figure 7),
participants clicked ten images on average when us-
ing smart glasses, which was significantly more com-
pared to the smartphone where only six images were
clicked on average (p = 0.0002). This shows that
participants were more engaged when they used the
smart glasses to interact with the collage.
Figure 6: Time spent using the guides. Introduction stage
was fixed and took 60 seconds.
Figure 7: Images clicked in the exploration stage and scores
in the game.
During the game, participants scored 94.6 points
out of 100 on average when using the smartphone,
as shown in Figure 7. This was significantly higher
compared to the average of 85.6 points when using
the smart glasses (p = 0.0093). Participants using
the smartphone were also able to match significantly
more clues in the game correctly (smartphone M =
4.9, smart glasses M = 4.6, p = 0.044).
4.3 Semi-structured Interview
In the interviews, participants were asked to evaluate
which of the guides made the exhibition most fun. 26
participants said that it was the smart glasses, while
the remaining eight said it was the smartphone. The
Fisher’s exact test showed that significantly more par-
ticipants found the smart glasses more fun (p = 0.043).
Ten participants admitted that part of the appeal for
smart glasses was because they “are new” and that
they “have not tried them before”. On the other hand,
seven participants said that with the smart glasses,
they “felt more part of the exhibition” and “did not
have to look through a secondary screen”.
Despite being more engaging, the smart glasses
were however found to be “heavy” as mentioned
GRAPP 2017 - International Conference on Computer Graphics Theory and Applications
184

by seven participants. Six participants experienced
“dizziness”, “pain in the eyes” or “headache”, and
three participants felt that “it would be a problem to
wear them for a long exhibition”. Similarly, partici-
pants also experienced some challenges while using
the smartphone. Nine participants mentioned that it
was “tiring for arms to hold it up” in front of the exhi-
bition and five participants found the screen too small,
saying that “it was hard to see the images”. How-
ever, six participants mentioned that they could “see
the whole collage at once”, which allowed for bet-
ter overview. This also enabled them to better follow
and understand the guidance of the pointer than on the
smart glasses, where as mentioned by seven, “it was
easy to lose the pointer”.
In terms of which guide provided a better under-
standing of the exhibit, 11 participants said that it was
the smartphone, six said it was the smart glasses, and
12 felt that it was the same for both guides. Over-
all, several participants gave positive feedback to the
guides saying that “the glasses are very nice and en-
gaging” and “the smartphone gives a lot of freedom”.
4.4 Expert Feedback
The following section presents thoughts from one of
the exhibition coordinators at the collaborating mu-
seum.
A problem that he saw with the smart glasses was
that the field of view was very small to get an aug-
mented reality feeling. He mentioned that the inter-
action on the smartphone was better because you felt
that “the frame in the picture that you clicked on is
more like a button, while on the glasses the touchpad
felt more like an extraneous element”. He said that
the smart glasses could become something in the near
future, but currently he thought that “the technology is
not there yet”. He added that “everything works better
on the phone”, also because it is an element that peo-
ple can take with them. “There is something special
about it being your own guide. People can just get a
QR-code, scan it and get the app. It is cheap, easier
and you do not have to walk around, looking like a
sci-fi dude”.
Smart glasses felt like they were about to “fall
down”, which he thought will be challenging for
many people using them. He said that they have
something in terms of the experience and will be seen
more in the future, however he did not think they were
there yet. Ultimately, he felt that the smartphone has
the potential to cover part of the exhibition, however
the smart glasses only have the potential if they can
cover the whole exhibition. “With the smartphone,
you can come with it and use it on part of the exhibi-
tion, whereas the smart glasses will have to be placed
in front of the picture and people will have to put them
on and off during their visit”.
5 DISCUSSION
The experiment investigated the use of smartphones
and smart glasses as platforms for self-service mu-
seum guides. Five main topics were considered for
evaluation: engagement, guidance, interaction & in-
tuitiveness, gamification, and the overall satisfaction.
For the engagement, responses from participants of
the experiment showed that the smart glasses AR
guide was more engaging than the smartphone, and
participants were able to experience the exhibit, rather
than just visit it. However, the expert feedback from
the exhibition coordinator in the museum did not
seem to show the same results. He found the smart-
phone to be a better guide and felt that the technology
for smart glasses still needs to be developed before it
can be applied in the museum. This seems to show
that the context, in which the guides are considered,
matters. In their current state, he saw the smartphone
more applicable, accessible, and finished, but admit-
ted that the smart glasses could have potential in the
near future.
The smartphone was evaluated as better by partic-
ipants in the experiment in terms of guidance and in-
teraction & intuitiveness. This was less experienced
on the smart glasses, which could have been due to
the small field of view as was also mentioned by the
exhibition coordinator. Furthermore, the touchpad
of the smart glasses seemed more challenging and
slower than interaction through touch on the smart-
phone screen. Further research is therefore needed to
develop better interaction, for example, by use of nat-
ural hand gestures.
Gamification added to the two guides did not pro-
vide a significantly different experience, but engaged
participants in the exhibit. Several participants were
very excited to try it out and it showed to be a good
way of involving them into the exhibits. Rating on
the overall satisfaction with the guide did not show
any significant differences, and participants would
use both guides if they were available in the museum.
6 CONCLUSION
This work investigated use of smartphones and smart
glasses as a platform for delivering narrative con-
tent for an augmented reality museum guide. Results
showed that smart glasses can better engage visitors
Comparison of Wearable Optical See-through and Handheld Devices as Platform for an Augmented Reality Museum Guide
185

into the artwork compared to the smartphone. On the
other hand, the smartphone is easier and more intu-
itive to use while interacting with the artwork com-
pared to the smart glasses. Based on the interview
conducted with an exhibition coordinator, the smart-
phone from a practical point of view seems to be more
suitable as a platform for a self-service guide due to
its intuitiveness, availability, and its interaction mech-
anism. Nonetheless, findings from the study have also
shown potential for the smart glasses. Several partic-
ipants who tried them out liked the fact that they did
not have to hold them up or experience the exhibition
through a secondary screen as was mentioned for the
smartphone. However, the smart glasses need more
technological advances to make them more comfort-
able to use in the museum. These advances include
expanding the field of view, making the user interface
less straining for the eyes to look at, and making the
smart glasses more comfortable to wear.
Future studies should investigate which designs
and interactions would work well on the smartphone
and which would fit the see-through screen of the
smart glasses. This study has focused on artworks that
were two-dimensional such as collages and paintings.
However, further studies should also consider three-
dimensional artworks like sculptures and physical ar-
chitectural models, and research how to deliver nar-
rative content for such objects. Furthermore, future
work should also investigate new ways of introducing
gamification using such augmented reality guides and
how to target different visitor groups, since it was ob-
served that gamification can be an effective way of in-
volving visitors into the artwork. Lastly, the study has
shown that both smartphones and smart glasses have
their strengths and weaknesses, which when devel-
oped appropriately will potentially enhance the mu-
seum experience of visitors.
REFERENCES
Baraldi, L., Paci, F., Serra, G., Benini, L., and Cucchiara, R.
(2015). Gesture recognition using wearable vision sen-
sors to enhance visitors’ museum experiences. Sensors
Journal, IEEE, 15(5):2705–2714.
Bimber, O. and Raskar, R. (2006). Modern approaches to
augmented reality. In ACM SIGGRAPH 2006 Courses,
SIGGRAPH ’06, New York, NY, USA. ACM.
Bower, M. and Sturman, D. (2015). What are the educa-
tional affordances of wearable technologies? Computers
& Education, 88:343 – 353.
Chang, K.-E., Chang, C.-T., Hou, H.-T., Sung, Y.-T., Chao,
H.-L., and Lee, C.-M. (2014). Development and behav-
ioral pattern analysis of a mobile guide system with aug-
mented reality for painting appreciation instruction in an
art museum. Computers & Education, 71:185 – 197.
Dalens, T., Sivic, J., Laptev, I., and Campedel, M. (2014).
Painting recognition from wearable cameras. [Contract].
Damala, A., Cubaud, P., Bationo, A., Houlier, P., and Mar-
chal, I. (2008). Bridging the gap between the digital and
the physical: Design and evaluation of a mobile aug-
mented reality guide for the museum visit. In Proceed-
ings of the 3rd International Conference on Digital In-
teractive Media in Entertainment and Arts, DIMEA ’08,
pages 120–127, New York, NY, USA.
Lombardo, V. and Damiano, R. (2012). Storytelling on mo-
bile devices for cultural heritage. New Review of Hyper-
media and Multimedia, 18(1-2):11–35.
Othman, M. K., Petrie, H., and Power, C. (2011). Engag-
ing Visitors in Museums with Technology: Scales for
the Measurement of Visitor and Multimedia Guide Ex-
perience. In Human-Computer Interaction – INTERACT
2011: 13th IFIP TC 13 International Conference, Lis-
bon, Portugal, September 5-9, 2011, Proceedings, Part
IV, pages 92 – 99. Springer Berlin Heidelberg.
Othman, M. K., Petrie, H., and Power, C. (2013). Mea-
suring the usability of a smartphone delivered museum
guide. Procedia - Social and Behavioral Sciences,
97:629 – 637.
Rubino, I., Barberis, C., Xhembulla, J., and Malnati, G.
(2015). Integrating a location-based mobile game in the
museum visit: Evaluating visitors’ behaviour and learn-
ing. J. Comput. Cult. Herit., 8(3):15:1–15:18.
Ryan, M.-L. (2001). Narrative As Virtual Reality: Immer-
sion and Interactivity in Literature and Electronic Media.
Johns Hopkins University Press, Baltimore, MD, USA.
Schmalstieg, D. and Wagner, D. (2007). Experiences with
handheld augmented reality. In Mixed and Augmented
Reality, 2007. ISMAR 2007. 6th IEEE and ACM Interna-
tional Symposium on, pages 3–18.
Tillon, A., Marchand, E., Laneurit, J., Servant, F., Marchal,
I., and Houlier, P. (2010). A day at the museum: An aug-
mented fine-art exhibit. In Mixed and Augmented Real-
ity - Arts, Media, and Humanities (ISMAR-AMH), 2010
IEEE International Symposium On, pages 69–70.
GRAPP 2017 - International Conference on Computer Graphics Theory and Applications
186
