
Hellinger Kernel-based Distance and Local Image Region Descriptors for
Sky Region Detection from Fisheye Images
Y. El Merabet
1
, Y. Ruichek
2
, S. Ghaffarian
3
, Z. Samir
1
, T. Boujiha
1
, R. Touahni
1
, R. Messoussi
1
and A. Sbihi
4
1
Laboratoire LASTID, D
´
epartement de Physique, Facult
´
e des Sciences, Universit
´
e Ibn Tofail,
B.P 133, 14000, K
´
enitra, Morocco
2
Laboratoire IRTES-SeT, Universit
´
e de Technologie de Belfort-Montb
´
eliard,
13 rue Ernest Thierry-Mieg, 90010, Belfort, France
3
Faculty of Geo-Information Science and Earth Observation (ITC), University of Twente,
Enschede, 7500 AE, The Netherlands
4
Laboratoire LABTIC, ENSA, Universit
´
e Abdelmalek Essadi, Route Ziaten, km 10, BP 1818 Tanger, Morocco
Keywords:
GNSS, Region Classification, Image Segmentation, Fisheye, Color Invariance, Hellinger Kernel, Local Image
Region Descriptors.
Abstract:
Characterizing GNSS signals reception environment using fisheye camera oriented to the sky is one of the rel-
evant approaches which have been proposed to compensate the lack of performance of GNSS occurring when
operating in constrained environments (dense urbain areas). This solution consists, after classification of ac-
quired images into two regions (sky and not-sky), in identifying satellites as line-of-sight (LOS) satellites or
non-line-of-sight (NLOS) satellites by repositioning the satellites in the classified images. This paper proposes
a region-based image classification method through local image region descriptors and Hellinger kernel-based
distance. The objective is to try to improve results obtained previously by a state of the art method. The
proposed approach starts by simplifying the acquired image with a suitable couple of colorimetric invariant
and exponential transform. After that, a segmentation step is performed in order to extract from the simplified
image regions of interest using Statistical Region Merging method. The next step consists of characterizing
the obtained regions with local RGB color and a number of local color texture descriptors using image quan-
tization. Finally, the characterized regions are classified into sky and non sky regions by using supervised
M SR C (Maximal Similarity Based Region Classification) method through Hellinger kernel-based distance.
Extensive experiments have been performed to prove the effectiveness of the proposed approach.
1 INTRODUCTION
GNSS systems (Global Navigation Satellites Sys-
tems), such as COMPASS, GLONASS, GPS and Eu-
ropean GALILEO have the potential to advance the
development of intelligent transport systems (ITSs)
and associated services. They contribute widely to
localization and navigation systems and provide use-
ful information that can for example be exploited in
a meaningful way in the field of transport market
such as fleet management, monitoring of containers,
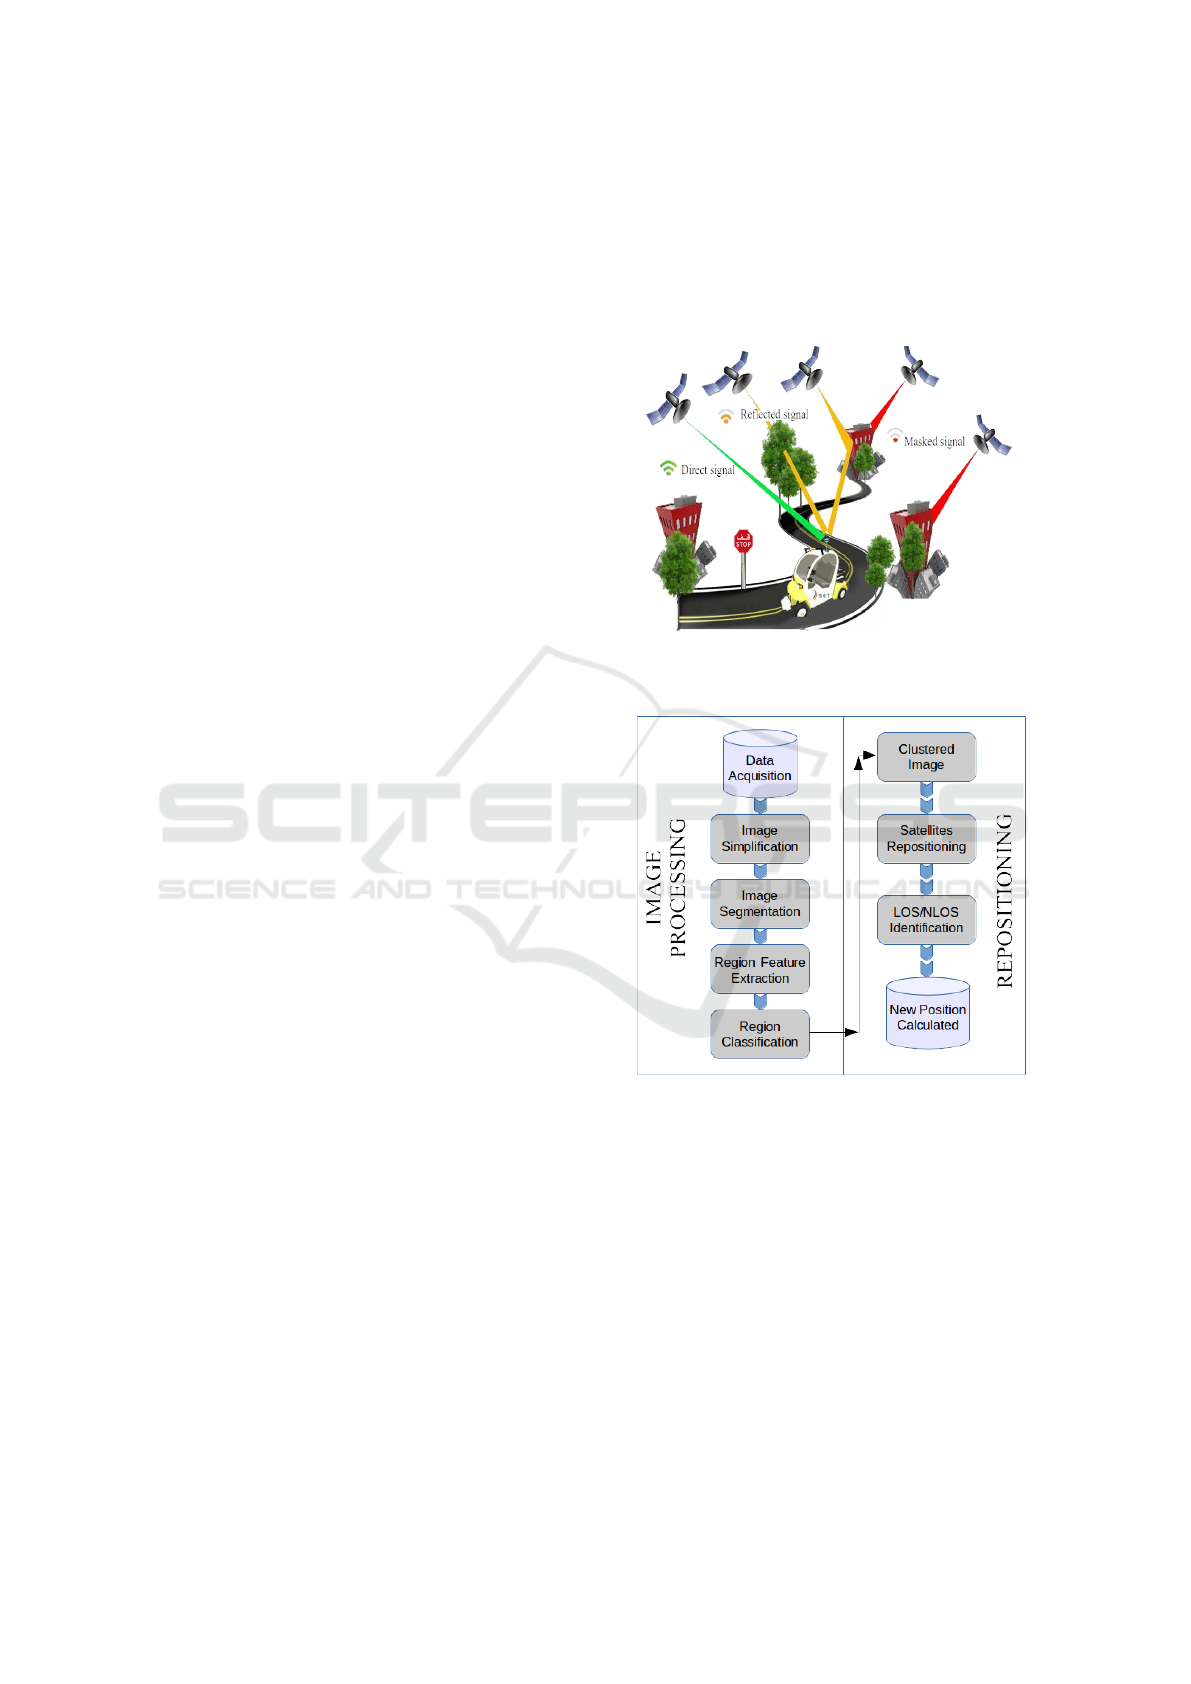
etc. One of the main drawbacks of GNSSs systems
in constrained environments such as urban zones is
that signals may arrive at the receiver antenna only in
non-line-of-sight (NLOS) conditions. Indeed, even if
most of them give satisfying accuracy in terms of po-
sition of localization, they cannot avoid propagation
problems caused by multi-path phenomena (cf. Fig-
ure 1) of GNSS signals. This can be explained by the
fact that in dense environments, like city centers, sig-
nals can be shadowed (signal received after reflections
without any direct ray), blocked (no signal received)
and directly received. Consequently, the evaluation
of estimated position reliability remains challenging
in presence of these constraints. For applications like
containers monitoring, flot management, etc., not re-
quiring high availability, integrity and accuracy of the
positioning system, this drawback is only a marginal
problem. But this constitutes a real challenge for spe-
cific applications dealing with liability issues (toll, in-
surance, etc.) as well as safety-related applications
(automatic guidance or control), requiring more strin-
gent performances. Several solutions have been pro-
posed in the literature in order to enhance localization
El Merabet Y., Ruichek Y., Ghaffarian S., Samir Z., Boujiha T., Touahni R., Messoussi R. and Sbihi A.
Hellinger Kernel-based Distance and Local Image Region Descriptors for Sky Region Detection from Fisheye Images.
DOI: 10.5220/0006092404190427
In Proceedings of the 12th International Joint Conference on Computer Vision, Imaging and Computer Graphics Theory and Applications (VISIGRAPP 2017), pages 419-427
ISBN: 978-989-758-225-7
Copyright
c
2017 by SCITEPRESS – Science and Technology Publications, Lda. All rights reserved
419
accuracy. One can cite those increasing the system
complexity like multi-sensor-based approaches that
consist to add other sensors (odometer, Inertial Mea-
surement Unit, etc.) to compensate the lack of per-
formance of GNSS (Wang and Gao, 2007; Lentmaier
et al., 2008). Using complementarity between local-
ization systems and computer vision to characterize
the environment of reception of satellites is another
workaround that is recently proposed (Marais et al.,
2013). The idea consists in analyzing the structure
of the environment traveled by a vehicle using a sin-
gle camera delivering visible range to overcome prob-
lems such as time computation, lack of precision of
3D models, etc. The approach relies, at each acqui-
sition of a fisheye image using a wide-angle camera
(fisheye camera with a large field of view of 180
◦
)
mounted near to a GPS receiver on the roof of the ve-
hicle and oriented to the sky, on sequentially applying
of two major steps: 1/ image processing and 2/ repo-
sitioning. The objective of the first step is to automat-
ically detect sky region from the acquired image. For
that, a geodesic reconstruction based technique with
an optimal contrast parameter is used in order to sim-
plify the fisheye image. Then, the pixels of the ob-
tained simplified image are classified into two classes
(sky and not-sky) using image clustering. A set of
unsupervised (Km local, Fuzzy Cmeans, Fisher and
Statistical region Merging) and supervised (Bayes, K-
Nearest Neighbor and Support Vector Machine) clus-
tering algorithms have been tested and compared. In
the second step, the satellites are repositioned in clas-
sified image to identify GNSS signals with direct path
(resp. blocked/reflected signals) i.e. located in sky re-
gion of the image (resp. located in not-sky region).
More details of this repositioning step can be found
in (Marais et al., 2013). Obviously, the reliability of
the proposed procedure depends greatly on the results
of image processing step, i.e. the classification re-
sults. In this paper, our challenge consists in mak-
ing this step more effective in terms of image classi-
fication results. Figure 2 illustrates the flowshart of
the image processing-based method for localization.
The method is composed of two major steps : image
processing and localization. Our contribution is con-
cerned with the image processing part. The method
we propose is composed of several substeps: 1/ im-
age simplification, 2/ image segmentation, 3/ region
features extraction and 4/ region classification.
The paper is organized as follows: Section II
presents the fisheye image simplification step of the
proposed procedure. Section III introduces briefly
the Statistical Region Merging algorithm used to ob-
tain the preliminary fisheye image segmentation. In
section IV, we introduce the implemented local color
RGB, color local texture and color hybrid histograms
as local image region descriptors. Section V presents
the proposed M S R C algorithm. Experimental re-
sults and a comparison with the method of (Marais
et al., 2013) are shown in Section VI. Conclusions are
derived in Section VII.
Figure 1: Illustration of the multipath phenomenon in urban
areas.
Figure 2: Flowshart of the image processing-based method
for localization.
2 FISHEYE IMAGE
SIMPLIFICATION
Image simplification is a very important basic ingre-
dient of a lot of practical image-based applications.
This useful basic pre-processing step permits to re-
duce content information of an image by suppressing
undesired details such as noise. In this work, in order
to simplify the acquired fisheye image, we opted to
use color invariance and exponential transform. The
sequential use of these two tools permits us to consid-
VISAPP 2017 - International Conference on Computer Vision Theory and Applications
420

erably reduce the over-segmentation problem and to
reach a more precise segmentation that is faithful to
the desired real objects.
2.1 Color Invariance
In mobility with a mobile platform, as is the case of
our application, several factors such as the surface
reflectance, illuminant color, lighting geometry, re-
sponse of the sensor, etc. (see Figure 4), may af-
fect the quality of the acquired images. Consequently,
attempting to segment the acquired image without
any pre-processing step, leads to a strongly over-
segmented image caused by insignificant structures or
noise. To overcome this shortcoming and therefore to
achieve satisfactory segmentation results (extract sky
regions with high accuracy), the trend towards obtain-
ing invariant signatures seems to be the best way for-
ward (El merabet et al., 2011; El merabet et al., 2014;
El merabet et al., 2015). Indeed, we propose to trans-
form the input fisheye image using a colorimetric in-
variant in order to obtain a color-invariant fisheye im-
age whatever the illumination conditions and artifacts
present in the acquired images (noise and unimportant
fine-scale details). In this work, we have used Affine
Normalization (AN) expressed below (Fusiello et al.,
1999). As it will be shown in section 6.2, tests have
validated the interest in using this colorimetric invari-
ant in the simplification process.
f
R
(p) =
I
R
(p)−µ(I
R
(p))
std(I
R
(p))
f
G
(p) =
I
G
(p)−µ(I
G
(p))
std(I
G
(p))
f
B
(p) =
I
B
(p)−µ(I
B
(p))
std(I
B
(p))
(1)
where I
K
(p) is the pixel value at position p in
the color component K={R, G, B}, µ(I
K
(p)) and
std(I
K
(p)) are, respectively, the mean value and stan-
dard deviation calculated in a window of interest W
centered on the pixel p. This normalization ensures
the invariance under affine changes of illumination
that is achieved by independently normalizing each
channel to have zero mean and unit variance.
2.2 Exponential Transform (ET)
Besides obtaining invariant signatures, image en-
hancement is another effective technique allowing to
improve the robustness of image simplification pro-
cess. The principal objective of this second compo-
nent of image simplification module is to modify at-
tributes of an image to make it more suitable for the
considered application. In this paper, in order to effi-
ciently improve segmentation quality results of fish-
eye images, we have opted to use the exponential
transform (ET). ET permits to approximate the expo-
nential correction factor of grayscale images which
maximizes the contrast of the images in the class of
exponential intensity mapping functions. Mathemati-
cally, ET is given by (cf. Eq. 2):
I
0
i j
= exp(χ/ξ) − 1 + I
0
min
χ = I
i j
− I
min
ξ = (I
max
− I
min
)/(log(I
0
max
− I
0
min
+ 1))
(2)
where I
i j
is the intensity of the pixel at position
(i, j), I
max
and I
min
are the highest and lowest inten-
sities of the image I, respectively and ξ is a normal-
ization factor for stretching output values between the
new lowest I
0
min
and highest I
0
max
intensities of the re-
sultant image I
0
.
3 PRELIMINARY FISHEYE
IMAGE SEGMENTATION
As indicated previously, the second step of our ap-
proach relies on image segmentation in order to seg-
ment the simplified images into homogeneous regions
with the same properties. Obviously, the quality
of the classification results which are the output of
the proposed region based classification procedure is
strongly dependent on the segmentation results. In
this paper, in order to obtain a preliminary fisheye
image segmentation, we have used SRM (Statisti-
cal Region Merging) algorithm (Nock and Nielsen,
2004) that seems to be more adapted when consid-
ering the objectives of our application. Indeed, using
this method, we can correctly extracts all significant
regions where the boundaries hypothesized coincide
with the significant segment boundaries in the simpli-
fied fisheye images. SRM algorithm presents several
advantages : 1/ it dispenses dynamical maintenance of
region adjacency graph (RAG); 2/ it allows defining
a hierarchy of partitions; 3/ it runs in linear-time by
using bucket sorting algorithm while transversing the
RAG and 4/ it not only considers spectral, shape and
scale information, but also has the ability to cope with
significant noise corruption and handle occlusions.
4 REGION FEATURES
This stage of our approach consists in characterizing
the segmented regions, obtained by using SRM algo-
rithm, with suitable descriptors to identify the regions
corresponding to the sky in fisheye images. The ex-
traction of these descriptors, used as inputs to the pro-
posed region based image classification, permits to
Hellinger Kernel-based Distance and Local Image Region Descriptors for Sky Region Detection from Fisheye Images
421
provide a global representation of a region that is a
higher level than that of the raw image pixels allow-
ing thus, to discriminate robustly between the differ-
ent regions in the treated images. The descriptors we
have choosen for the tests are explained below.
4.1 Local Color RGB Histograms
In spite of the fact that RGB color histogram is very
simple, easiest feature to implement and low level
method, it still being relevant for color based image
classification. In the present study, RGB color his-
togram is implemented as follows: each RGB color
channel is first uniformly quantized into l levels, af-
ter that, the color histogram of each segmented re-
gion is produced in the feature space of z = l × l × l
bins. Let I be an image containing N pixels quantized
in z=16×16×16=4096 color bins, the RGB color his-
togram of a segmented region R is represented as
H
RGB
(R ) = [H
1
R
,H
2
R
,...., H
z
R
] (3)
where
H
i
R
=
p
(
∑
N
j=1
p
i| j
τ
);j ∈ R and 0 6 i 6 z. (4)
H
i
R
is the ith normalized histogram bin and
τ=card(R ) is the number of pixels in the region R .
p
i| j
is the conditional probability of the selected jth
pixel belonging to the ith color bin. It is expressed as
follows:
p
i| j
=
1,if the jth pixel is quantized into the ith color bin
0,otherwise.
(5)
4.2 Color Local Texture Histograms
Texture analysis plays an important role in many dis-
ciplines and related applications: defect detection
and food inspection, surface grading, computer as-
sisted diagnosis, remote sensing, etc. (Dornaika et al.,
2016), due to its potential in extracting prominent fea-
tures with very high discriminating power.
It ressorts from the literature that the most pro-
posed texture descriptors are developed for gray level
images. Exploiting color aspects of textured images,
which is one of the objectives of this work, has un-
fortunately received much less attention (Chao et al.,
2013; Choi et al., 2012). Generally, the choice of suit-
able texture descriptor is closely related to the partic-
ularities of objects to be extracted from the image. In
this work, we propose to investigate the impact of sev-
eral well-known texture descriptors on the outcome
of the proposed region based fisheye image classifica-
tion. A set of 10 texture features calculated for each
region of the segmented fisheye image are used and
tested (cf. Table 1). In order to incorporate color in-
formation, these texture descriptors are extended to
RGB color space producing thus 10 color local tex-
ture histograms (H
LBP
, H
CSLBP
, H
LDP
, H
ILT P
, etc.).
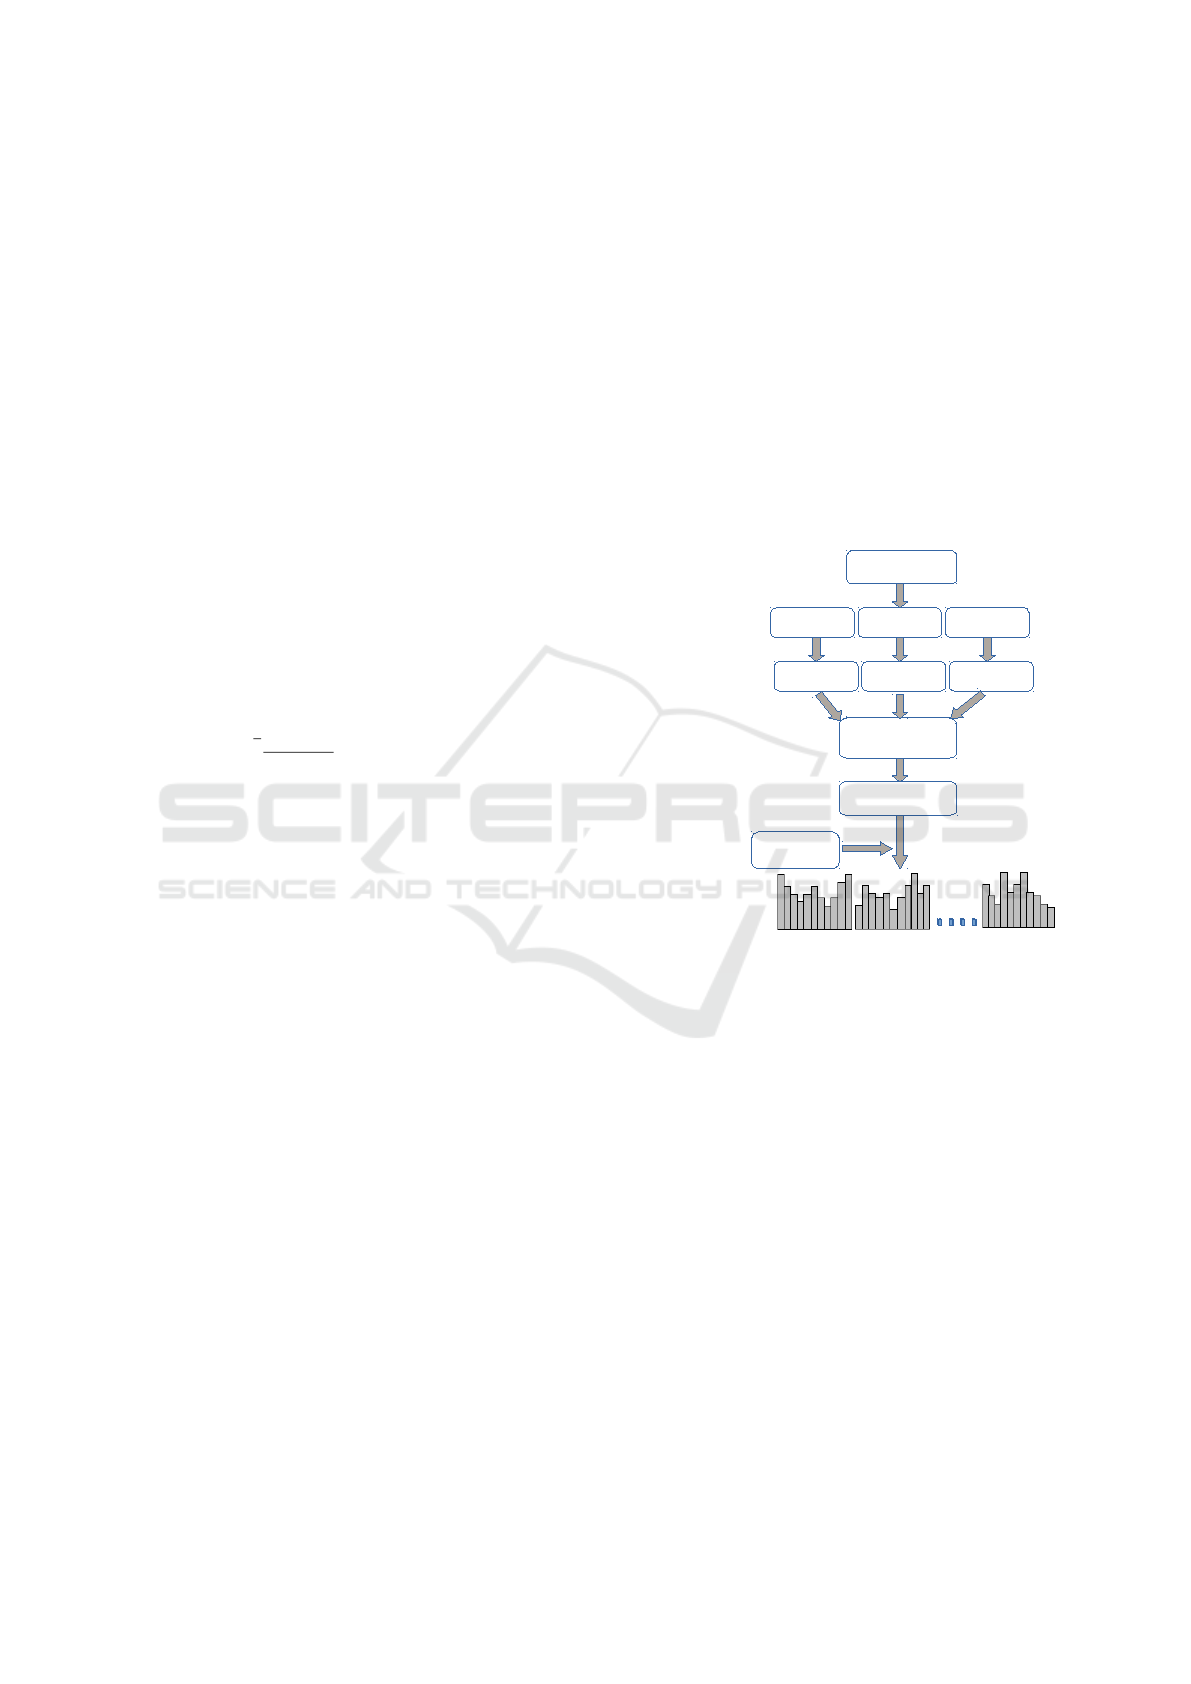
The method consists in calculating the unichrome tex-
ture feature independently over different channels in
RGB color space, concatenate them to get a descrip-
tor color image (for example the LBP color image in
Figure 3) and then the color local texture histogram
is calculated for each region of the segmented image
by following the same steps as for RGB color his-
tograms, as shown in Figure 3.
Original Image
Channel B
LBP color
Image
Image
Quantization
LBP descriptor
over each channel
Channel
extraction
Final color LBP
histograms over each
segmented region
(R
1
, R
2
.....R
N
)
LBP descriptors
concatenation
Channel GChannel R
LBP R LBP G
LBP B
R
1
R
2
R
N
Segmented
image
Figure 3: Calculation of color LBP histogram over each
region of the segmented image.
4.3 Local Hybrid Histograms
In order to build local hybrid histograms, we pro-
pose to concatenate the feature vectors provided by
different descriptors. Given two local color his-
tograms H (R ) = [H
1
R
, H
2
R
,...., H
z
R
] and H
0
(R ) =
[H
1
0
R
,H
2
0
R
,...., H
z
0
R
] of a region R , the corresponding
local hybrid color histogram is mathematically repre-
sented as:
H
hyb
(R ) =[H
R
H
0
R
]
=[H
1
R
,H
2
R
,.., H
z
R
,H
1
0
R
,H
2
0
R
,.., H
z
0
R
]
(6)
where H
i
R
is the ith histogram bins and the dimen-
sion of the obtained H
hyb
(R ) will be (2 × z) sized;
z=16
3
=4096.
VISAPP 2017 - International Conference on Computer Vision Theory and Applications
422

Table 1: Texture descriptors extracted and used in this work.
Descriptors Acronym Ref.
Local binary patterns LBP (Ojala et al., 1996)
Orthogonal combination of local binary pattern OCLBP (Chao et al., 2013)
Local quinary patterns LQP (Nanni et al., 2010b)
Local ternary patterns LTP (Tan and Triggs, 2007)
Improved local ternary patterns ILTP (Nanni et al., 2010a)
Center-symmetric local binary patterns CS-LBP (Heikkil
¨
a et al., 2006)
3D Local binary patterns 3DLBP (Huang et al., 2006)
Local derivative pattern LDP (Zhang et al., 2010)
Local phase quantization LPQ (Ojansivu et al., 2008)
Sum and difference histograms SDH (Unser, 1986)
In the present work, each one of the proposed
color local texture histograms is concatenated with
the color RGB histogram leading to 10 hybrid color
texture histograms (H
RGB
LBP
, H
RGB
ILT P
, H
RGB
OCLBP
, H
RGB
LPQ
,
etc.). While this can enrich the discrimination capac-
ity of the resulting descriptor, it has the disadvantage
that the dimensionality of the resulting feature vector
could be very high, increasing thus the computation
time.
5 MAXIMAL SIMILARITY
BASED REGION
CLASSIFICATION
Since the segmented regions M
SRM
, obtained via
SRM algorithm, are now characterized with the de-
scriptors introduced previously, our challenge is to
classify them into sky and non-sky regions. For this
purpose, we need to calculate similarity between the
characterized regions (R ∈ M
SRM
) and those of two
learning databases B
obj
and B
back
that are constructed
respectively with m distinctive textures of sky regions
and n distinctive textures of non-sky regions such
as building, road, tree, etc. We have then to define
a similarity measure Ψ(R ,Q ) allowing to calculate
similarity between two regions R and Q basing on
their descriptors. Given two image region features
f
1
and f
2
, Ψ( f
1
, f
2
) considers these image region
features as points in the vector space and calculate
close degree of two points. There are several well-
known goodness-of-fit statistical metrics in the litera-
ture. One can cite second type distance (Stricker and
Orengo, 1995), log-likelihood ratio statistic (Fuku-
naga, 1990), Minkowski measure, histogram intersec-
tion method (Swain and Ballard, 2002), Hellinger dis-
tance (Kailath, 1967; Ninga et al., 2010), etc. Let H
i
R
be the normalized histogram of a region R , the super-
script i represents its i
th
element. z = l × l × l = 4096
represents the feature space. In this study, we have
used Hellinger kernel (also known as Bhattacharyya
coefficient given by Eq. 7), which represents the co-
sine of angle between the unit vectors representing the
two regions to be compared:
(
q
H
1
R
,........,
q
H
z
R
)
T
and
(
q
H
1
Q
,........,
q
H
z
Q
)
T
The higher the Hellinger distance Ψ(R ,Q ) be-
tween regions R and Q is, the higher the similarity
between them is. That is to say that the angle be-
tween the two histogram vectors is very small involv-
ing that their histograms are very similar. Certainly,
two similar histograms do not necessarily involve that
the two corresponding regions are perceptually simi-
lar. Nevertheless, coupled with the proposed M SR C
algorithm summarized in algorithm 1, Hellinger ker-
nel based similarity works well in the proposed ap-
proach.
Ψ(R ,Q ) =
z
∑
i=1
q
H
i
R
.H
i
Q
(7)
In our implementation, the main assumption of the
proposed M SR C algorithm is that it assigns an un-
known region R to a class C
n
, if the average of the K
first high similarity measures calculated between the
region R and the regions of the learning database cor-
responding to the class C
n
is maximal, i.e,
C
∗
(R ) = argmax
C
n
∈C
1
K
K
∑
i=1
Ψ(R ,Q
i
), Q
i
∈ B
n
(8)
where B
1
,B
2
,..., B
j
are the learning databases corre-
sponding to the classes C
1
,C
2
,...,C
j
, R is a query,
and Ψ is the similarity measure.
6 RESULTS AND DISCUSSION
To evaluate and shown the effectiveness of the pro-
posed M SR C method, the RGB color and the pro-
Hellinger Kernel-based Distance and Local Image Region Descriptors for Sky Region Detection from Fisheye Images
423

Algorithm 1: Maximal similarity based region classification.
Require: I ← The set M
SRM
of segmented regions (after simplification of the input image using AN/ET conjointly).
B
obj
← learning database of sky regions.
B
back
← learning database of non sky regions (building, road, tree, etc.).
1: Calculate the local image region descriptor for all regions of M
SRM
and for those composing B
obj
and B
back
.
2: for each candidate region R ∈ M
SRM
do
3: Calculate V
R
ob j
= {Ψ(R , Q
i
);(Q
i
)
i=1..m
∈ B
obj
}, the similarity vector between R and B
obj
. Ψ(R , Q
i
) is the similarity
between R and the region Q
i
∈ B
obj
.
4: Calculate V
R
back
= {Ψ(R , Q
j
);(Q
j
)
j=1..n
∈ B
back
}, the similarity vector between R and B
back
. Ψ(R , Q
j
) is the
similarity between R and the region Q
j
∈ B
back
.
5: Get the order of V
R
ob j
and V
R
back
by decreasing sorting;
6: Calculate µ
R
ob j
=
∑
K
i=1
Ψ(R ,Q
i
)
K
, K ≤ m, the mean of the K first elements of V
R
ob j
.
7: Calculate µ
R
back
=
∑
K
j=1
Ψ(R ,Q
j
)
K
, K ≤ n, the mean of the K first elements of V
R
back
.
8: if (µ
R
ob j
≥ µ
R
back
) then
9: The region R has the maximal similarity with B
obj
, it is then classified as a part of sky regions.
10: else
11: The region R has the maximal similarity with B
back
, it is then classified as a part of background.
12: end if
13: end for
14: return The final segmentation map.
posed groups of color local texture and local hybrid
image region descriptors for classification of regions
extracted from fisheye images into two class (sky or
non sky regions), several tests were carried out. As
pointed out in the introduction, the main objective of
this work consists in improving the results presented
in (Marais et al., 2013). For that, a comparison step
was also performed to show the improvement that our
method provides.
6.1 Dataset
The image database acquired in the framework of
the CAPLOC project (Marais et al., 2013), was
used to validate the proposed sky detection approach
from fisheye images. It has heterogeneous data and
varying complex scenarios (overexposure, brightness
changes, vegetation abundance, urban canyon, etc.).
The image database contains 150 fisheye images ex-
hibiting the mentioned various complex situations.
Figure 4 Illustrates Six images of the database.
Figure 4: Six images of the database (acquired in the frame-
work of the CAPLOC project).
6.2 Impact of the Couple AN/ET
As indicated in Section 2, the acquired fisheye image
is firstly simplified using the couple of AN/ET where
the objective is to limit illumination changes and thus
reduce over-segmentation problem.
Table 2 highlights the ability of the couple AN/ET
to reduce the number of segmented regions. It appears
from this Table that when using Affine Normalization
and the Exponential Transform conjointly, the num-
ber of regions is considerably reduced. Indeed, the
use of this couple leads to a number of segmented re-
gions greatly reduced (in average 10.43 regions per
image) in comparison with that obtained without any
simplification step. The reduction rate is 73.46%,
i.e. the couple of AN/ET permits to eliminate (38.08-
10.43)*150 images=4147.5 undesirable regions. In
addition, the couple AN/ET provides good classifica-
tion results where the produced classified images are
most close to the corresponding ground truth (judged
by the evaluation results given in Table 2). Indeed, the
couple AN/ET allows obtaining 99.17% as a value for
accuracy measure Vs 98.98% Vs 99.02% Vs 99.00%
using AN without ET, RGB/ET and RGB without ET
respectively.
6.3 M SR C and Descriptors
Performance
In this section, we study the ability of the proposed
M S R C method and the proposed groups of local im-
age region descriptors to classify all regions of the
segmented image into sky and non sky class.
VISAPP 2017 - International Conference on Computer Vision Theory and Applications
424
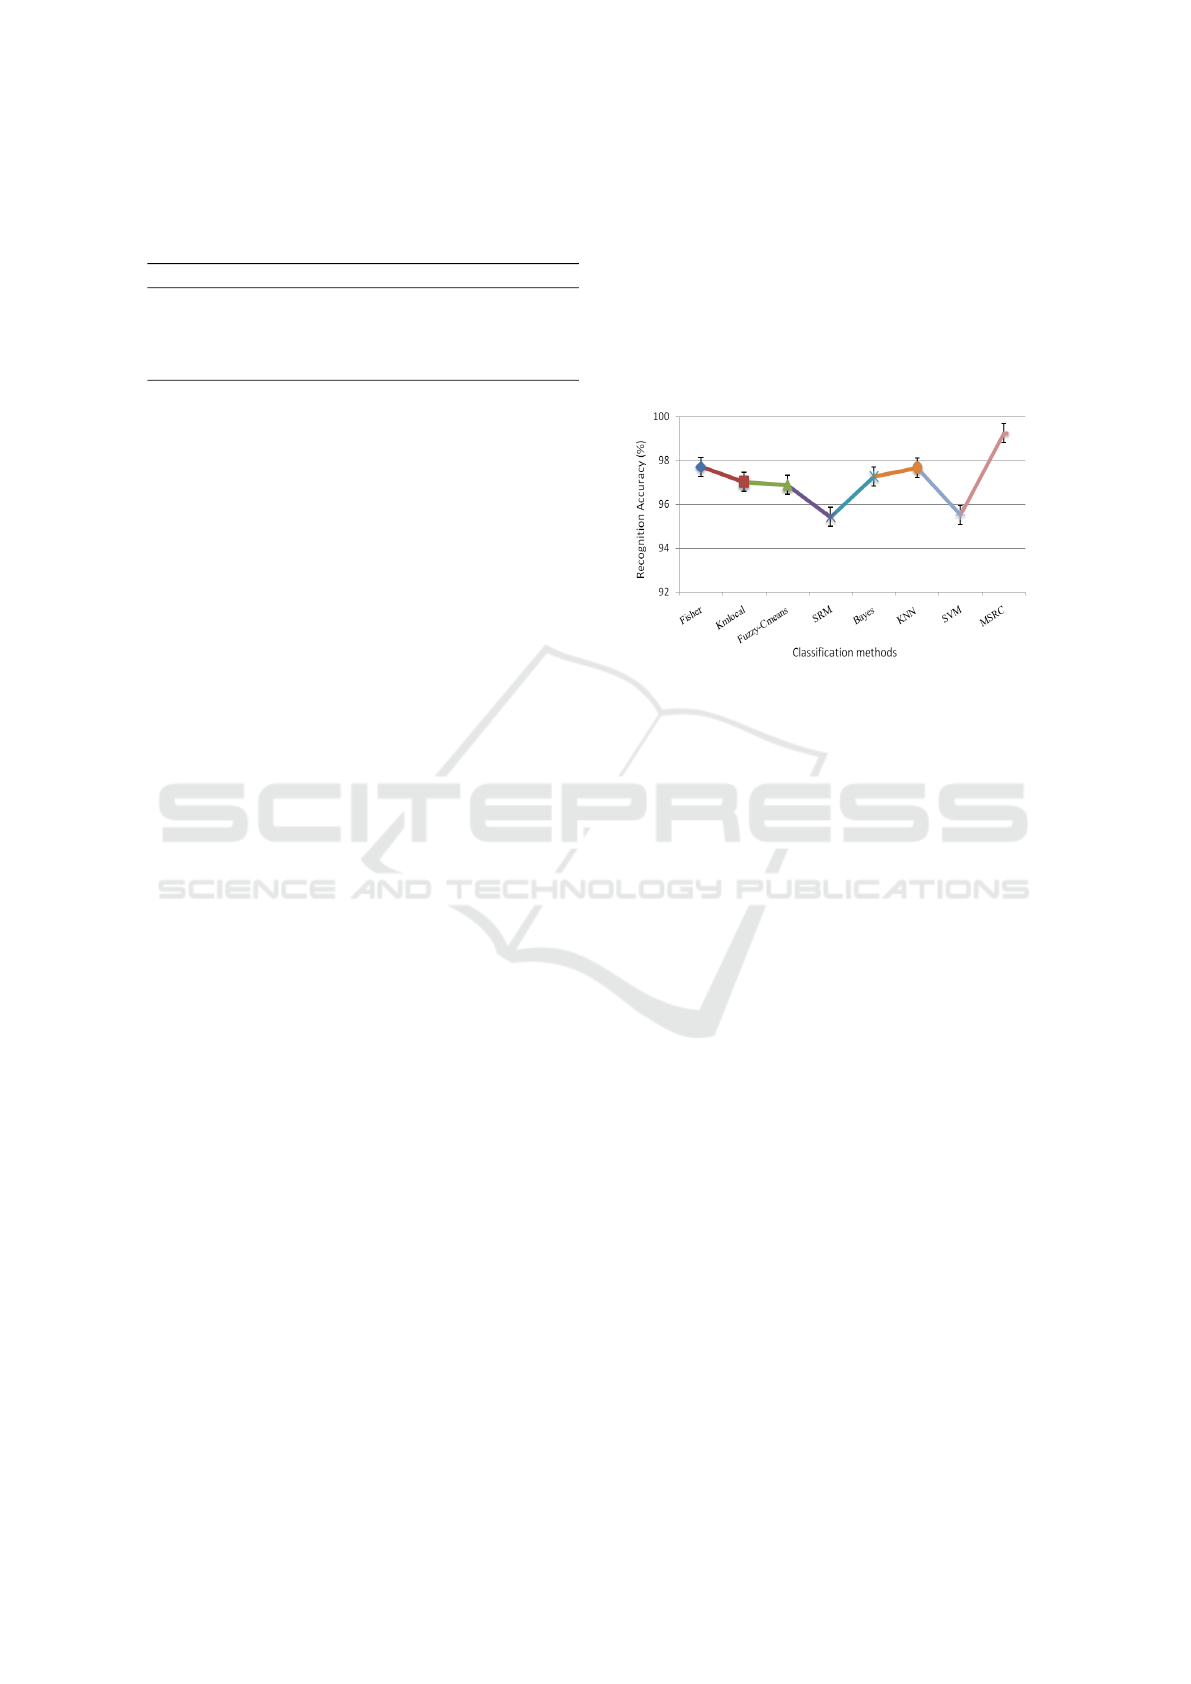
Table 2: Average number of segmented regions per image
and performance of the M S R C method using OCLBP as
local image region descriptor.
RGB RGB/ET AN AN/ET
Number
of regions
38.08 12.20 11.23 10.43
Accuracy
(%)
99.00 99.02 98.98 99.17
In Table 3, we report the obtained experimental re-
sults according to the local color RGB, color local tex-
ture and color hybrid histograms used. The analysis
of the accuracy measure leads us to highlight the in-
fluence of the use of hybrid descriptors. Indeed, when
used in a hybrid form with RGB color histogram, all
tested color local texture histograms give good re-
sults as they permit to increase the classification rate.
However, it is worthy to notice that the RGB ∪ LBP
and RGB ∪ ILT P descriptors are the most promising
because they give the maximum classification rates
compared to the other tested descriptors.
6.4 Comparative Evaluation and
Discussion
As pointed out in Section 1, the main aim of this
study is to improve the performance of the method in-
troduced within the CAPLOC project (Marais et al.,
2013). In this framework, the proposed approach
mainly consists in classifying the acquired fisheye im-
ages (after a geodesic reconstruction based simplifi-
cation) into sky and non-sky class. In this work, the
authors have compared the performance of different
well known clustering algorithms including unsuper-
vised (Fisher, KMlocal, Fuzzy-Cmeans, SRM) and
supervised (Bayes, KNN, SVM) classifiers. More de-
tails related to this work can be found in (Marais et al.,
2013). This section is intended to compare our pro-
posed approach with the framework of (Marais et al.,
2013) used with all these clustering algorithms.
Figure 5 highlights the recognition accuracy ob-
tained for each tested method. It can be seen that our
approach shows higher performance than the method
in (Marais et al., 2013) used with the tested popu-
lar classifiers. Indeed, the proposed method permits
to reach 99.24% as a value for accuracy measure vs
97,71% with Fisher vs 97.67% with KNN, etc. This
shows that our method allows to increase the accuracy
with 1,53%.
We support these results by the illustration of Fig-
ure 6 that shows some examples of visual comparison
of the region classification results. It appears from
this visual analysis that the proposed method demon-
strates excellent precision in terms of sky boundary
extraction. In fact, for all of the images in the first
row of Figure 6, the produced sky extraction results
agree most closely with the corresponding ground
truth. Note that the majority of the sky regions are
detected with good boundary delineation whereas the
method introduced in (Marais et al., 2013) leads to
many false positives on buildings and vegetation ar-
eas and false negatives within sky area accompanied
by a loss of several parts of sky.
Figure 5: Classification results according to the method of
(Marais et al., 2013) used with the tested popular classifiers
and according to our proposed method.
7 CONCLUSION
The paper introduced a complete processing chain for
horizon line detection from fisheye images, in the
framework of enhancing GNSS based localization.
The proposed method relies on a region based clas-
sification method using Hellinger kernel-based dis-
tance and a number of color, texture and hybrid im-
age region descriptors. As a first step, we proposed
to simplify the input images using Affine Normaliza-
tion coupled with Exponential Transform in order to
limit illumination changes (shadows, brightness, etc.)
affecting the acquired fisheye images. Then, we have
introduced several new local color descriptors for im-
age region description based on texture features in
order to characterize the regions obtained with the
SRM algorithm. RGB color, a number of 10 color lo-
cal texture and 10 local hybrid histograms have been
introduced. As a final step, a Maximal Similarity
Based Region Classification using Hellinger kernel-
based distance has been proposed in order to identify
candidate regions corresponding to targeted objects
(sky regions in our case). The proposed approach was
tested on image database containing 150 fisheye im-
ages allowing to obtain satisfying results with higher
performance than that obtained with the method of
(Marais et al., 2013) tested with several unsupervised
(KMlocal, Fisher, fuzzy C-means and SRM) and su-
pervised (Bayes, KNN and SVM) classifiers.
Hellinger Kernel-based Distance and Local Image Region Descriptors for Sky Region Detection from Fisheye Images
425
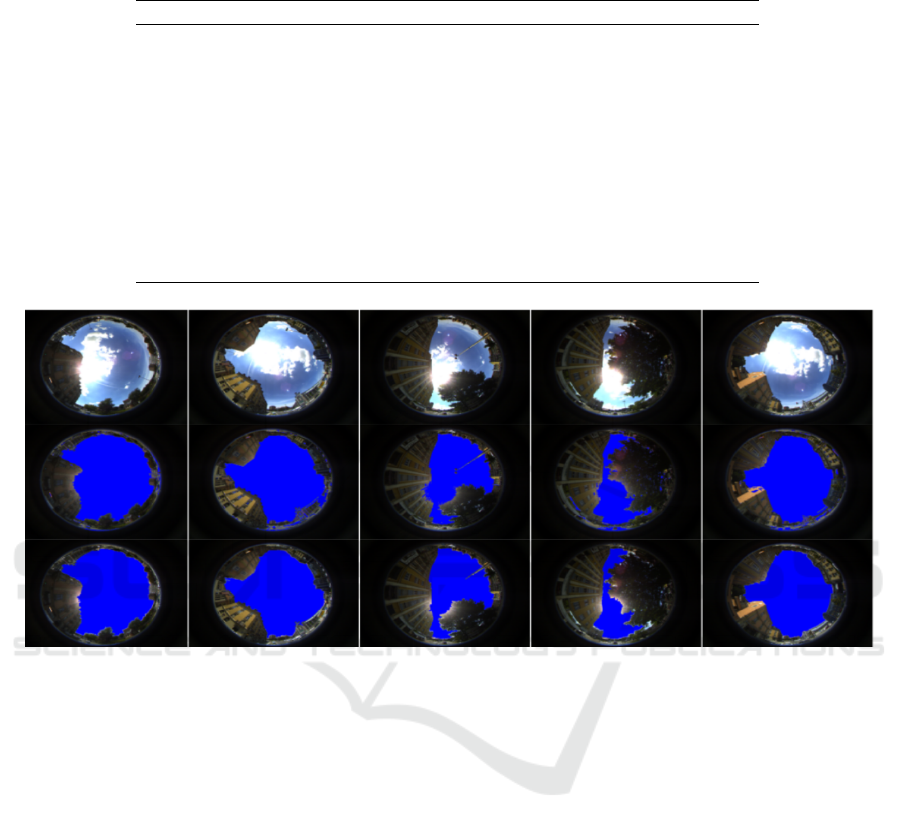
Table 3: Classification results according to the local color RGB histogram, color local texture and color hybrid histograms
used.
Descriptors Accuracy (%) Hybrid Descriptors Accuracy (%)
RGB 99.13 - -
LBP 98.43 RGB ∪ LBP 99.24
CSLBP 96.92 RGB ∪ CSLBP 97.97
LPQ 93.42 RGB ∪ LPQ 99.18
3DLBP 93.33 RGB ∪ 3DLBP 97.97
LQP 96.34 RGB ∪ LQP 99.18
SDH 99.07 RGB ∪ SDH 99.13
LDP 96.11 RGB ∪ LDP 98.23
OCLBP 99.17 RGB ∪ OCLBP 99.22
LTP 97.29 RGB ∪ LTP 97.27
ILTP 97.81 RGB ∪ ILTP 99.24
Figure 6: Visual comparison of region classification results. acquired images (first row); classified image into two classes (sky
and non-sky) obtained by the best classifier defained in (Marais et al., 2013) (second row) and classification result obtained
by the proposed M SR C approach (third row).
In future works, we envisage to extend the pro-
posed approach to other data sets related to applica-
tions dealing with automatic objects recognition.
REFERENCES
Chao, Z., Charles, E., and Liming, C. (2013). Image re-
gion description using orthogonal combination of lo-
cal binary patterns enhanced with color information.
Pattern Recognition, 46:1949–1963.
Choi, J., Ro, Y., and Plataniotis, K. (2012). Color local tex-
ture features for color face recognition. IEEE Trans.
Image Proces, 21(3):1366–1380.
Dornaika, F., Moujahid, A., El merabet, Y., and Ruichek,
Y. (2016). Building detection from orthophotos using
a machine learning approach: An empirical study on
image segmentation and descriptors. Expert Syst Appl,
58:130–142.
El merabet, Y., Meurie, C., Ruichek, Y., Sbihi, A., and
Touahni, R. (2011). Orthophotoplan segmentation and
colorimetric invariants for roof detection. In Interna-
tional Conference on Image Analysis and Processing,
Springer Berlin Heidelberg, pages 394–403.
El merabet, Y., Meurie, C., Ruichek, Y., Sbihi, A., and
Touahni, R. (2014). Segmentation d’images a
´
eriennes
par coop
´
eration lpe-r
´
egions et lpe-contours. applica-
tion
`
a la caract
´
erisation de toitures. Revue Francaise
de Photogrammetrie et de Teledetection, (206):9–44.
El merabet, Y., Meurie, C., Ruichek, Y., Sbihi, A., and
Touahni, R. (2015). Building roof segmentation from
aerial images using a line and region-based watershed
segmentation technique. Sensors, 15:3172–3203.
Fukunaga, K. (1990). Introduction to statistical pattern
recognition. Second ed., Academic Press.
Fusiello, A., Trucco, E., Tommasini, T., and Roberto, V.
(1999). Improving feature tracking with robust statis-
tics. Pattern Analysis and Applications, 2:312–320.
Heikkil
¨
a, M., Pietik
¨
ainen, M., and Schmid, C. (2006). De-
scription of interest regions with center-symmetric lo-
cal binary patterns. In Madurai, I. L., editor, 5th In-
dian Conference on Computer Vision, Graphics and
Image Processing, volume 4338, pages 58–69.
VISAPP 2017 - International Conference on Computer Vision Theory and Applications
426

Huang, Y., Wang, Y., and Tan, T. (2006). Combining statis-
tics of geometrical and correlative features for 3d face
recognition. In 17th British Machine Vision Confer-
ence, pages 879–888.
Kailath, T. (1967). The divergence and bhattacharyya dis-
tance measures in signal selection. IEEE Transactions
on Communications Technology, 15:52–60.
Lentmaier, M., Krach, B., and Robertson, P. (2008).
Bayesian time delay estimation of gnss signals in dy-
namic multipath environments. International Journal
of Navigation and Observation, vol. 2008.
Marais, J., Meurie, C., Attia, D., Ruichek, Y., and Flanc-
quart, A. (2013). Toward accurate localization in
guided transport: Combining gnss data and imaging
information. Transportation Research Part C Emerg-
ing Technologies, 43:88–197.
Nanni, L., Brahnam, S., and Lumini, A. (2010a). A local
approach based on a local binary patterns variant tex-
ture descriptor for classifying pain states. Expert Syst.
Appl, 37(12):7888–7894.
Nanni, L., Lumini, A., and Brahnam, S. (2010b). Local bi-
nary patterns variants as texture descriptors for medi-
cal image analysis. Artif. Intell. Med, 49(2):117–125.
Ninga, J., Zhanga, L., and Wub, D. (2010). Interactive im-
age segmentation by maximal similarity based region
merging. Pattern Recognition, 43(2):445–456.
Nock, R. and Nielsen, F. (2004). Statistical region merg-
ing. IEEE Transactions on Pattern Analysis Machine
Intelligence, 26:1452–1458.
Ojala, T., Pietik
¨
ainen, M., and Harwood, D. (1996). A
comparative study of texture measures with classifica-
tion based on feature distributions. Pattern Recognit,
29(1):51–59.
Ojansivu, V., , and Heikkila, J. (2008). Blur insensitive tex-
ture classification using local phase quantization. In
ICISP, pages 236–243.
Stricker, M. and Orengo, M. (1995). Similarity of color
images. In SPIE Storage and Retrieval for Image and
Video Databases, volume 3, pages 381–392.
Swain, M. and Ballard, D. (2002). Color indexing. Interna-
tional Journal of Computer Vision, 7:11–32.
Tan, X. and Triggs, B. (2007). Enhanced local texture fea-
ture sets for face recognition under difficult lighting
conditions. In LNCS, editor, Analysis and Modelling
of Faces and Gestures, volume 4778, pages 168–182.
Unser, M. (1986). Sum and difference histograms for tex-
ture classification. IEEE Trans. Pattern Anal. Mach.
Intell . PAMI-8(1), pages 118–125.
Wang, J. and Gao, Y. (2007). High-sensitivity gps data
classification based on signal degradation conditions.
IEEE Trans. Veh. Technol, 56(2):566–574.
Zhang, B., Gao, Y., Zhao, S., and Liu, J. (2010). Lo-
cal derivative pattern versus local binary pattern: face
recognition with high-order local pattern descriptor.
IEEE Trans. Image Proces, 19(2):533–544.
Hellinger Kernel-based Distance and Local Image Region Descriptors for Sky Region Detection from Fisheye Images
427
