
Reduction of Optical Rotation and Scattering in a Cholesteric Liquid
Crystal Layer
Mitsunori Saito and Junki Fujiwara
Department of Electronics and Informatics, Ryukoku University, Seta, Otsu 520-2194, Japan
Keywords: Liquid Crystal, Polarization, Optical Rotation, Scattering, Refractive Index.
Abstract: Cholesteric liquid crystal usually exhibits an optical rotation owing to its chirality. In the infrared region,
however, the optical rotation power disappears, since the light wavelength is too long to recognize the
refractive-index change of the nanometer-sized chiral structure. Consequently, the cholesteric liquid crystal
exhibits a polarization-independent refractive index in the long-wavelength infrared range. The effective
refractive index takes a value between the ordinary and extraordinary indices regardless of the polarization
direction. The refractive index decreases to the ordinary index, when a phase transition takes place by
application of an electric voltage (the electro-optical effect). This polarizer-free device operation, however,
used to be limited to the wavelength range beyond 4 μm, since the optical rotation remained in the short
wavelength range. In addition, a heavy scattering occurred during the phase transition process. In this study,
experiments were conducted to examine how the chiral pitch and the thickness of the liquid crystal layer
affected these optical characteristics. When a liquid crystal with a chiral pitch of 5 μm was enclosed in a cell
with a 3 μm gap, both the rotation power and scattering loss were reduced successfully in a wide spectral
range extending to 2 μm wavelength.
1 INTRODUCTION
Liquid crystals (LCs) are used widely in various
technical fields today (Khoo, 2007). Although LCs
exhibit efficient electro-optic effects, i.e., notable
changes in the refractive index or optical rotation
power by low-voltage application, they usually need
a polarizer that halves a light intensity. This problem
is serious in the infrared spectral range, in which
efficient, durable, low-cost polarizers are unavailable
due to opaqueness of ordinary glasses, crystals, and
polymers (Saito and Yasuda, 2010). Since the early
days of the LC device development, many researchers
have conducted experiments to attain polarization-
independent optical functions. A beam-splitting
method (Patel and Maeda, 1991), for example, was
used for creating a wavelength-division multiplexing
device (Hirabayashi et al, 1993) and an infrared Lyot
filter (Saito and Hayashi, 2013). A polarization-
insensitive hologram was realized by use of a quarter-
wave plate (Moore et al, 2008). A stack of
orthogonally-oriented LC layers, which yielded an
equivalent optical response for all polarization
directions, was used for creating an optical phase
modulator (Lin et al, 2005) or a tunable lens (Ye et al,
2006). An axially-symmetric director distribution
(Lee et al, 1999) and a complicated grating texture
(Provenzano et al, 2006) were also constructed by
coating special alignment films on the substrates.
Flat-panel displays use a twisted nematic LC, in
which molecules take a chiral texture. As a light beam
with a linear polarization propagates in this texture,
its polarization direction rotates according to the
director rotation (Saito et al, 2011). In a long-
wavelength range, however, the optical rotation
power decreases as the birefringence of the LC layer
decreases (Patel and Lee, 1991). Generally, a material
with a non-uniform structure exhibits uniform or
isotropic optical properties, if the structure is smaller
than the light wavelength (the effective medium
theory). This is the case with the blue phase LC
(Crooker, 2001), in which a nano-sized domain
texture induces an isotropic refractive index (Haseba,
2005). Although this characteristic is useful for
creating a polarization-independent optical device,
the blue-phase LC has to be stabilized in a polymer
matrix, and hence, needs a high voltage (~100 V) to
induce an index change of Δn=0.05. (Lin et al, 2010).
22
Saito M. and Fujiwara J.
Reduction of Optical Rotation and Scattering in a Cholesteric Liquid Crystal Layer.
DOI: 10.5220/0006089700220031
In Proceedings of the 5th International Conference on Photonics, Optics and Laser Technology (PHOTOPTICS 2017), pages 22-31
ISBN: 978-989-758-223-3
Copyright
c
2017 by SCITEPRESS – Science and Technology Publications, Lda. All rights reserved
A cholesteric (chiral nematic) LC is another
selection to attain isotropic properties with a nano-
sized structure of the molecular orientation (Hsiao et
al, 2011). The chiral texture of the cholesteric LC is
similar to that of the twisted nematic LC but possesses
a shorter chiral pitch. The cholesteric LC, therefore,
induces an optical rotation only for a light beam
whose wavelength is sufficiently shorter than the
chiral pitch. If the chiral pitch is close to the
measurement wavelengths, a photonic band-gap
emerges in the transmission spectrum (Kopp et al,
1998), which is useful to create a tunable laser
(Furumi et al, 2003). In a longer wavelength range,
however, the dimension of the molecular rotation is
too small to be recognized by lightwave, and
consequently, the cholesteric LC exhibits an isotropic
index of refraction.
In a previous study, the authors examined infrared
transmission characteristics of a cholesteric LC in
order to realize a polarization-independent Fabry-
Perot filter (Saito et al, 2015). An isotropic refractive
index was attained in the infrared range beyond 2 μm
wavelength, and it decreased by 0.09 during
a voltage
application process (12‒18 V). The transmitted light,
however, exhibited a trace of optical rotation in the
wavelength range below 3 μm. In addition, the
transmittance decreased heavily in the midway of the
index change, which originated from the scattering in
the unstable phase transition process (Kim et al, 2010).
In this study, we conduct experiments to clarify how
the chiral pitch and the LC layer thickness affect the
transmission properties of the LC cell. On the basis of
the experimental results, we discuss a suitable design
of the LC cell to create a polarization-independent
device with a reduced scattering loss.
2 PRINCIPLE
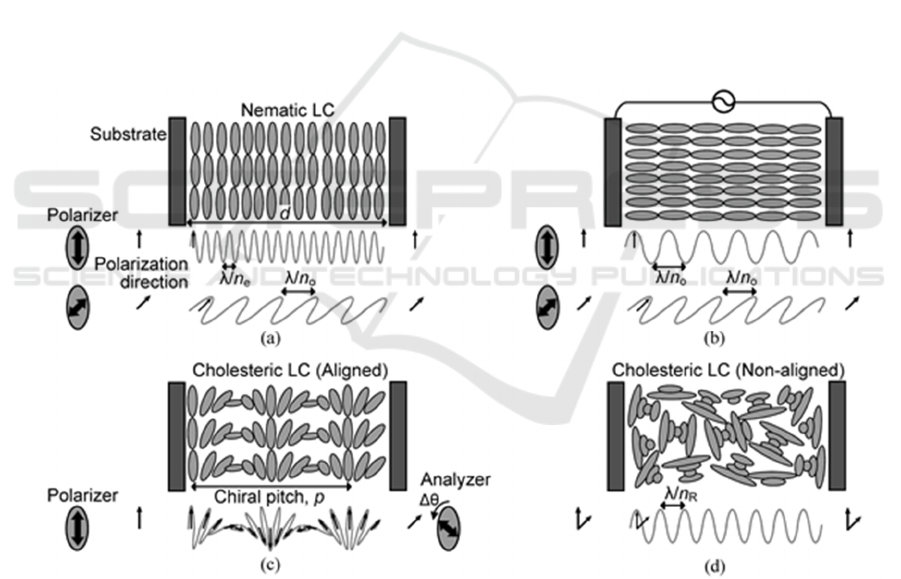
Figure 1 illustrates various LC phases in a cell
together with polarization directions of propagating
lightwave. As Fig. 1(a) shows, ordinary cells align
Figure 1: Various molecular orientations in a LC cell (thickness d). The refractive indices of the LC are n
o
and n
e
for the
ordinary and extraordinary lightwaves (wavelength: λ), respectively. (a) A nematic LC that is oriented parallel to the substrate.
The light wavelength in the LC cell is λ/ n
e
or λ/n
o
depending on the polarization direction. (b) A homeotropic phase in which
LC molecules are oriented in the direction perpendicular to the substrates owing to an electric field. The light wavelength in
this LC cell is λ/n
o
regardless of the polarization direction. (c) A cholesteric LC that is oriented by an alignment coating on
the substrate surface. The director of the LC molecules rotates 360º with a chiral pitch, p. Accordingly, the polarization
direction of a light beam rotates with the same pitch as it propagates in this LC. The polarization direction of the transmitted
light can be analyzed by rotating an analyzer (polarizer) to find an angle Δθ that yields the maximum transmittance. (d) A
cholesteric LC in a cell with no alignment coating. The LC layer consists of multiple domains in which molecules form a
chiral structure. If the light wavelength is sufficiently long, this LC layer exhibits an effective refractive index, n
R
, that is
independent of the polarization direction. When an electric voltage is applied to the cells in (a), (c), and (d), they all turn to
the homeotropic phase in (b).
Reduction of Optical Rotation and Scattering in a Cholesteric Liquid Crystal Layer
23

nematic LC molecules in a fixed direction by the use
of an alignment coating on the substrates. This LC
orientation
exhibits an ordinary or extraordinary
refractive index, n
o
or n
e
, depending on the
polarization direction of incident light. Consequently,
a propagating beam takes a different wavelength, λ/n
o
or λ/n
e
, depending on the polarizer direction. As Fig.
1(b) shows, the LC molecules are reoriented in the
direction of the electric field, if a voltage is applied
between the substrates. In this phase, the LC exhibits
an ordinary index (n
o
) regardless of the polarization
direction, and accordingly, the light wavelength
becomes λ/n
o
. In other words, only the extraordinary
light suffers the change in the refractive index
(wavelength). No index change takes place for the
ordinary light. This is the reason that polarizers are
needed for tuning LC devices.
Figure 1(c) is a schematic illustration of the
cholesteric LC that is sandwiched between two
substrates with an alignment coating. The LC director
rotates 360° with a chiral pitch, p. A short-
wavelength beam changes its polarization direction
with the same pitch. Consequently, the polarization
direction of the output beam becomes different from
that of the input beam. The polarization state of the
beam can be analyzed by rotating an analyzer
(polarizer); i.e., if the polarization direction of the
beam rotates by ∆θ in the LC cell, the maximum
transmittance is attained at the same angle, ∆θ. If the
light wavelength is too long to recognize the chiral
texture, the refractive index becomes independent of
the polarization direction and takes an average of n
o
and n
e
. According to the effective medium theory
(Born and Wolf, 1980), the average has to be taken
for the dielectric constant, i.e., the square of the
refractive index. The average index is therefore
2
⁄
. (1)
This average index is higher than n
o
, since n
e
is
usually higher than n
o
. When a voltage is applied, the
LC layer turns to the homeotropic phase in Fig. 1(b),
and hence, the refractive index decreases to n
o
.
The chiral texture of the cholesteric LC is affected
seriously by the substrate surface. If the alignment
coating on the substrate is removed, the regular
arrangement of the LC molecules is disturbed heavily,
and a domain texture emerges in the LC layer, as
shown in Fig. 1(d). In this texture, the refractive index
varies randomly in a small region, and consequently,
isotropic properties are readily attainable in the long
wavelength range. According to the effective medium
theory above, the refractive index of this texture is
2
3
⁄
, (2)
since one direction is parallel to the LC director
(extraordinary light) and the other two directions are
perpendicular to the director (ordinary light). A
voltage application causes the LC molecules to turn
to the electric field direction, and finally takes the
homeotropic phase in Fig. 1(b). In this manner, the
refractive index is adjustable between n
o
and n
R
independent of polarization. In the short wavelength
range, however, the LC does not act as a uniform,
isotropic medium, and hence the polarization state of
the incident beam is not maintained. The optical
scattering also increases as the wavelength becomes
shorter. The scattering loss is notable particularly in
the non-aligned cholesteric LC, since the molecular
arrangement is disturbed heavily in this phase.
3 SAMPLES AND EXPERIMENTS
Samples were prepared by injecting a cholesteric LC
into a gap between two silicon (Si) plates of 20 mm
square (Saito et al, 2007). The gap or the LC layer
thickness was adjusted between 3 and 20 μm by the
use of glass spheres. No alignment coating was
achieved on the substrate, since the polymer coating
caused an absorption in the infrared region. The LC
layer therefore took the domain texture shown in Fig.
1(d). The chiral pitch of the cholesteric LC (JNC
Corporation, JD-1036LA, JD-1036LB) was p=4.8 or
1.5 μm. The ordinary and extraordinary refractive
indices were n
o
=1.52 and n
e
=1.76, respectively.
According to Eq. (2), the effective index of the LC
layer was assumed to be n
R
=1.60. It was expected,
therefore, that the index change of ∆n≈0.08 was
attainable by voltage application.
Electric wires were soldered on the substrates for
voltage application. A sinusoidal signal of 1 kHz was
generated by an electric oscillator and an amplifier. A
peak voltage was adjusted between 0 and 100 V by
monitoring the signal with an oscilloscope. The
sample was mounted on the sample stage of a Fourier-
transformation infrared spectrometer (FTIR,
Shimadzu, IR Affinity-1) for spectral measurements.
No polarizers was used in regular transmittance
measurements. A polarization dependence of the
transmittance was examined by inserting a BaF
2
wire-
grid polarizer (Edmund, WGP8203) in front of the LC
cell. As Fig. 1(c) shows, another polarizer (analyzer)
was inserted on the output side, when the optical
rotation was examined. In all measurements,
PHOTOPTICS 2017 - 5th International Conference on Photonics, Optics and Laser Technology
24
transmittance was evaluated by taking the ratio of
transmitted light intensities that were measured
before and after mounting the LC cell on the stage.
The transmission characteristics of the polarizers
were therefore cancelled out in the measured
transmission spectra.
4 RESULTS
4.1 Conventional LC Cell
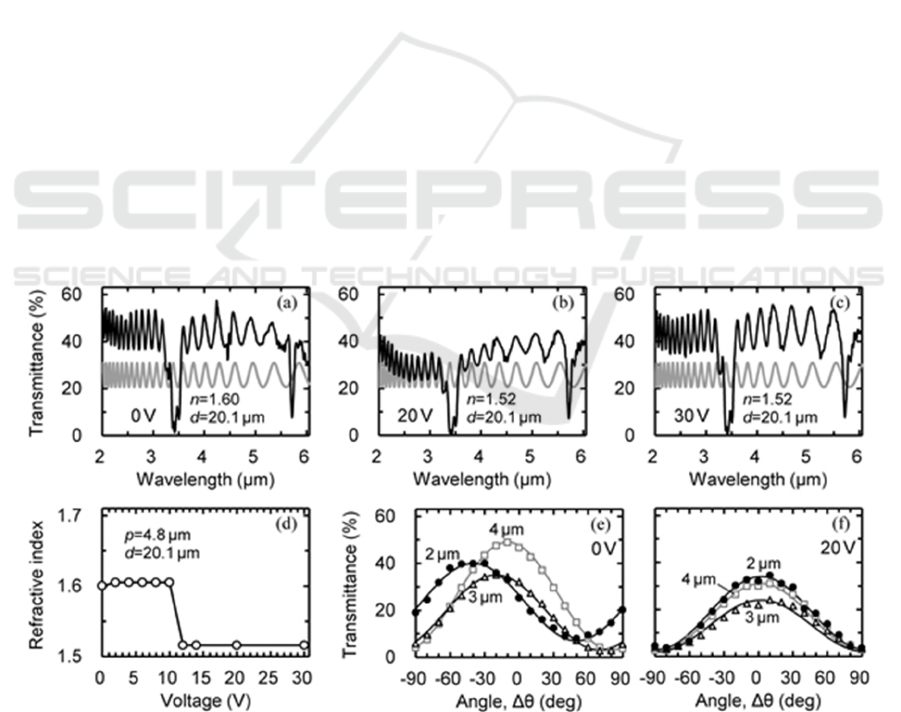
The first LC cell was prepared by using spheres of 20
μm diameter and the LC with a 4.8 μm pitch. The
black lines in Figs. 2(a)‒2(c) show the transmission
spectra that were measured before and during a
voltage application process. Interference peaks were
visible over the entire spectral range. This
interference was caused by the resonance in the LC
layer (between the Si substrates), since the Si surfaces
(the Si-LC boundaries) yielded a high reflectance
owing to the high index of refraction. The high
reflectance at the outer surfaces (the Si-air
boundaries) reduced the maximum transmittance to
~55%. The dips at 3.4 and 5.7 μm were attributed to
the absorption by the LC. The spectral disturbance at
4.3 μm was caused by carbon dioxide gas that was
contained in the atmosphere around the sample. The
voltage application caused a transmittance decrease
(20 V) as well as the peak shift toward shorter
wavelengths. When the voltage exceeded 20 V, the
peak shift stopped. The transmittance returned to the
original level at ~30 V, and thereafter no spectral
change was visible.
The gray lines in Figs. 2(a)‒2(c) indicate the peak
wavelengths in the interference spectrum, which were
calculated by assuming suitable values for
the
refractive index (n) and thickness (d) of the LC
layer; i.e., according to the thin-film interference
theory (Hecht, 1998), the peak wavelengths were
calculated by the use of the relation,
λ
2
⁄
1,2,3,⋯. (3)
(The height and amplitude of these fitting curves have
no meaning.) The peak-wavelength fitting was first
conducted for the measured spectrum in Fig. 2(c),
since the refractive index was presumed to be n
o
=1.52
in the voltage application process [Fig. 1(b)]. By
using this index value, the theoretical peak
wavelengths were calculated for various thicknesses
(d) to examine the coincidence of the measured and
calculated peak wavelengths (the black and gray
lines). The best fitting was attained when the
thickness was assumed to be d=20.1 μm, which was
close to the sphere (spacer) diameter. Then the peak
fitting was conducted for the other spectra by using
this thickness. The best-fit value was n=1.52 in Fig.
2(b) and 1.60 in Fig. 2(a). Figure 2(d) shows the
Figure 2: Optical properties of the LC with a chiral pitch of p=4.8 μm and an evaluated thickness of d=20.1 μm. (a–c) The
black lines show the transmission spectra. The gray lines show the fitting curves that assume the refractive index of 1.52 at
30 V. (d) Evaluated refractive indices as a function of the applied voltage. (e, f) Transmittance change by the rotation (Δθ) of
the analyzer. Measurements were conducted at 0 and 20 V.
Reduction of Optical Rotation and Scattering in a Cholesteric Liquid Crystal Layer
25
refractive indices that were evaluated in this manner.
The refractive index decreases rapidly at around 10 V,
and thereafter becomes constant. The transition to the
homeotropic phase [Fig. 1(b)] takes place in this
voltage range. A slight structural adjustment to
complete the homeotropic orientation seems to
continue until ~30 V, since the scattering remains
even at a voltage exceeding 20 V. In the initial phase
at 0 V, the evaluated refractive index is 1.60. This
value
is
closer
to
n
R
=1.60
than
n
AV
=1.64, which
are
calculated by using Eqs. (2) and (1), respectively,
with n
o
=1.52 and n
e
=1.76. This fact confirms the
assumption that the current LC initially takes the
domain texture of Fig. 1(d).
The optical rotation in the LC cell was evaluated
by using two polarizers, as shown in Fig. 1(c). Figures
2(e) and 2(f) show the transmittances that were
measured as rotating the analyzer. During the voltage
application process (20 V), the transmittance
becomes the maximum at ∆θ=0° (parallel Nicols) and
the minimum at ±90° (crossed Nicols). This result
indicates that the light beam suffers no polarization
rotation in this phase. In the initial phase at 0 V,
however, the maximum angle shifts heavily at short
wavelengths, indicating that the polarization direction
rotates in the LC cell; e.g., 40° at 2 μm wavelength.
As mentioned in Section 2, light with a short
wavelength recognizes a fine index distribution, and
consequently, the polarization direction rotates
according to the molecular chirality.
4.2 LC with a Short Chiral Pitch
In the experiments above, the LC cell exhibited both
the scattering loss and the optical rotation. These
problems could be solved by using an LC with a short
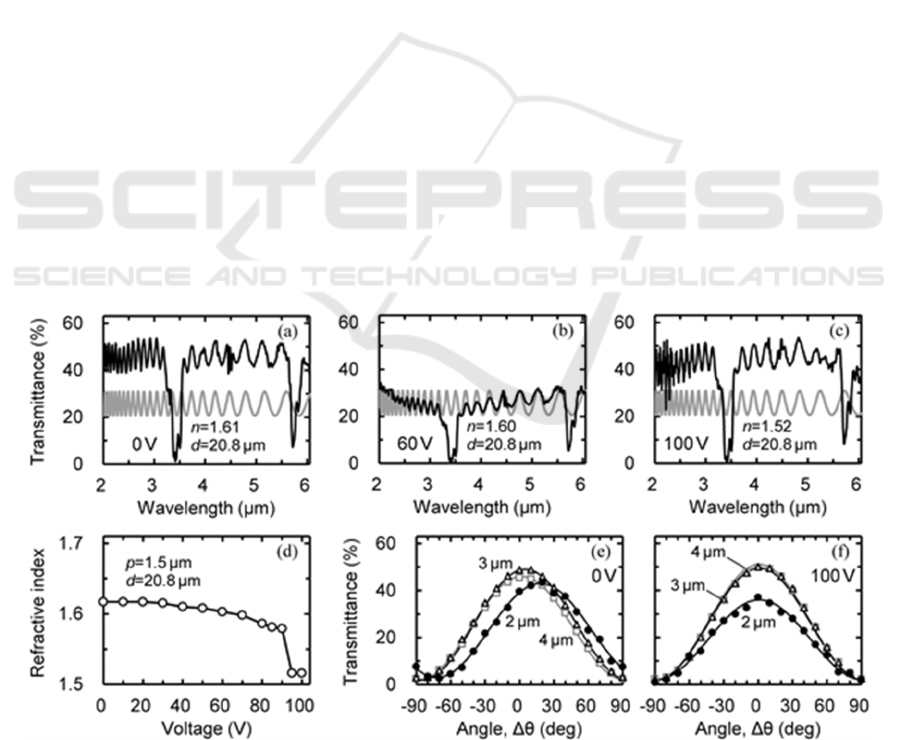
chiral pitch (a fine structure). An LC with a 1.5 μm
pitch was therefore used to fabricate the next sample.
The glass spheres of the same diameter (20 μm)
were
used
as
a
spacer.
The
black
lines
in
Figs. 3(a)‒3(c)
show the transmission spectra. Although the spectra
were similar to those of the first sample, a high
voltage was needed to induce the peak shift. A
notable decrease in transmittance was also visible at
around 60 V. The peak-wavelength fitting was
conducted by drawing theoretical curves (gray lines)
below the measured spectra. The LC layer thickness
was evaluated to be d=20.8 μm from the spectrum in
Fig. 3(c). The evaluated indices were 1.60 at 60 V and
1.61 at 0V. Figure 3(d) shows the refractive index as
a function of the applied voltage. The refractive index
of the initial phase (0 V) is 1.61, which is close to both
the result of the first sample [Fig. 2(d)] and the
predicted value (n
R
) [Eq. (2)]. The refractive index
decreases gradually to 1.58 as the voltage rises to 90
V, and then drops rapidly to 1.52. The cholesteric LC
is a mixture of nematic and chiral LCs. Increase in the
concentration of the chiral agent seems to raise a
voltage that is needed to induce the reorientation.
Figure 3(e) shows the polarization state of the
light beam that passed through the LC of the initial
Figure 3: Optical properties of the LC with a chiral pitch of p=1.5 μm and an evaluated thickness of d=20.8 μm. (a–c) The
black lines show the transmission spectra. The gray lines show the fitting curves that assume the refractive index of 1.52 at
100 V. (d) Evaluated refractive indices as a function of the applied voltage. (e, f) Transmittance change by the rotation (Δθ)
of the analyzer. Measurements were conducted at 0 and 100 V.
PHOTOPTICS 2017 - 5th International Conference on Photonics, Optics and Laser Technology
26
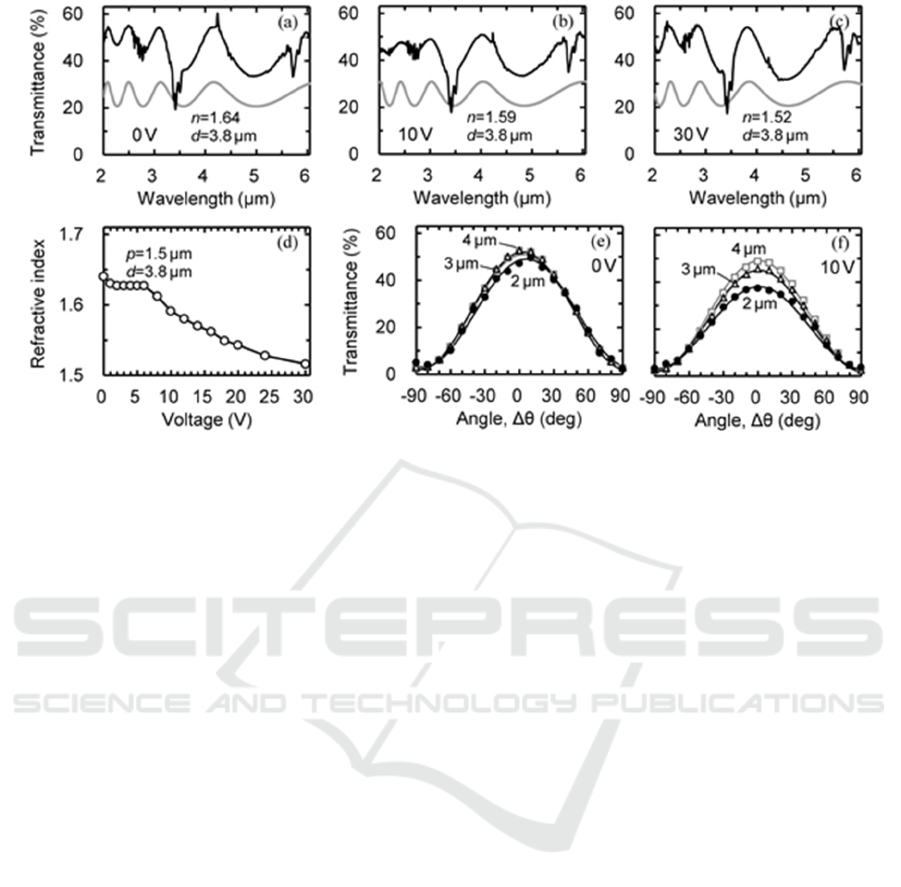
Figure 4: Optical properties of the LC with a chiral pitch of p=1.5 μm and an evaluated thickness of d=3.8 μm. (a–c) The
black lines show the transmission spectra. The gray lines show the fitting curves that assume the refractive index of 1.52 at
30 V. (d) Evaluated refractive indices as a function of the applied voltage. (e, f) Transmittance change by the rotation (Δθ) of
the analyzer. Measurements were conducted at 0 and 10 V.
phase. As expected, the optical rotation became
smaller in comparison with the result in Fig. 2(e). At
2 μm wavelength, however, a slight rotation still
remained. As Fig. 3(f) shows, no optical rotation
occurred in the homeotropic phase at 100 V.
These results indicate that decreasing the chiral
pitch neither eliminates the optical rotation and
scattering
nor
reduces
the
operation
voltage. We
therefore reduced the LC layer thickness in the
following experiment. Figures 4(a)‒4(c) show the
transmission spectra of the LC cell with a reduced
thickness. The thickness was evaluated to be d=3.8
μm by fitting the theoretical curve to the spectrum in
Fig. 4(c). In comparison with the spectra of the thick
cells (Figs. 2 and 3), the spectral curve changes gently
creating a smaller number of interference peaks. This
happens because the peak interval extends as the
optical thickness, nd, of the resonance cavity
decreases [Eq. (3)]. The interference peaks shift to
shorter wavelengths as the voltage increases. No
notable transmittance decrease is visible during the
voltage application process. Figure 4(d) shows the
voltage dependence of the refractive index. The
refractive index of the initial state (0 V) is 1.64. This
index is higher than those of the former LC cells [Figs.
2(d) and 3(d)] and coincides with the theoretical value
(n
AV
) of Eq. (1). The LC seems to take a regular chiral
texture [Fig. 1(c)] rather than a domain texture [Fig.
1(d)] when it is confined in a small volume. The
refractive index decreases gradually when the voltage
rises exceeding 6 V.
Figure 4(e) shows the polarization state of the
output beam. As regards a light beam of 3 μm
wavelength or longer, no polarization rotation is
visible. At 2 μm wavelength, however, a slight optical
rotation still remains (10°). As Fig. 4(f) shows, the
optical rotation becomes negligible when the LC is
reoriented by the voltage application.
4.3 Reduction of the LC Thickness
As the experiments in the last section clarified, both
the scattering loss and the optical rotation could be
eliminated more effectively by decreasing the LC
layer thickness than the chiral pitch. It was therefore
assumed that the cholesteric LC of 4.8 μm pitch could
also exhibit improved optical properties if it was
confined in a thin cell. To confirm this assumption,
we conducted experiments by using the long-pitch LC
again.
The black lines in Figs. 5(a)‒5(c) show the
transmission spectra of the LC cell whose chiral pitch
and thickness were p=4.8 and d=7.2 μm, respectively.
The thickness was determined by the peak-
wavelength fitting for the spectrum in Fig. 5(c). As
Fig. 5(b) shows, this LC cell still exhibited a
transmittance decrease during the phase transition
process. The LC layer thickness was therefore
Reduction of Optical Rotation and Scattering in a Cholesteric Liquid Crystal Layer
27
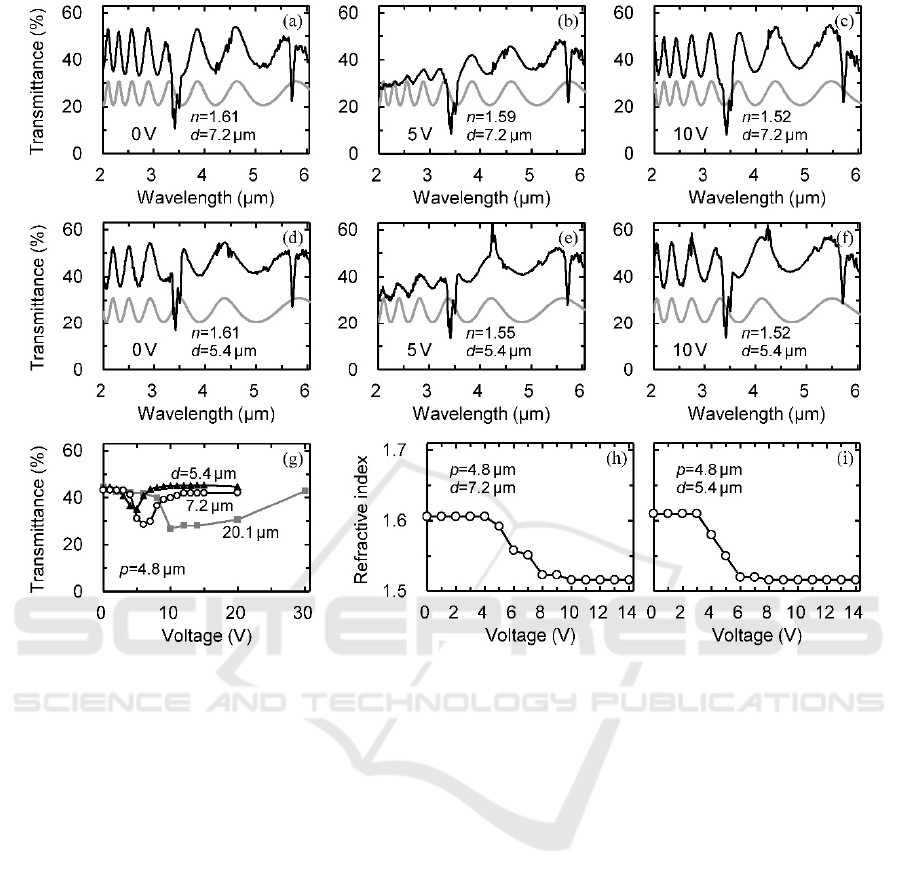
Figure 5: (a–f) Transmission spectra of the LC with a chiral pitch of p=4.8 μm and an evaluated thickness of d=7.2 or 5.4 μm.
The black lines show the measured spectra. The gray lines show the fitting curves. The peak-wavelength fitting was conducted
by assuming the refractive index of 1.52 at 10 V. (g) Average transmittance in the 2–3 μm range as a function of the applied
voltage. The data were taken from the spectra that were exemplified in (a–f) and Fig. 2. (h, i) Evaluated refractive indices as
a function of the applied voltage.
reduced further to 5.4 μm. Figures 5(d)‒5(f) show the
transmission spectra of this LC cell. The thickness
was still too large to reduce the scattering loss. Figure
5(g) shows voltage dependences of the transmittance,
which were plotted by using the spectral data in Figs.
2(a)‒2(c) and 5(a)‒5(f). Since the transmittance
changed heavily due to the interference, an average
was taken over the 2‒3 μm range. When the thickness
was 20.1 μm, the scattering occurred in the 8‒30 V
range. The scattering
range decreased to 4‒10 V in
the 7.2 μm cell, and 3‒6 V in the 5.4 μm cell. The
scattering strength also decreased as the thickness
decreased.
Figure 5(h) shows the refractive indices that were
evaluated for the cell of 7.2 μm thickness. The
refractive index in the initial phase (0 V) is close to
the theoretical value, n
R
[Eq. (2)]. The index
decreases gradually in the 4‒8 V range. This range
coincides with the heavy-scattering range. As Fig.
5(i) shows, the LC cell of 5.4 μm thickness also
exhibits a refractive index that is close to n
R
. The
index decreases to 1.52 in the 3‒6 V range. In
comparison with the thick LC cell [Fig. 2(d)], these
thin cells exhibit a gentle index change with the
increase of the applied voltage.
Finally, the LC cell of 2.9 μm thickness was
prepared. Figures 6(a)‒6(c) show the transmission
spectra. The peak interval became large, since the
optical thickness was small; i.e., nd=4.7 at 0 V and
4.4 at 10 V. As expected, no notable scattering was
visible
during the voltage application process. In
addition, the absorption bands at 3.4 and 5.7 μm
wavelengths became smaller owing to the reduction
of the optical thickness.
Figures 6(d)‒6(f) show the transmission spectra
that were measured by using a linearly-polarized light
beam. The probe beam of the spectrometer was
polarized in the direction that was horizontal or
PHOTOPTICS 2017 - 5th International Conference on Photonics, Optics and Laser Technology
28
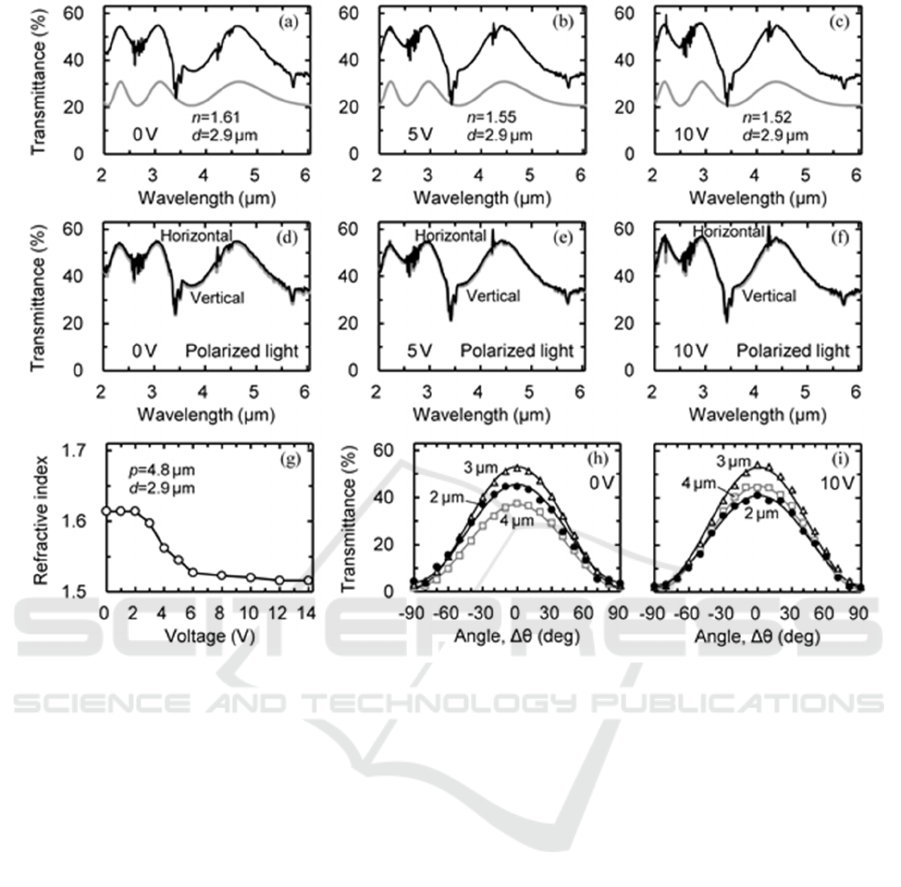
Figure 6: Optical properties of the LC with a chiral pitch of p=4.8 μm and an evaluated thickness of d=2.9 μm. (a–c) The
black lines show the transmission spectra. The gray lines show the fitting curves that assume the refractive index of 1.52 at
10 V. Measurements were conducted by using non-polarized light. (d–f) The black and gray spectra (overlapping) were
measured by using a probe beam that was linearly polarized in the horizontal or vertical direction. (g) Evaluated refractive
indices as a function of the applied voltage. (h, i) Transmittance change by the rotation (Δθ) of the analyzer. Measurements
were conducted at 0 and 10 V.
vertical to the ground. As described in Section 3, the
efficiency of the polarizer was cancelled out in the
measured transmission spectra. The two spectra (the
black and gray lines) corresponding to the horizontal
and vertical polarizations overlap with one another in
the entire spectral range. They also coincide with the
spectra in Figs. 6(a)‒6(c) that were measured with
non-polarized light.
Figure 6(g) shows the refractive indices that were
evaluated by the peak-wavelength fitting in Figs.
6(a)‒6(c). The refractive index at 0 V was 1.61, which
was close to the theoretical value, n
R
. The index
started
to
decrease
at
a
lower
voltage
(2
V)
in this
cell than the former ones. It decreased slightly in the
6‒12 V range, and thereafter became constant
(n
o
=1.52).
Figure 6(h) shows the polarization state of the
beam that passed through the LC layer of the initial
phase. The transmittance took the maximum at ∆θ=0°
and the minimum at ±90° even at 2 μm wavelength.
That is, reduction of the optical rotation was
successful in the entire spectral range. As Fig. 6(i)
shows, the homeotropic phase at 10 V, of course,
exhibited no trace of the optical rotation.
5 DISCUSSION
In our previous study, we evaluated the LC layer
thickness or the cell gap (d) by using a transmission
spectrum of the empty cell before injecting the LC.
The cell gap, however, seemed to shrink during the
LC
injection process probably due to the surface
tension. If this is the case, the inaccuracy of the
thickness causes an error in the evaluation of the
refractive index, since the peak-wavelength fitting
Reduction of Optical Rotation and Scattering in a Cholesteric Liquid Crystal Layer
29

determines only the optical thickness (nd). The
evaluation error becomes more serious as the
thickness (gap) decreases. In this work, therefore, we
evaluated the LC layer thickness from the spectrum
of the reorientation state by assuming that the LC took
the ordinary index (n
o
=1.52) in this state [Fig. 1(b)].
This evaluation method seems successful, since
evaluated indices are reproducible and plausible with
reference to the theoretical prediction. The evaluated
index change was ∆n=1.61‒1.52=0.09, and hence, the
relative index change was ∆n/n
o
=0.09/1.52=0.06
(6%). Although this relative evaluation is accurate,
the actual refractive index may be slightly lower than
the evaluated value, since the ordinary index (n
o
) is
possibly lower than the assumed value (n
o
=1.52 at
0.59 μm) because of the wavelength dispersion (Saito
and Yasuda, 2003). Further analysis is needed to
evaluate the refractive index more accurately.
The reduction of the LC layer thickness was
effective to decrease the optical rotation, the
scattering loss, the absorption loss (3.4 and 5.7 μm),
and the operation voltage. This is an expected result,
since these physical quantities change in proportion
to the thickness. In addition to this proportional effect,
a change in the microstructure (director distribution)
seems to affect the optical properties, since both the
surface tension and narrow space restrict the behavior
of LC molecules.
6 CONCLUSIONS
A cholesteric LC with a chiral pitch of 4.8 μm
exhibited a polarization-independent refractive index
in the infrared region (>2 μm). The index change of
∆n=0.09 was attainable by application of 10 V. Both
the optical rotation and the scattering loss were
eliminated successfully by enclosing this LC in a cell
of 2.9 μm thickness. This LC will be useful to create
polarizer-free devices for the infrared optical systems.
REFERENCES
Khoo, I. C., 2007. Liquid Crystals, Wiley. New York, 2
nd
edition.
Saito, M., Yasuda, T., 2010. An infrared polarization switch
consisting of silicon and liquid crystal. J. Opt. 12(1). p.
015504-1–6.
Patel, J. S., Maeda, M. W., 1991. Tunable polarization
diversity liquid-crystal wavelength filter. IEEE Photon.
Technol. Lett. 3(8). p. 739–740.
Hirabayashi, K., Tsuda, H., Kurokawa, T., 1993. Tunable
liquid-crystal Fabry-Perot interferometer filter for
wavelength-division multiplexing communication
systems. J. Lightwave Technol. 11(12). p. 2033–2043.
Saito, M., Hayashi, K., 2013. Integration of liquid crystal
elements for creating an infrared Lyot filter. Opt.
Express, 21(10). p. 11984–11993.
Moore, J., Collings, N., Crossland, W. A., Davey, A. B.,
Evans, M., Jeziorska, A. M., Komarčević, M., Parker,
R. J., Wilkinson, T. D., Xu, H., 2008. The silicon
backplane design for an LCOS polarization-insensitive
phase hologram SLM. IEEE Photon. Technol. Lett.
20(1). p. 60–62.
Lin, Y.-H., Ren, H., Wu, Y.-H., Zhao, Y., Fang, Ge, J. Z.,
Wu, S.-T., 2005. Polarization-independent liquid
crystal phase modulator using a thin polymer-separated
double-layered structure. Opt. Express, 13(22). p.
8746–8752.
Ye, M., Wang, B., Sato, S., 2006. Polarization-independent
liquid crystal lens with four liquid crystal layers. IEEE
Photon. Technol. Lett. 18(3). p. 505–507.
Lee, J.-H., Kim, H.-R., Lee, S.-D., 1999 Polarization-
insensitive wavelength selection in an axially
symmetric liquid-crystal Fabry-Perot filter. Appl. Phys.
Lett. 75(6). p. 859–861.
Provenzano, C., Pagliusi, P., Cipparrone, G., 2006. Highly
efficient liquid crystal based diffraction grating induced
by polarization holograms at the aligning surfaces. Appl.
Phys. Lett. 89(12). p. 121105-1–3.
Saito, M., Yoshimura, K., Kanatani, K., 2011. Silicon-
based liquid-crystal cell for self-branching of optical
packets. Opt. Lett. 36(2). p. 208–210.
Patel, J. S., Lee, S.-D., 1991. Electrically tunable and
polarization insensitive Fabry-Perot étalon with a
liquid-crystal film. Appl. Phys. Lett. 58(22). p. 2491–
2493.
Crooker, P. P., 2001. Blue Phases. Kitzerow, H., Bahr, C.,
eds., Chirality in Liquid Crystals. Springer, New York.
Haseba, K., Kikuchi, H., Nagamura, T., Kajiyama, T., 2005,
Large electro-optic Kerr effect in nanostructured chiral
liquid-crystal composites over a wide temperature
range. Adv. Mater. 17. p. 2311–2315.
Lin, Y.-H., Chen, H.-S., Lin, H.-C., Tsou, Y. S., Hsu, H.-
K., Li, W.-Y., 2010. Polarization-free and fast response
microlens arrays using polymer-stabilized blue phase
liquid crystals. Appl. Phys. Lett.
96(11). p. 113505-1–3.
Hsiao, Y.-C., Tan, C.-Y., Lee, W., 2011. Fast-switching
bistable cholesteric intensity modulator. Opt. Express,
19(10). p. 9744–9749.
Kopp, V. I., Fan, B., Vithana, H. K. M., Genack, A. Z., 1998.
Low-threshold lasing at the edge of a photonic stop
band in cholesteric liquid crystals. Opt. Lett. 23(21). p.
1707–1709.
Furumi, S., Yokoyama, S., Otomo, A., Mashiko, S., 2003.
Electrical control of the structure and lasing in chiral
photonic band-gap liquid crystals. Appl. Phys. Lett.
82(1). p. 16–18.
Saito, M., Maruyama, A., Fujiwara, J., 2015. Polarization-
independent refractive-index change of a cholesteric
liquid crystal. Opt. Mater. Express, 5(7). p. 1588-1597.
PHOTOPTICS 2017 - 5th International Conference on Photonics, Optics and Laser Technology
30

Kim, K.-H., Jin, H.-J., Park, K.-H., Lee, J.-H., Kim, J. C.,
Yoon, T.-H., 2010. Long-pitch cholesteric liquid crystal
cell for switchable achromatic reflection. Opt. Express,
18(16). p. 16745–16750.
Born, M., Wolf, E., 1980. Principles of Optics, Pergamon.
Oxford. Chapter 2.
Saito, M., Takeda, R., Yoshimura, K., Okamoto, R.,
Yamada, I., 2007. Self-controlled signal branch by the
use of a nonlinear liquid crystal cell. Appl. Phys. Lett.
91(14), p. 141110-1–3.
Hecht, E., 1998. Optics. Addison-Wesley. Reading, MA.
Chapter 9.
Saito, M. Yasuda, T., 2003. Complex refractive-index
spectrum of liquid crystal in the infrared. Appl. Opt.
42(13). p. 2366–2371.
Reduction of Optical Rotation and Scattering in a Cholesteric Liquid Crystal Layer
31
