
Detection and Orientation Estimation for Cyclists by Max Pooled
Features
Wei Tian and Martin Lauer
Institute of Measurement and Control Systems,
Karlsruhe Institute of Technology, 76131 Karlsruhe, Germany
Keywords:
Cyclist Detection, Orientation Estimation, Max Pooled Features.
Abstract:
In this work we propose a new kind of HOG feature which is built by the max pooling operation over spatial
bins and orientation channels in multilevel and can efficiently deal with deformation of objects in images. We
demonstrate its invariance against both translation and rotation in feature levels. Experimental results show
a great precision gain on detection and orientation estimation for cyclists by applying this new feature on
classical cascaded detection frameworks. In combination of the geometric constraint, we also show that our
system can achieve a real time performance for simultaneous cyclist detection and its orientation estimation.
1 INTRODUCTION
Influenced by the environmental friendly and healthy
lifestyle, the number of people riding bicycles is in-
creasing nowadays (Pape, 2015). In the meanwhile,
the safety of cyclists is still a hot research topic due
to the even more complicated traffic conditions (EU,
2015). To solve this problem technically, various de-
tection systems are developed, which can recognize
cyclists in critical scenarios and warn the other traf-
fic participants to prevent probable accidents. Among
a great number of solutions provided in the market,
including radar, lidar, acoustic and inductive sensors
(Dharmaraju et al., 2002) (Krogmeier and Bullock,
2008), vision-based detection system has become a
favorite choice of industries because of its discrimi-
native power and installation flexibility.
Despite a great success of vision-based detection
approaches achieved for other vulnerable road partic-
ipants such as pedestrians (Doll
´
ar et al., 2012) (Zhang
et al., 2016), the task for cyclist detection still remains
challenging. E.g. in the KITTI benchmark (Geiger
et al., 2012) the number of published detection meth-
ods for cyclists is less than half of that for pedestrians
(Table 1). One of the reasons is that the appearance
of cyclists is significantly influenced by their view-
points, behaviors and the sensor setups. The appear-
ance variation not only results in different aspect ra-
tios but also leads to full or partial translation or rota-
tion of an object in the image (Figure 1). Such kind
of deformation is difficult to deal with. Furthermore,
Table 1: Number of published detection methods for each
object class in the KITTI benchmark till August 2016. The
number of proposed methods for cyclists is less than half
of that for pedestrians, although both of them belong to the
weak traffic participants.
Object
class
Car Pedestrian Cyclist
Number
of methods
25 29 14
in most cases, both the location and the orientation of
cyclists are required to estimate their trajectories and
further to predict probable accidents. This point is
rarely considered in most detection approaches. Last
but not least, the detection system should be able to
run in real time, which is important for most of the
on-road safety systems to react without delays.
To tackle these problems, in this work, we at first
propose a new kind of HOG (Histogram of Oriented
Gradients) feature which is built by a max pooling
operation over spatial bins and orientation channels in
multilevel. To calculate this kind of feature efficiently,
we implement a framework utilizing a pipeline fash-
ion. The robustness of this new feature against both
translation and rotation of objects can be demon-
strated in feature levels. In addition to that, we present
a framework, which is in combination with this kind
of new feature and can achieve good performance on
simultaneous detection and orientation estimation for
cyclists. With the help of geometric constraints, we
show that our detector is capable for real time appli-
cations.
Tian W. and Lauer M.
Detection and Orientation Estimation for Cyclists by Max Pooled Features.
DOI: 10.5220/0006085500170026
In Proceedings of the 12th International Joint Conference on Computer Vision, Imaging and Computer Graphics Theory and Applications (VISIGRAPP 2017), pages 17-26
ISBN: 978-989-758-226-4
Copyright
c
2017 by SCITEPRESS – Science and Technology Publications, Lda. All rights reserved
17
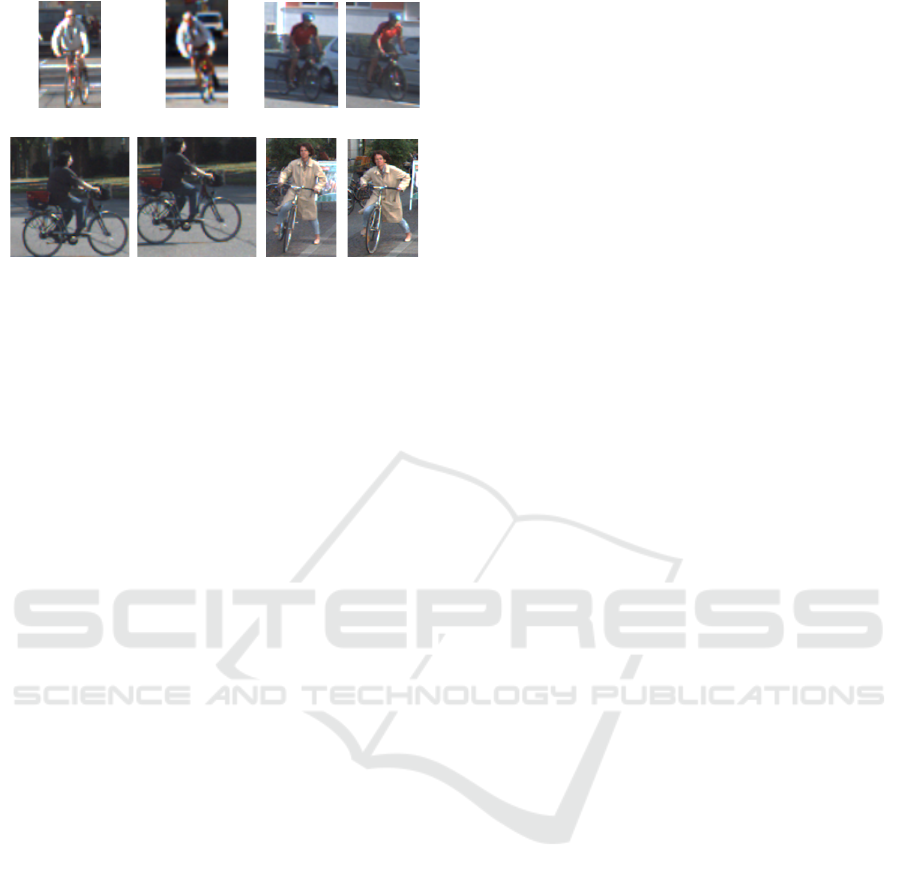
(a) (b) (c) (d)
(e) (f) (g) (h)
Figure 1: KITTI image samples. Image (b) represents a full
rotation of an object by 20
◦
in comparison with image (a).
The partial rotation of an object is presented by image pairs
(c)-(d), i.e. the torso of the cyclist in image (d) is rotated
by 15
◦
, comparing with image (c). Image pairs (e)-(f) show
the full translation of an object in the side view. Compared
to image (g), the head of the cyclist has a lower position in
image (h), which corresponds to a partial translation.
2 RELATED WORKS
In the last decade numerous research works have
been published about object detection. The feature
family meets an explosive growth of its members,
e.g. Haar (Viola and Jones, 2004), HOG (Dalal
and Triggs, 2005), LBP (Ojala et al., 2002), sp-Cov
(Paisitkriangkrai et al., 2015), deep features (Girshick
et al., 2015) and their extensions (Doll
´
ar et al., 2009)
(Zhang et al., 2015). The detector structure is also
becoming even more complicated, varying from cas-
cades (Benenson et al., 2012) to DPMs (Felzenszwalb
et al., 2008) and CNNs (Jia et al., 2014). While most
of the proposed methods are focused on detecting
pedestrians, cyclist detection also becomes an inter-
esting point among the research community.
In early works, several models are proposed to
represent bicycles, e.g. by wheel shapes (Rogers and
Papanikolopoulos, 2000), by edges and motion (Qui
et al., 2003) and even by DPMs (Cho et al., 2010).
Despite high detection rates achieved, without con-
sidering the bicycle riders, their classification power
can be disturbed in scenarios like bicycle park sta-
tions. In comparison, Li et al. uses HOG-LP (Li et al.,
2010) and Takahashi et al. takes advantage of pedal-
ing movement (Takahashi et al., 2010) to detect cy-
clists mainly in crossing cases, with limited applica-
tions. For multi-view detection, an approach combin-
ing RGB image with lidar measurements is presented
by Gonzalez et al. in (Gonzlez et al., 2015), yet inap-
propriate for monocular camera systems. Xiang et al.
integrates subcategory detection into region proposals
(Xiang et al., 2016), still at a relative high computa-
tional cost. In our previous work (Tian and Lauer,
2015a) (Tian and Lauer, 2015b), we build viewpoint
specific models but the detection suffers from the ap-
pearance variation. To deal with object deformation,
Zou (Zou et al., 2014) and Paisitkriangkrai (Paisitkri-
angkrai et al., 2015) choose spatially pooled features
and Pepik (Pepik et al., 2015) introduces 3-D DPM.
Although they achieve high precision, their detec-
tors cannot run in real time and the rotation handling
is not included. As deep learning becomes a trend,
by applying CNN with region proposals, Chen et al.
achieves the best results both for cyclist detection and
orientation estimation at one time (Chen et al., 2015).
By integrating the cascade concept, the detection pre-
cision and speed are further improved in (Yang et al.,
2016). But the cost is still a high performance GPU.
Although such kind of GPUs can be facilitated with
more and more equipments nowadays and run much
faster than normal CPUs, the large consumption of
memory and even of power make themselves inap-
propriate for products with limited budgets.
In this paper we show that with the help of max
pooling, even low level visual features, i.e. HOG, can
efficiently deal with both translation and rotation of
objects in images. We also give a demonstration in
feature levels. Moreover, we integrate these new fea-
tures into our previous framework (Tian and Lauer,
2015b) and extend it with an orientation estimator,
which runs almost simultaneously with the object de-
tector. We conduct experiments on the KITTI dataset
and show that the max pooled features contribute to
a significant performance gain both on detection and
orientation estimation for cyclists.
3 DEFORMATION INVARIANT
FEATURES BY MAX POOLING
The max pooling operation arises from the concept of
CNNs to construct the deep network layers. (Xiong
et al., 2015) (He et al., 2015) The principle is to ap-
ply a filter mask over a feature map and to search the
maximum value inside it. As long as the maximum
is not changed, the output value is not influenced by
its location within the mask. Inspired by that, we can
also apply max pooling on low level visual features
to obtain the deformation invariance. Here we choose
the HOG features from (Felzenszwalb et al., 2008) as
the base, not only due to their strong discriminative
power but also because both spatial and orientation
information are included. In fact, the original HOG
features are not translation or rotation invariant. Al-
though interpolation is recommended on both spatial
VISAPP 2017 - International Conference on Computer Vision Theory and Applications
18
and orientation bins, it can only deal with small ap-
pearance variations. Regarding this, we introduce the
max pooling with different scales to build deforma-
tion invariant HOG features.
Note that max pooling is also applied in other fea-
tures such as the sp-Cov (Paisitkriangkrai et al., 2015)
and Regionlets (Zou et al., 2014), but our work differs
from them in 3 points.
• Unlike the covariance patterns utilized in
(Paisitkriangkrai et al., 2015), in this work,
we only focus on the HOG features and their
performance improvement by additional max
pooling procedure.
• Instead of random feature selection in (Zou et al.,
2014), we apply a dense max filtering with differ-
ent scales.
• We additionally conduct max pooling on orienta-
tion histograms to handle object rotations, which
makes another significant difference.
3.1 Translation Invariant HOG
Features
For translation invariance we follow the idea in
(Paisitkriangkrai et al., 2015) and apply the max fil-
ters directly on each feature channel. Here we care-
fully choose 4 filter mask sizes: 1x1, 2x2, 3x3 and
4x4 pixels, so that none of them is greater than the
smallest dimension of our detector models. The strid-
ing step for each filter is set to 1 pixel and the input
channels are padded with an appropriate number of
border pixels so that the output feature channels will
have the same size as the inputs.
Instead of performing max filtering in each scale
separately, here we use an iterative approach for com-
putational efficiency. The calculation is done in a
pipeline. Each stage is a max pooling operation with
a mask size of 2x2 pixels. The filtered features from
the previous stage are reused as the inputs for the next
stage. This is equivalent to a decomposition of bigger
filters into several smaller ones. E.g. the output after
a two stage filtering is the same as that filtered by a
mask of 3x3 pixels (Figure 2). And this output can be
reused to obtain the filtered feature map by the mask
of 4x4 pixels with the help of only one more stage fil-
tering in the pipeline. In this way, the processing time
for each filter size is constant and only dependent on
the number of utilized filters.
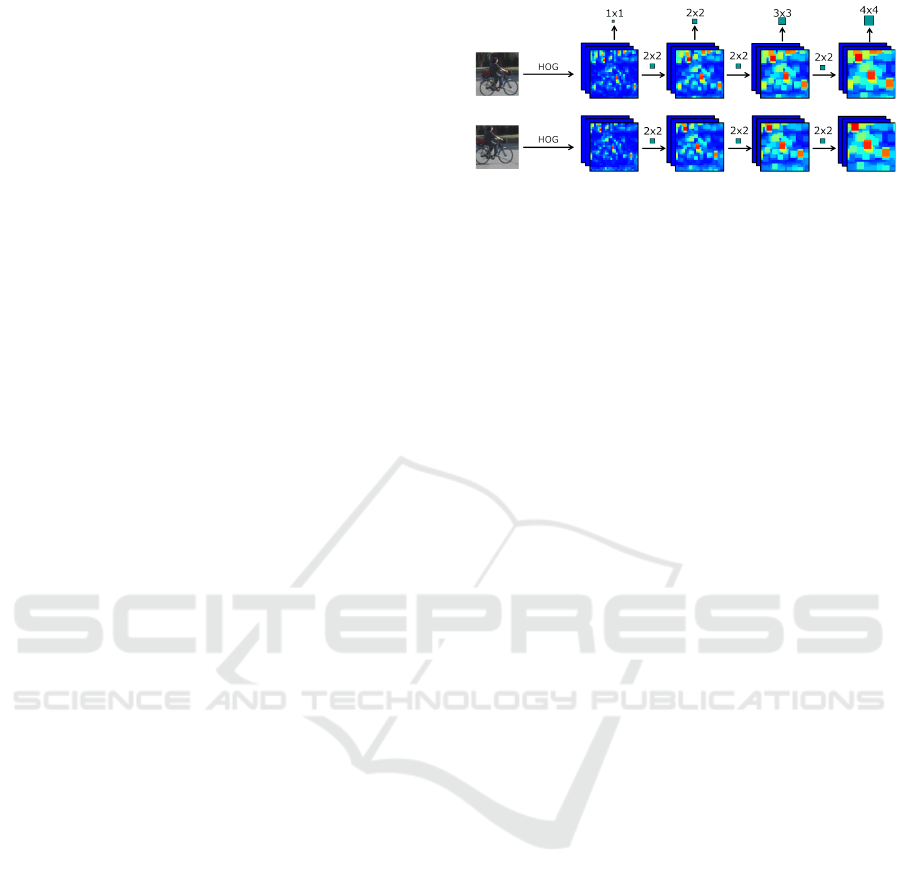
To explore the translation invariance of filtered
channels, we take the sample pair of full translation
from Figure 1 to execute experiments. As in Figure 2,
these two images have an overlap ratio of 0.7, which
can be resulted from an improper striding step of the
Figure 2: Calculating translation invariant HOG features.
On the top are max filters with 4 mask sizes: 1x1, 2x2, 3x3
and 4x4. The first size corresponds to the naive HOG fea-
tures. On the left side are two samples with full translation
and an overlap ratio of 0.7. The HOG features are calculated
for each image and illustrated in temperature map. The max
filters are applied on each channel in a pipeline fashion.
detection window or from an inappropriate scaling
factor of the image. Here we also omit the discus-
sion about partial translation because it can be divided
into fully translated and unchanged parts. As for ex-
periment, we calculate the HOG features for each im-
age and filter them by max pooling in different scales
sequentially. To measure the similarity between the
features of both images, we calculate the correlation
coefficient for each filtered channel between the two
images and sort the results into 4 groups according
to the size of filter masks. Distributions of coefficient
values for each filter size are illustrated by the boxplot
in Figure 3. As can be seen, the high values of cor-
relation coefficients are obtained by big filters, which
means the HOG features of both images filtered by
bigger masks are more similar to each other despite
that the same object is translated in the second im-
age. Thus, the spatially max pooled features become
more robust against translations, which is in accor-
dance with the conclusion from (Zou et al., 2014).
To model translations in different scales, we con-
catenate the filtered channels by all the above masks
(including the filter mask 1x1) to each other as new
features. We do it in this way because of two points.
On one hand, we would like to keep the discrimina-
tive power of the naive HOG features and to avoid the
drop of detection accuracy by only using blurred fea-
tures from max filtering. On the other hand, we expect
the improvement of detection on translated images,
especially with the help of the new features, which
are filtered by bigger masks. In this case, the channel
number of HOG features is quadrupled. Here we call
the spatially pooled HOG features as maxHOG
T
.
3.2 Rotation Invariant HOG Features
As gradient orientations are discretized in equidistant
histogram bins, the rotation of an object has influence
mainly on their distribution not on the bin sums. Here
Detection and Orientation Estimation for Cyclists by Max Pooled Features
19
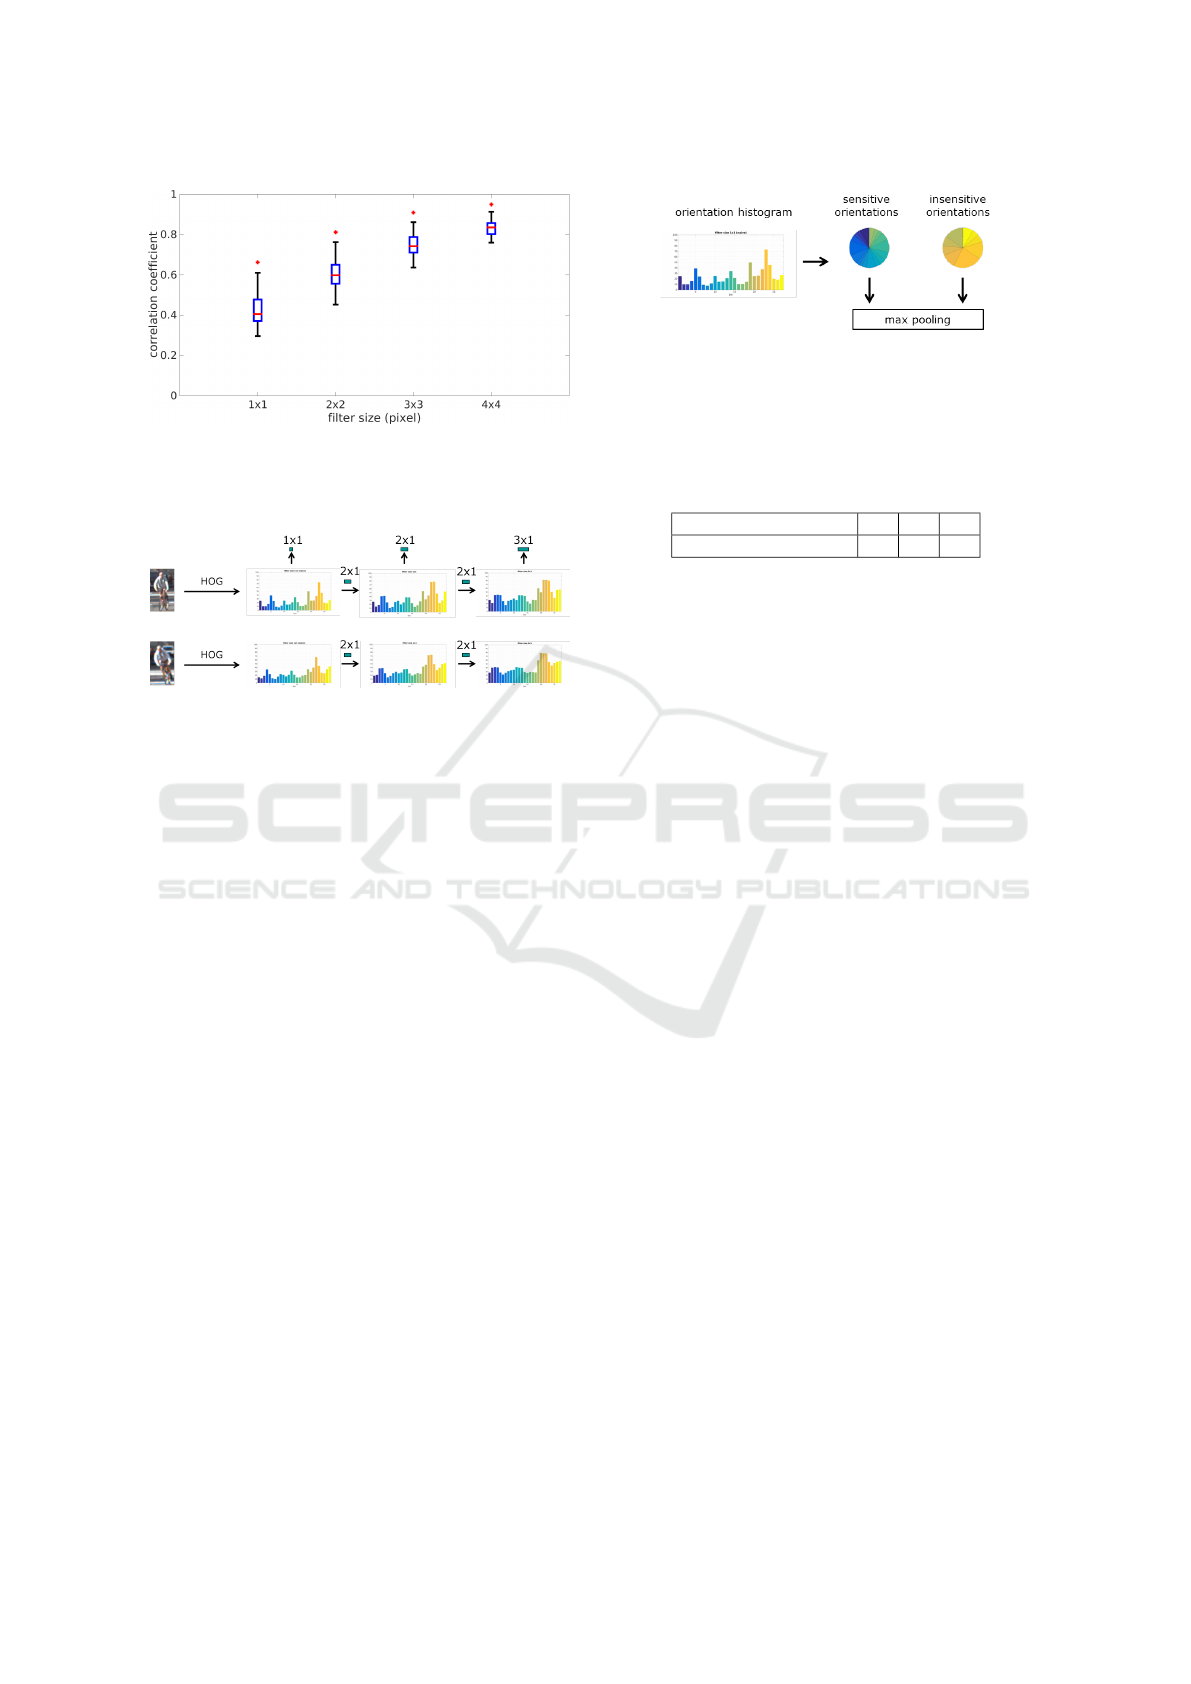
Figure 3: Correlation coefficient values for each filter size
are illustrated by the boxplot. The median value is indicated
by a red short line. The blue box represents 50 percentile of
the data. The red point denotes the outlier.
Figure 4: Calculating rotation invariant HOG features. On
the top are max filters with 3 mask sizes: 1x1, 2x1 and 3x1.
The first size corresponds to the naive HOG features. On
the left side are two samples with full rotation and the gap
of roll angle is 20
◦
. The HOG features are calculated for
each image. The max filters are applied on each histogram
in a pipeline.
we have totally 27 bins (18 sensitive and 9 insensitive
orientation bins, same as (Felzenszwalb et al., 2008)).
We also apply max filtering on the histogram with 3
mask sizes: 1x1, 2x1 and 3x1. The striding step is
set to 1 orientation bin. As the last filter size corre-
sponds to a maximal rotation of 60
◦
, which is accept-
able for cyclists in most cases, we do not use even
bigger masks. The filtered channels are also calcu-
lated in a pipeline fashion by decomposing the biggest
filter mask into two smaller ones, each with a size of
2x1 pixels, as illustrated in Figure 4.
Aware that the orientation bins are actually located
in a circular form, the max filtering should also be
done in the same way. Here we divide the orientation
histogram into 2 groups, which represent the sensi-
tive and the insensitive orientations respectively. For
each of them we link the first and the last orientation
bin to build a ring shape (Figure 5). These new his-
tograms will be processed by max pooling operation
separately.
To verify the rotation invariance of filtered fea-
tures, we also take the sample pair of full rotation
from Figure 1. With the same reason, we omit the
discussion about partial rotations. We calculate the
orientation histograms for each image and perform
Figure 5: Orientation histogram is divided into 2 groups,
which represent the sensitive and the insensitive orienta-
tions respectively. For each of them we link the first and
the last orientation bin to build a ring shape. These new
histograms will be processed by max pooling separately.
Table 2: Correlation coefficient of each filter size applied
on orientation histograms.
Filter size 1x1 2x1 3x1
Correlation coefficient 0.54 0.69 0.82
the max filtering in 3 scales as in Figure 4. Then
we compute the correlation coefficients for each fil-
tered histogram between both images. The coefficient
value of each filter size is registered in Table 2. Obvi-
ously, the similarity between histograms of both im-
ages increases with bigger filter masks, which infers
the HOG features become more robust against rota-
tions.
In the same way, we concatenate the filtered
feature channels by different masks (including the
filter mask 1x1). This new kind of feature is
called as maxHOG
R
and utilized in combination with
maxHOG
T
for cyclist detection.
For an intuitive comparison of the classification
power between the naive HOG features and the pro-
posed new ones, we conduct principal component
analysis (PCA) on both of them. Here we randomly
select 2000 positive and negative samples for the front
view of cyclists. We calculate HOG features for each
sample and perform max filtering both on spatial and
orientation bins. We project the sample features onto
the first two principal components from PCA and plot
them for each HOG feature type in Figure 6. Obvi-
ously, with the help of max filtering either on spa-
tial or on orientation bins, the positive and negative
samples can be better distinguished form each other
than only with the naive HOG features, which is the
benefit from dealing with object deformations. For
a quantitative analysis of the classification power of
each HOG type, please refer to Section 5.
4 DETECTION FRAMEWORK
Here we reuse our previous framework from (Tian
and Lauer, 2015b) due to its capability for multi-view
detection and computational efficiency. The view-
VISAPP 2017 - International Conference on Computer Vision Theory and Applications
20
(a) (b)
(c) (d)
Figure 6: PCA for 2000 positive and negative samples,
which are represented in blue and red respectively. Totally
we calculate 4 different HOG feature types for each sample:
(a) the naive HOG, (b) the maxHOG
T
, (c) the maxHOG
R
and (d) the maxHOG (maxHOG
T
+ maxHOG
R
) features.
For each kind of feature, we project them onto the first two
principal components of PCA.
points of cyclists are divided in 8 subcategories, each
with a range of 45
◦
(Figure 7). For each subcategory
a cascaded detector is built, consisting of n decision
forests (DF) and 1 support vector machine (SVM
C
) at
the last stage (Figure 8). The number of n is chosen
between 2 to 3, which is a trade-off between detec-
tion precision and processing time (Tian and Lauer,
2015b). The detectors are applied in sliding window
fashion with 3 aspect ratios: 0.5 for viewpoint II and
VI, 1.0 for IV and VIII, and 0.75 for the others. The
minimal window height is set to 80 pixels.
4.1 Feature Processing and Orientation
Estimation
The processing of HOG features is divided into two
steps: max pooling over spatial and orientation bins.
In the second step, we apply max filters not only on
the naive HOG features but also on the spatially fil-
tered ones. By doing this, we are able to deal with
simultaneous translation and rotation of objects. Note
that there are 4 channels of summed gradients from
(Felzenszwalb et al., 2008), which do not contain the
orientation information, we only perform spatial max
filtering on those channels. We call the processed
HOG features as maxHOG. Since only bitwise oper-
Figure 7: Viewpoints of cyclists are divided into 8 equidis-
tant subcategories I to VIII.
ations are performed, the whole max pooling proce-
dure can be done very fast. E.g. for an KITTI image,
it takes only about 0.02 seconds (Table 3). Such new
features are calculated for samples from the KITTI
dataset to train our detectors. The decision trees have
a depth of 2 and are trained by AdaBoost. The de-
tector from a previous cascade stage will be tested on
predefined image set to gather false positives, which
are used as negative samples to train the classifier
in the next stage. For further details about training
and implementation please refer to (Tian and Lauer,
2015b).
Since the orientation of cyclists are continuous
values, a direct approximation by the discrete view-
points can increase the estimation errors. Instead, we
add another support vector machine SVM
R
for regres-
sion. As shown in Figure 8, we reuse the detection
results of the cascaded detector as inputs for SVM
R
.
Regarding that the number of processed samples at
the last stage is small due to the strong filtering of
frontal DFs, the additional computational cost for the
orientation estimation is also little, i.e. about 0.005
seconds per image (Table 3). Therefore, both the cy-
clist detection and orientation estimation can be done
almost simultaneously. To train the regression stage,
we use the same samples as for training the detectors.
For further improving processing efficiency, at the
beginning of the detection, we only apply the de-
tectors on the given image. The final object hy-
potheses are obtained by performing non-maximum-
suppression on the outputs of all individual detectors.
The orientation estimation is only performed on the
detection results with the highest scores.
4.2 Selective Detection by Geometric
Constraints
Given a fixed striding step, the number of searching
locations grows with the square of the image size and
Detection and Orientation Estimation for Cyclists by Max Pooled Features
21
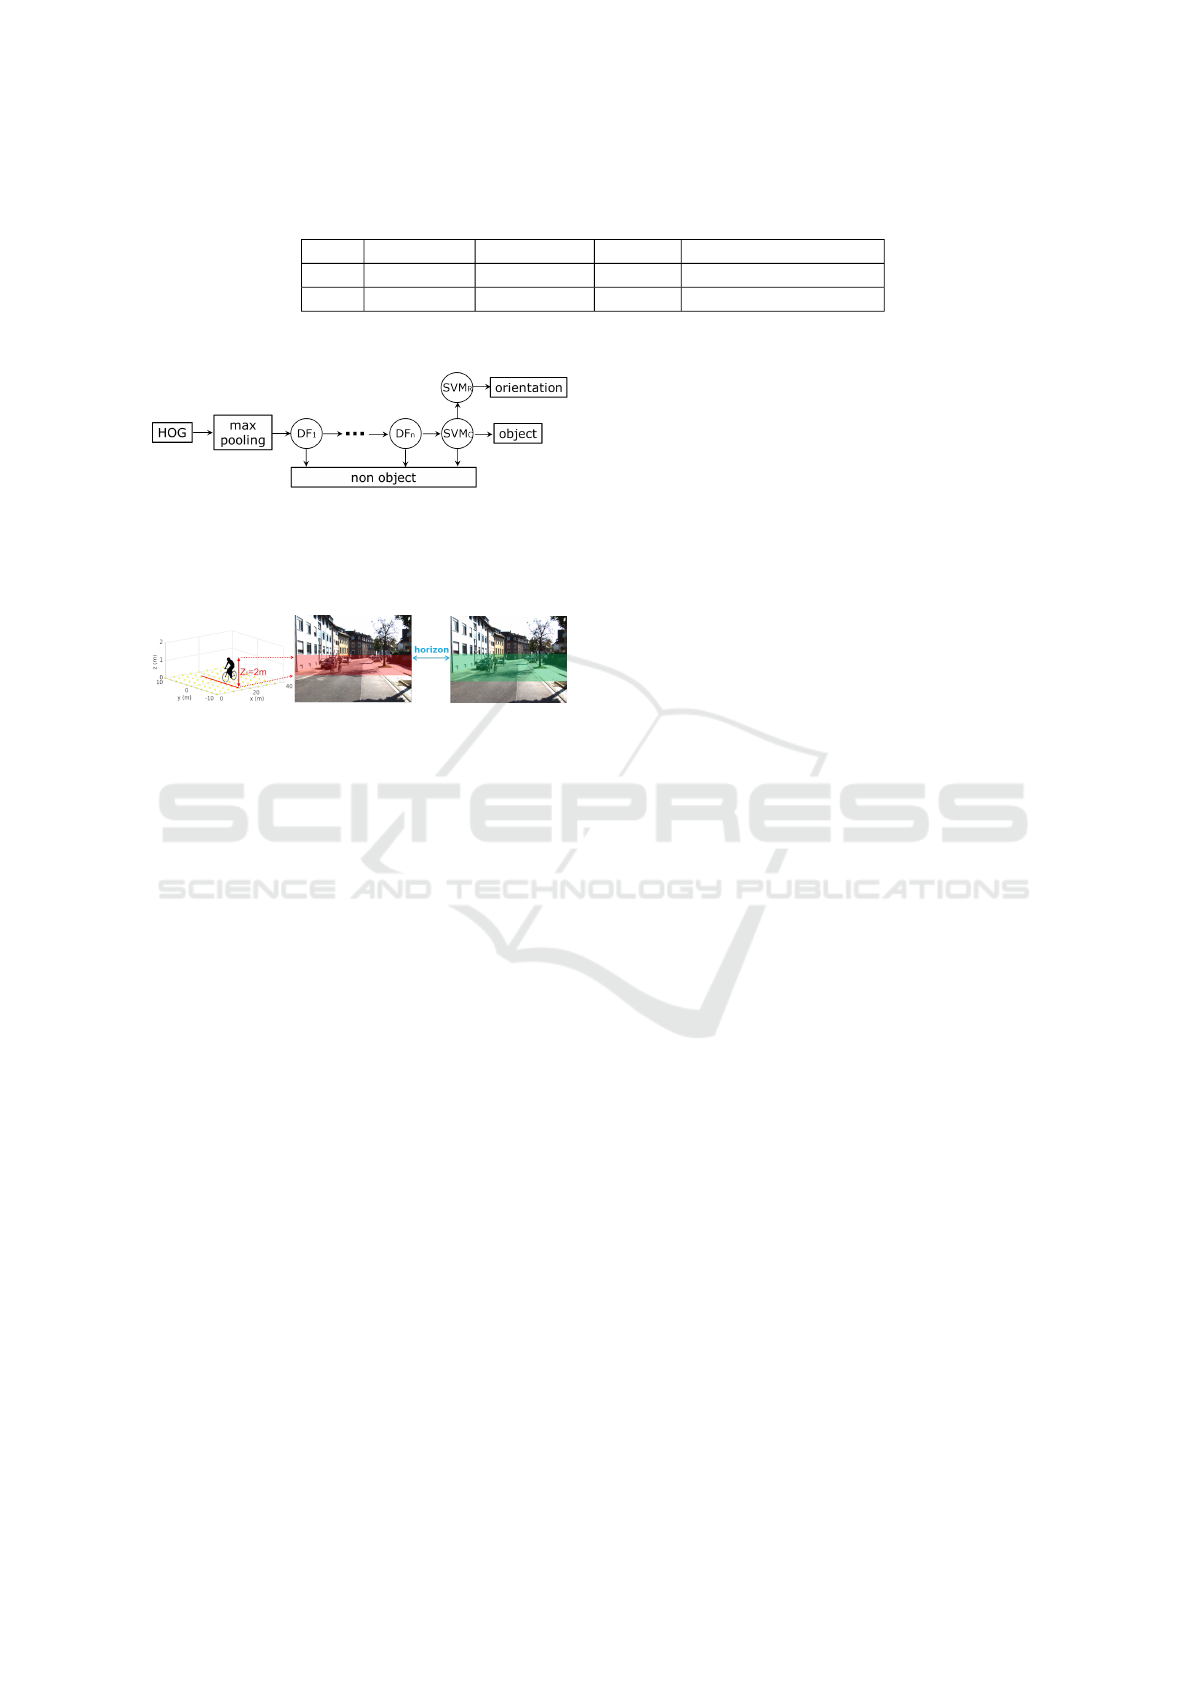
Table 3: Average processing time for each step in the cascade. +ROI denotes integration of ROI extraction by geometric
constraint into the detection framework.
+ROI naive HOG max pooling detection orientation estimation
no 0.106 s 0.024 s 0.090 s 0.005 s
yes 0.036 s 0.008 s 0.031 s 0.002 s
Figure 8: Cascaded detector, consisting of n decision forests
DF
1
to DF
n
and one stage of support vector machine
SVM
C
. The additional SVM
R
is for orientation estimation.
The naive HOG features are preprocessed by max pooling
operation and then given into the detector.
(a) (b)
(c)
Figure 9: Geometric constraint. (a) illustrates an object with
a height of 2 meters in the real world. The corresponding
region in the camera image with an object height of 80 pix-
els is indicated in (b) by the color red. The green region
in (c) represents the region of objects with a varying height
from 1 to 2 meters. The blue arrow denotes the estimated
horizon position.
so is the processing time. This fact makes some appli-
cations with high resolution images inefficient, if fur-
ther details on objects like head orientations or body
poses are interested. To solve this problem, one of
the common approaches is to extract region of inter-
est (ROI) in images, where objects can appear.
Here we prefer the geometric constraint (Tian
and Lauer, 2015b) (Sudowe and Leibe, 2011), which
does not require additional sensor information and the
computational burden is mere. The key idea of this
approach is to mathematically formulate the depen-
dence between the height h of an object and its ground
coordinates [u,v] in the image. This dependence is
called geometric constraint. As shown in Figure 9 (a)
and (b), given detectors with a height of 80 pixels and
assuming a real height of 2 meters, the objects can
only appear in a small image region between two hor-
izontal lines. For varying heights in the 3-D world,
e.g. from 1 meter to 2 meters, the corresponding ROI
will be vertically increased, but only by a few pixels,
as in Figure 9 (c). Since detection only takes place in
this small region, the processing time can be greatly
reduced, by about 2/3 in our case (Table 3).
5 EXPERIMENT RESULTS
In the following experiments, we explore the perfor-
mance of our detection system by evaluating it with
the KITTI dataset, which consists of 7518 test images
with a size of 1242 × 375 pixels. These images are
taken in various traffic scenes including rich number
of objects, such as cars, pedestrians and cyclists. As
the smallest object evaluated by KITTI benchmark is
25 pixels high and our detector has a minimal height
of 80 pixels, we just scale the test images by a factor
of 3. For processing efficiency, we also apply the geo-
metric constraint with the help of provided calibration
data and turn on the multi-threading. Our test com-
puter is equipped with an Intel core of i7-3740QM
and a memory of 8 GB.
The first experiment was carried out to reveal the
performance gain of the max pooling operation on
HOG features. Here we compare the test results with
3 feature types: the naive HOG features, the spatially
pooled maxHOG
T
and the maxHOG features, with
max filtering both on spatial and orientation bins. The
corresponding precisions both on detection and ori-
entation estimation for cyclists are listed in Table 4
and 5. The precision-recall-curves are illustrated in
Figure 10. Apparently, with the help of spatial max
pooling in different scales, the average precision of
the approach with naive HOG features is increased
by about 10% for all difficulty levels, which benefits
from a better handling of translation of objects. Addi-
tionally, it can be further pushed by about 6%, if the
max pooling is also applied on orientation histograms,
which proves the ability of our new features in dealing
with rotations.
Compared to that, a similar trend of precision gain
can also be seen with the orientation estimation for
cyclists. In fact, the test results of estimated orien-
tation may not be necessarily consistent with the re-
sults of detections. However, in our approach, both of
them are strongly correlated with each other. This fact
implies that our orientation estimator works well for
accurately detected cyclists. It also explains why the
average precision of orientation estimation is slightly
lower than that of detection, because both the detec-
tion and orientation approximation errors are accumu-
lated in this case.
VISAPP 2017 - International Conference on Computer Vision Theory and Applications
22
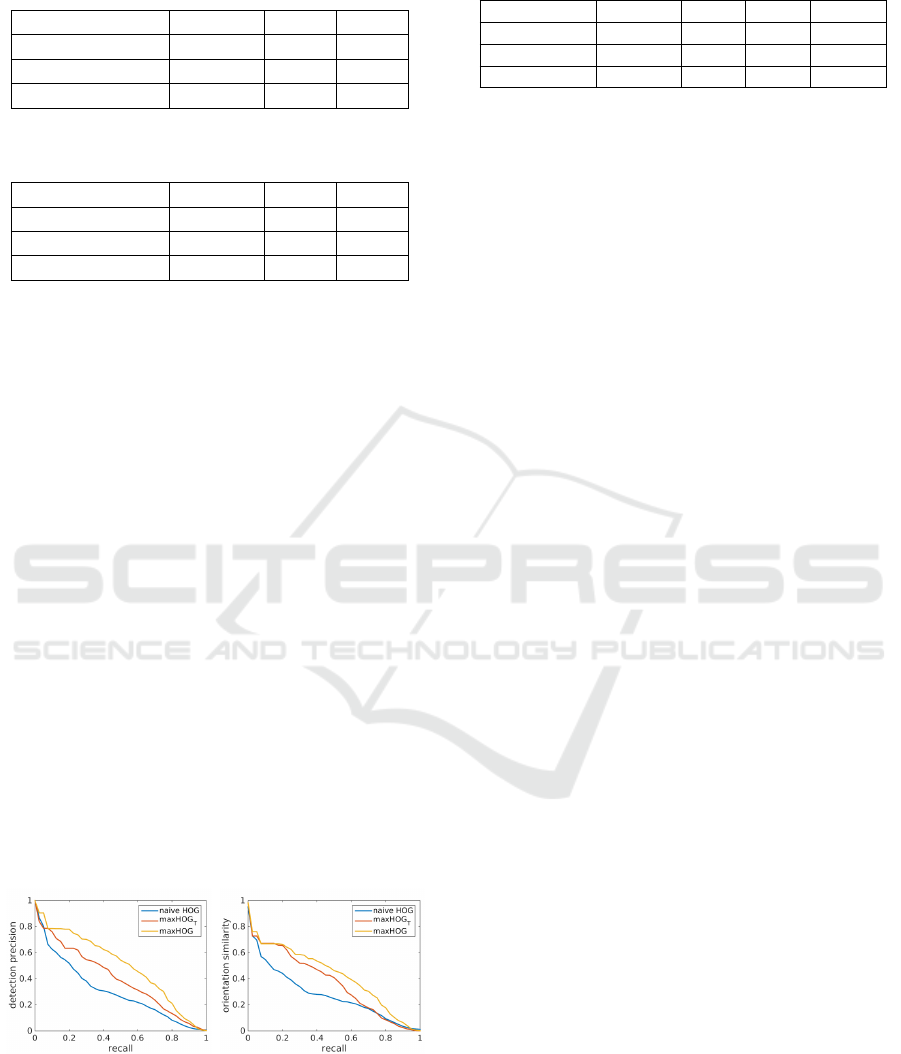
Table 4: Average precision of cyclist detection with differ-
ent HOG features. +ROI denotes ROI extraction by geo-
metric constraint.
Method Moderate Easy Hard
naive HOG + ROI 27.32% 29.74% 25.47%
maxHOG
T
+ ROI 38.63% 41.88% 34.24%
maxHOG + ROI 43.58% 48.38% 38.73%
Table 5: Average precision of orientation estimation for cy-
clists with different HOG feature types.
Method Moderate Easy Hard
naive HOG + ROI 22.15% 24.71% 20.93%
maxHOG
T
+ ROI 32.97% 35.68% 29.11%
maxHOG + ROI 38.28% 41.82% 34.27%
In the next step, we conduct experiments with dif-
ferent scaling factors of KITTI images. Here we ap-
ply the max pooling operation both on spatial and ori-
entation bins of HOG features, as this configuration
yields the best results. Corresponding detection pre-
cision and processing time are listed in Table 6. Obvi-
ously, both their values decrease if the scaling factor
shrinks. Note that both the geometric constraint and
multi-threading are utilized in our experiments, the
processing time is not exactly square proportional to
the image size. And for an image without scaling (i.e.
the scaling factor equals 1), the processing time is re-
duced to only 0.08 seconds, yet the precision is about
10% less than the best one. One point to be mentioned
is that the evaluation by KITTI is performed while a
lot of objects with small image sizes are considered
(Rajaram et al., 2015). If we are only interested in
objects within a small distance range, then no scaling
is necessary and our detector can also yield both a rea-
sonable precision value and a runtime speed of more
than 10 frames per second (fps), which is sufficient
for most real time requirements.
In another experiment we analyze the perfor-
mance of our detection system in comparison with
(a) (b)
Figure 10: Precision-recall-curves of cyclist detection and
orientation estimation are respectively plotted in (a) and
(b). Here we present curves in easy level with 3 feature
types: the naive HOG, the spatially pooled maxHOG
T
and
the maxHOG features with max filtering both on spatial and
orientation bins.
Table 6: Average detection precision and processing time
with different scaling factors of KITTI image.
Scaling factor Moderate Easy Hard Runtime
1 33.25% 37.88% 29.69% 0.08 s
2 39.17% 43.14% 34.98% 0.17 s
3 43.58% 48.38% 38.73% 0.25 s
other published methods in the KITTI benchmark.
For fairness, the average precision of cyclist detection
and orientation estimation are compared separately,
since not all the proposed methods take simultane-
ous detection and orientation estimation into count.
Their corresponding precision values are are listed
in Table 7 and 8 respectively. Additionally, we give
an overview about their processing time with respect
to the corresponding hardware environments. As can
be seen, our proposed method especially outperforms
the DPM-based approaches in the ranking list. One
reason is that, although the DPMs can also deal with
translation of objects, by including rotation invariant
features, our approach is more efficient to handle ob-
ject deformation.
Nevertheless, there is still a gap of up to 30% in
accuracy between our proposed method and the top
performed ones (actually the top 5 in Table 7) . We
owe it to the classification power of the feature itself.
As all of them use deep features, comparing with the
HOG features alone in our approach, they can capture
more information from the object and thus their detec-
tors are more discriminative. Therefore, the next step
in our future work may be to integrate these deep fea-
tures into our current framework to further improve
the detection performance. However, better accuracy
comes at the cost of large computation time and high
performance hardware (e.g. GPUs). In comparison,
our method yields a runtime performance of about 4
fps on a quad-core CPU. Considering that we have
scaled the test image by a factor of 3 to fit the small
objects to our detectors, we can also promise an even
faster processing ability such as 12 fps (Table 6) in
use cases, in which only objects not far away from
the camera are considered, e.g. to monitor the cy-
clists, which are located in the nearby blind field of a
truck.
6 CONCLUSION
Cyclist detection becomes an essential part of the
modern intelligent transportation systems, as their
safety draws even more attention from the publics.
Despite numerous vision-based methods proposed,
the state-of-the-art techniques either are troublesome
Detection and Orientation Estimation for Cyclists by Max Pooled Features
23

Table 7: Average precision on cyclist detection of published methods on KITTI benchmark till August 2016. Proposed method
of this work is marked in bold.
Method Moderate Easy Hard Runtime Environment
SDP+RPN (Yang et al., 2016) 73.74% 81.37% 65.31% 0.4 s GPU@2.5Ghz
SubCNN (Xiang et al., 2016) 71.06% 79.48% 62.68% 2 s GPU@2.5Ghz
3DOP (Chen et al., 2015) 68.94% 78.39% 61.37% 3 s GPU@2.5Ghz
Mono3D (Chen et al., 2016) 66.36% 76.04% 58.87% 4.2 s GPU@2.5Ghz
SDP+CRC (ft) (Yang et al., 2016) 61.31% 74.08% 53.97% 0.6 s GPU@2.5Ghz
Regionlets (Zou et al., 2014) 58.72% 70.41% 51.83% 1 s 12 cores@2.5Ghz
maxHOG+ROI 43.58% 48.38% 38.73% 0.25 s 4 cores@2.5Ghz
MV-RGBD-RF (Gonzlez et al., 2015) 42.61% 52.97% 37.42% 4 s 4 cores@2.5Ghz
pAUCEnsT (Paisitkriangkrai et al., 2015) 38.03% 51.62% 33.38% 60 s 1 core@2.5Ghz
Vote3D (Wang and Posner, 2015) 31.24% 41.43% 28.60% 0.5 s 4 cores@2.8Ghz
DPM-VOC+VP (Pepik et al., 2015) 31.08% 42.43% 28.23% 8 s 1 core@2.5Ghz
LSVM-DPM-us (Felzenszwalb et al., 2010) 29.88% 38.84% 27.31% 10 s 4 cores@3.0Ghz
DPM-C8B1 (Yebes et al., 2014) 29.04% 43.49% 26.20% 15 s 4 cores@2.5Ghz
LSVM-DPM-sv (Felzenszwalb et al., 2010) 27.50% 35.04% 26.21% 10 s 4 cores@3.0Ghz
mBoW (Behley et al., 2013) 21.62% 28.00% 20.93% 10 s 1 core@2.5Ghz
Table 8: Average precision on orientation estimation for cyclists of published methods on KITTI benchmark till August 2016.
Proposed method of this work is marked in bold.
Method Moderate Easy Hard Runtime Environment
SubCNN (Xiang et al., 2016) 63.65% 72.00% 56.32% 2 s GPU@2.5Ghz
3DOP (Chen et al., 2015) 58.68% 70.13% 52.35% 3 s GPU@2.5Ghz
Mono3D (Chen et al., 2016) 54.97% 65.56% 48.77% 4.2 s GPU@2.5Ghz
maxHOG+ROI 38.28% 41.82% 34.27% 0.25 s 4 cores@2.5Ghz
DPM-VOC+VP (Pepik et al., 2015) 23.17% 30.52% 21.58% 8 s 1 core@2.5Ghz
LSVM-DPM-sv (Felzenszwalb et al., 2010) 22.07% 27.54% 21.45% 10 s 4 cores@3.0Ghz
DPM-C8B1 (Yebes et al., 2014) 19.25% 27.25% 17.95% 15 s 1 core@2.5Ghz
to handle the appearance deformation of image ob-
jects or are difficult to provide a real time perfor-
mance. The contribution of this work is based on two
key ideas: firstly, we propose a new kind of feature
which can efficiently deal with both translation and
rotation of objects in images, based on max pooling
over spatial and orientation histogram bins in multi-
level. In addition, we present a cascaded framework,
which is able to conduct cyclist detection and orien-
tation estimation simultaneously due to shared struc-
ture and visual features. The evaluation on the KITTI
benchmark demonstrates good accuracy of our ap-
proach at a comparable small computation cost. Ex-
periments also have shown that, leveraging the fast
implementation of feature preprocessing (i.e. multi-
scale max pooling of HOG features) and geometric
constraint, our system is able to run in real time (vary-
ing from about 4 to 12 fps according to configura-
tions), especially promising for applications on hard-
wares with limited performance.
REFERENCES
Behley, J., Steinhage, V., and Cremers, A. B. (2013). Laser-
based segment classification using a mixture of bag-
of-words. In IEEE Conference on Intelligent Robots
and Systems.
Benenson, R., Mathias, M., Timofte, R., and Van Gool, L.
(2012). Pedestrian detection at 100 frames per second.
In IEEE Conference on Computer Vision and Pattern
Recognition (CVPR).
Chen, X., Kundu, K., Zhang, Z., Ma, H., Fidler, S., and Ur-
tasun, R. (2016). Monocular 3D Object Detection for
Autonomous Driving. In IEEE Conference on Com-
puter Vision and Pattern Recognition (CVPR).
Chen, X., Kundu, K., Zhu, Y., Berneshawi, A. G., Ma, H.,
Fidler, S., and Urtasun, R. (2015). 3D Object Propos-
als for Accurate Object Class Detection. In Advances
in Neural Information Processing Systems (NIPS).
Cho, H., Rybski, P., and Zhang, W. (2010). Vision-based
Bicycle Detection and Tracking using a Deformable
Part Model and an EKF Algorithm. In IEEE Confer-
ence on Intelligent Transportation Systems.
Dalal, N. and Triggs, B. (2005). Histograms of oriented
gradients for human detection. In IEEE Conference
on Computer Vision and Pattern Recognition (CVPR).
VISAPP 2017 - International Conference on Computer Vision Theory and Applications
24

Dharmaraju, R., Noyce, D. A., and Lehman, J. D. (2002).
An Evaluation of Technologies for Automated Detec-
tion and Classification of Pedestrians and Bicyclists.
Doll
´
ar, P., Tu, Z., Perona, P., and Belongie, S. (2009). In-
tegral Channel Features. In British Machine Vision
Conference (BMVC).
Doll
´
ar, P., Wojek, C., Schiele, B., and Perona, P. (2012).
Pedestrian Detection: An Evaluation of the State of
the Art. IEEE Transactions on Pattern Analysis and
Machine Intelligence (PAMI), 34.
EU (2015). Traffic Safety Basic Facts 2015. European Road
Safety Observatory.
Felzenszwalb, P., Girshick, R., McAllester, D., and Ra-
manan, D. (2010). Object Detection with Discrimina-
tively Trained Part-Based Models. IEEE Transactions
on Pattern Analysis and Machine Intelligence (PAMI),
32:1627–1645.
Felzenszwalb, P., McAllester, D., and Ramanan, D. (2008).
A discriminatively trained, multiscale, deformable
part model. In IEEE Conference on Computer Vision
and Pattern Recognition (CVPR).
Geiger, A., Lenz, P., and Urtasun, R. (2012). Are we ready
for Autonomous Driving? The KITTI Vision Bench-
mark Suite. In IEEE Conference on Computer Vision
and Pattern Recognition (CVPR).
Girshick, R., Iandola, F., Darrell, T., and Malik, J. (2015).
Deformable Part Models are Convolutional Neural
Networks. IEEE Conference on Computer Vision and
Pattern Recognition (CVPR).
Gonzlez, A., Villalonga, G., Xu, J., Vzquez, D., Amores, J.,
and Lpez, A. M. (2015). Multiview random forest of
local experts combining rgb and lidar data for pedes-
trian detection. In IEEE Intelligent Vehicles Sympo-
sium (IV).
He, K., Zhang, X., Ren, S., and Sun, J. (2015). Spatial pyra-
mid pooling in deep convolutional networks for visual
recognition. IEEE Transactions on Pattern Analysis
and Machine Intelligence (PAMI).
Jia, Y., Shelhamer, E., Donahue, J., Karayev, S., Long, J.,
Girshick, R., Guadarrama, S., and Darrell, T. (2014).
Caffe: Convolutional Architecture for Fast Feature
Embedding. ACM international conference on Mul-
timedia.
Krogmeier, J. V. and Bullock, D. M. (2008). Inductive Loop
Detection of Bicycles and Inductive Loop Signature
Processing for Travel Time Estimation. Statewide
Wireless Communications Project, 2.
Li, T., Cao, X., and Xu, Y. (2010). An effective crossing cy-
clist detection on a moving vehicle. In World Congress
on Intelligent Control and Automation (WCICA).
Ojala, T., Pietikainen, M., and Maenpaa, T. (2002). Mul-
tiresolution gray-scale and rotation invariant texture
classification with local binary patterns. IEEE Trans-
actions on Pattern Analysis and Machine Intelligence
(PAMI).
Paisitkriangkrai, S., Shen, C., and van den Hengel, A.
(2015). Pedestrian Detection with Spatially Pooled
Features and Structured Ensemble Learning. IEEE
Transactions on Pattern Analysis and Machine Intel-
ligence (PAMI).
Pape, M. (2015). Cycling mobility in the EU. Members’
Research Service, 557013.
Pepik, B., Stark, M., Gehler, P., and Schiele, B. (2015).
Multi-View and 3D Deformable Part Models. IEEE
Transactions on Pattern Analysis and Machine Intel-
ligence (PAMI).
Qui, Z., Yao, D., Zhang, Y., Ma, D., and Liu, X. (2003). The
study of the detection of pedestrian and bicycle using
image processing. In IEEE Conference on Intelligent
Transportation Systems.
Rajaram, R. N., Ohn-Bar, E., and Trivedi, M. M. (2015). An
Exploration of Why and When Pedestrian Detection
Fails. In IEEE Conference on Intelligent Transporta-
tion Systems.
Rogers, S. and Papanikolopoulos, N. (2000). Counting bi-
cycles using computer vision. In IEEE Conference on
Intelligent Transportation Systems.
Sudowe, P. and Leibe, B. (2011). Efficient Use of Geomet-
ric Constraints for Sliding-Window Object Detection
in Video. In Computer Vision Systems, volume 6962,
pages 11–20. Springer Berlin Heidelberg.
Takahashi, K., Kuriya, Y., and Morie, T. (2010). Bicycle
detection using pedaling movement by spatiotemporal
gabor filtering. In TENCON 2010 - IEEE Region 10
Conference, pages 918–922.
Tian, W. and Lauer, M. (2015a). Fast and Robust Cyclist
Detection for Monocular Camera Systems. In Inter-
national joint Conference on Computer Vision, Imag-
ing and Computer Graphics Theory and Applications
(VISIGRAPP).
Tian, W. and Lauer, M. (2015b). Fast Cyclist Detection by
Cascaded Detector and Geometric Constraint. IEEE
Conference on Intelligent Transportation Systems.
Viola, P. and Jones, M. (2004). Robust Real-Time Face
Detection. International Journal of Computer Vision,
(2):137–154.
Wang, D. Z. and Posner, I. (2015). Voting for Voting in
Online Point Cloud Object Detection. In Robotics:
Science and Systems.
Xiang, Y., Choi, W., Lin, Y., and Savarese, S. (2016).
Subcategory-aware convolutional neural networks for
object proposals and detection. arXiv:1604.04693.
Xiong, W., Du, B., Zhang, L., Hu, R., Bian, W., Shen, J.,
and Tao, D. (2015). R2fp: Rich and robust feature
pooling for mining visual data. In 2015 IEEE Interna-
tional Conference on Data Mining (ICDM).
Yang, F., Choi, W., and Lin, Y. (2016). Exploit All
the Layers: Fast and Accurate CNN Object Detector
with Scale Dependent Pooling and Cascaded Rejec-
tion Classifiers. In IEEE Conference on Computer Vi-
sion and Pattern Recognition (CVPR).
Yebes, J. J., Bergasa, L. M., Arroyo, R., and Lzaro, A.
(2014). Supervised learning and evaluation of KITTI’s
cars detector with DPM. In IEEE Intelligent Vehicles
Symposium (IV).
Zhang, S., Benenson, R., Omran, M., Hosang, J. H., and
Schiele, B. (2016). How Far are We from Solving
Pedestrian Detection? Computer Vision and Pattern
Recognition (CVPR).
Detection and Orientation Estimation for Cyclists by Max Pooled Features
25

Zhang, S., Benenson, R., and Schiele, B. (2015). Filtered
channel features for pedestrian detection. In IEEE
Conference on Computer Vision and Pattern Recog-
nition (CVPR).
Zou, W., Wang, X., Sun, M., and Lin, Y. (2014). Generic
Object Detection with Dense Neural Patterns and
Regionlets. In British Machine Vision Conference
(BMVC).
VISAPP 2017 - International Conference on Computer Vision Theory and Applications
26
