
Linking Non-Extensive Entropy with Lempel-ziv Complexity to
Obtain the Entropic Q-index from EEG Signals
Ernane José Xavier Costa, Adriano Rogeri Bruno Tech and Ana Carolina Sousa Silva
Computational and Applied Physscs Lab – Basic Science Department – FZEA, University of São Paulo,
Rua Duque de Caxias Norte, Pirassununga, Brazil
Keywords: Brain Activity, Epilepsy.
Abstract: Physiological data is generated by process that are either nonlinear deterministic or nondeterministic. The
lempel-ziv complexity and non-extensive entropy measurement has been used to quantify information in
physiological data like EEG and EMG. When the functions of brain cells are affected by damage caused by
several disease it is observed changes in the features of the EEG providing useful insight into brain functions
and playing a useful role as a first line of decision-support tool for early detection and diagnosis in brain
diseases. This paper uses a method to identify the q-index in those signals by using the relationships between
entropy definitions given by Lempel-ziv and those given by Tsallis methods. After all, this article shows that,
the q-index can be used to characterize EEG seizure quantifying changes related to the q-entropic index.
1 INTRODUCTION
In the end-1980s the non-extensive entropy or Tsallis
entropy (HTS) was introduced (Tsallis, 1988). The
HTSE is a family of entropies parameterized with a
parameter q named the entropic index or q-index. The
credibility of the HTS was provided by means of the
numerous phenomenological results with a large
number of application and by means several
mathematical proofs for some of the fundamentals of
the HTSE formalism. HTS entropy is based on the
generalized Boltzmann-Gibbs statistical mechanics
with the introduction of the q-index to indicated the
non-extensive degree of a system. Non-extensive
system are those that exhibit long-range correlations
or interactions (Tsallis et al,1997). For each q values
a different HTS is established. Appropriate choice of
the q-index is significant and still remains to be
studied (Tong et al, 2002). Several works use HTS
measures to characterize physiological data like EEG
(Sabeti and Katebi, 2009 ) but the q-index was always
introduced using assumptions and never was directly
calculated (Nagarajan et al, 2008). Another approach
used successfully to quantify nonlinear and
nondeterministic data is the normalized complexity
measurement using Lempel and Ziv algorithm (CLZ).
The CLZ measurement approach uses symbolic
techniques to map a time series into a sequence that
retain its dynamics. The main aspect inside this
method is to partition the samples in the real space
into a finite sequence in the symbolic space. This
partitioning is a nontrivial problem. There are some
efficient methods to analyse physiological data as
described by Nagarajan et. al. (2002) and its
efficiency was evaluated in studies of neural
discharges (Szczpánski, et. al., 2003), event-related
EEG data (Gómez et. al., 2006), magneto
encephalogram (MEG) (Pei et al, 2006), brain injury
evaluation (McBride et al, 2013) and more recently
as a biomarker for detection of Alzheimer's disease
(Al-Nuaimi, et. al., 2016).
There is no evident relationship between H
TS
and
C
LZ
methods and their possible relations are not
discussed in the literature. Therefore, this work will
show that, if is possible the calculation of the
complexity measurement from the data set using
entropic concepts inside the C
LZ
so is possible the
calculation of the q-index for the process that has
generated this data set. In other words, this works is
about one method to able directly calculation of the
q-index using both C
LZ
and H
TS
approach from
physiological data. We will demonstrated that this
methodological approach will be able to quantify the
change in the q-index and then suggest that it can be
used to predict epileptic seizure and discuss a possible
Costa E., Tech A. and Sousa Silva A.
Linking Non-Extensive Entropy with Lempel-ziv Complexity to Obtain the Entropic Q-index from EEG Signals.
DOI: 10.5220/0006077901010105
In Proceedings of the 10th International Joint Conference on Biomedical Engineering Systems and Technologies (BIOSTEC 2017), pages 101-105
ISBN: 978-989-758-212-7
Copyright
c
2017 by SCITEPRESS – Science and Technology Publications, Lda. All rights reserved
101

relationship between functional brain dynamics
changes and q-index.
2 NONEXTENSIVE ENTROPY
Entropy can be understood as a measure of
uncertainty regarding the information content of a
system and can be used to describe their time
evolution. Non-extensive entropy or Tsallis entropy
is a generalization of Shannon entropy (Tsallis, 1988)
and given by:
1
1
1
(1)
Where q is q-index and q>0 and q1. In the limit
of q 1 the Shannon entropy is recovered (Tsallis et
al,1997). The H
TS
is non-extensive in the sense that:
∪
1
(2)
There are three system behaviour described for
H
TS
depending of q-index range. For q-index <1 the
system behaviour is superextensive such that:
∪
(3)
For q-index
1 the system is extensive such that:
∪
(4)
Finally for q-index >1 the system is sub-extensive
such that:
∪
(5)
Therefore, q-index can be used like a measure of
the non-extensivity of the system.
3 THE C
LZ
ALGORITHM
The calculation of complexity was based on the work
of Lempel and Ziv (Lempel and Ziv, 1976), where the
measure c(n) is introduced. The complexity c(n)
measures the number of distinct patterns that must be
copied to reproduce a given string. In practical
application, c(n) is independent of the sequence
length and normalized by a random string that is
meaningful (Zang and Roy, 1999). If the length of the
sequence is n and the number of different symbols is
s, the upper bound of c(n) is given by:
)n( 0 and
)n(log)1(
n
)n(c
n
s
(6)
In general ,
)n(log
n
s
is the upper limit of c(n),
where the base of the logarithm is s , i.e.,
)(log
)()(lim
n
n
nbnc
s
n
(7)
In practical applications b(n) is obtained for a
random string of length n with complexity given by:
)(log
)(
n
hn
nb
k
(8)
where k denotes the number of different characters in
the string, and h denotes the normalized source
entropy given by:
n
i
ii
pp
n
h
1
)ln(
)ln(
1
(9)
where pi is the probability for each state i. The
normalized complexity measure C(n) is given by:
)n(b
)n(c
)n(C
LZ
(10)
For a string Str composed by symbol sequences
s
1
s
2
…s
n
, i.e, Str=( s
1
s
2
…s
n
), the algorithm used
for calculation of c(n) is based on the how Str
can be reconstructed using a given symbol
sequence (
Bachmann et al, 2015). It is assumed
that this symbol sequence has been reconstructed
up to the symbol s
r
and that s
r
has been newly
inserted, i.e., Str = s
1
s
2
…s
r
will denote the
symbol sequence up to s
r
, where the dot indicates
that s
r
is newly inserted. The rest of Str must be
reconstructed by simple copying the previous
sequence or inserting new digits.
3.1 Calculating Q-Index using the CLZ
Algorithm
In fact b(n) in the equation (8) gives the asymptotic
behaviour of c(n) for a random string and
)n(C
LZ
is normalized via this asymptotic behaviour, i.e., only
consider the finite ratio 0 ≤
)n(C
LZ
≤ 1. This mean
that for the random string
)n(C
LZ
is 1 or c(n)
calculated using the LZ algorithm will have the same
value that b(n) calculated using equation (8). Using
these concepts, the q-index can be calculated by using
the H
TS
definition from equation (1) by substitution
H
TS
= h in the equation (8), i.e.;
BIOSIGNALS 2017 - 10th International Conference on Bio-inspired Systems and Signal Processing
102

N
1i
q
i
2
)p1(
nlog)q1(
n
)n(b
(11)
in this sense will exist a q value in equation (11) that
will make the equation goes to 1. In other words, this
fact can be used to calculate the q-index from a
particular string. By using the c(n) from LZ
algorithm, the procedure can be given by,
∃→
/1
(12)
That means that exist a q-index calculated by using
LZ algorithm that imply C
LZ
convergence to one.
4 MATERIAL AND METHODS
The approach described in previous sections was used
to calculated q-index from EEG data set. The data set
used was obtained from Epilepsy Center of the
University Hospital of Freiburg database. The EEG
data base contains invasive EEG records acquired
from 21 epilepsy patients. The EEG data were
sampled at 256 Hz and pre-processed by a 50 Hz
notch filter and a band pass filter in 0.5-120Hz range
using a Neurofile NT digital video EEG system with
128 channels. For each of the patients, there are
datasets called "ictal" and "interictal", the former
containing files with epileptic seizures and at least 50
min pre-ictal data. The latter containing around 24
hours of EEG-recordings without seizure activity.
From 13 patients at least 24 h of continuous interictal
recordings were available. For the others patients, to
end up with at least 24 h per patient, interictal
invasive EEG data with of less than 24 h were
recorded together. The six contacts of all implanted
grid, strip and depth electrodes were selected by
visual inspection of the raw data by a certified
epileptologist. Three contacts were chosen from the
seizure onset zone, i.e. from areas involved early in
ictal activity. The remaining three electrode contacts
were selected as not involved or involved latest
during seizure spread. The ictal periods were
determined based on identification of typical seizure
patterns preceding clinically manifest seizures in
intracranial recordings by visual inspection of
experienced epileptologists. Each EEG record was
processed using a data raw with 30 seconds of pre-
ictal data and 30 seconds after the epileptic seizure
period. The q-index was calculated using the octave
GPL foundation software running on Linux platform.
The calculation was performed by sliding a Hanning
window in the EEG signal. The Hanning window
was determined by width that corresponding to 256
data points (or one second) and was sliding in disjoint
intervals. So, q-index was calculated in each interval.
This method was able to get a temporal evolution of
the q-index through the signal, to test this
methodology, a time series generated by a logistic
map give by equation (13) was used to show that the
q-index, calculated using the approach previously
described, is sensitive to the system dynamic (Tsallis
et al, 1997).
))n(x1)(n(rx)1n(x
(13)
Other complexity measures than the Lempel-Ziv
exist, for example, sample entropy (SampEn) and
approximate entropy (ApEn) and these complexity
measurements are becoming more popular and have
found wide applications in the area of bioengineering
(Richman and Moorman, 2000), but the relation
between Tsallis entropy and complexity measures it
is not contextualized in the recent literature in terms
of q-index calculation.
5 RESULTS AND DISCUSSION
The calculation of q-index can be better understood
in the figure 1, that plots the ratio c(n)/ b(n) versus q
value. The plot resulting have a point where C(n) =
b(n)/c(n) = 1 that correspond to a q-index. Due the q
value was used to produce b(n) so b(n) is a time series
generated by a entropic process with a given q and if
c(n)/b(n)=1 so the c(n) corresponding to a time series
with the same q-index than b(n).
Figure 1: The matching process to find the q-index.
To test the behaviour of q-index calculated by this
approach a time series generated by a logistic map
given by equation 13 was used and the results are
shown in figure 2 and 3. The behaviour of q-index
with initial condition for a time series generated with
logistic map with r=4 (chaos threshold value) was
shown in figure 2. This results show that the initial
condition does not changes the q-index value. These
5.84 5.85 5.86 5.87 5.88 5.89 5.9
0.993
0.994
0.995
0.996
0.997
0.998
0.999
1
1.001
1.002
1.003
q-value
C(n)
Match point
Linking Non-Extensive Entropy with Lempel-ziv Complexity to Obtain the Entropic Q-index from EEG Signals
103
results are expected because the initial condition do
not characterize the system. The system dynamics is
controlled by the r parameter in the equation 13 and
not by the initial condition x(0). Shown in figure 3 is
the effect of r parameter in q-index value. The results
in figure 3 show that the r parameter changes the q-
index values and it is expected because q-index value
represent the system dynamic. This result is
according to results shown in previous works of
Tsallis et al, (1997).
Figure 2: q-index for different initial condition and r=4.
Figure 3: Index for different r-value.
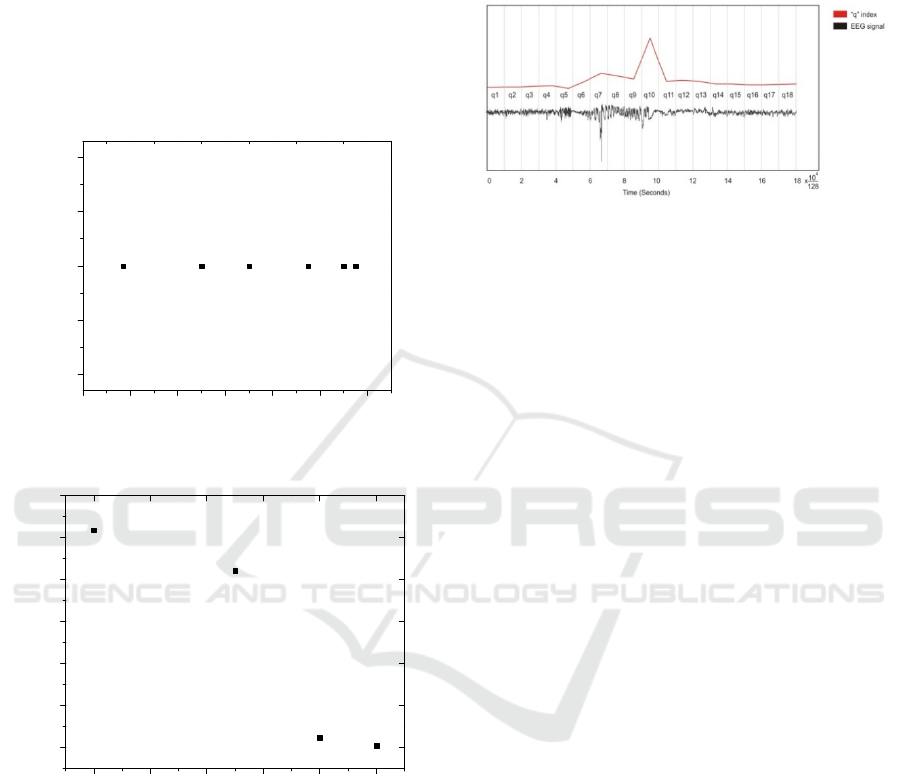
The results in Figure 4 represent the temporal
evolution of q-index value from EEG signal. There is
a clear indication of changes in the q-index value
before the occurrence of the seizure; thus, this result
able speculate that the EEG time-series represent a
brain dynamic which change their extensivity. This
observation is according to the others work in the
literature that make the same speculation when use
the q-index value and complexity measurements in
EEG time-series analysis e.g. results from work of
Rajkovic et. al. (2004). Therefore, in this
methodology q-index value was calculated using one
sample period. So, based in these results, the
methodology developed in this paper is valuable in
practical application of monitoring EEG seizure time-
series.
Figure 4: Time evolution of q value in the EEG signal.
One important question one might ask about the
results presented in this work is concerned to the
relationship between the q-index changes and brain
dynamic. If there are changes in the q-index value so,
the system dynamic expected to be changed.
Supposing that the anatomical brain structure is the
same during EEG acquisition, so it is expected that
changes in q-index could be related to the changes in
the functional brain dynamic. The relationship
between neuroanatomy and brain functional dynamic
were well established in several works (Bullmore and
Sporns, 2009; Bullock, 1989), so the changes
observed in the q-index value calculated from time-
series during the seizure can be understood as
changes of functional dynamics during the ictal
activity represented in the EEG time-series.
6 CONCLUSIONS
A new method for q-index calculation using
complexity measurements and Tsallis entropy as well
as their application in the EEG time-series is
presented. The results presented shown that the
methodology can be used to calculates the q-index
from time-series generated by a system’s dynamic.
The q-index calculated by this methodology was
sensitive to the EEG seizure that may prove to be of
practical importance to predictive purposes.
ACKNOWLEDGEMENTS
The author would like to thanks the National Agency
for Research Support CNPq (proc num, 311084).
-0.2 0.0 0.2 0.4 0.6 0.8 1.0
0.5
1.0
1.5
2.0
2.5
extensivity parameter - q
initial condiction
3.0 3.2 3.4 3.6 3.8 4.0
0
5
10
15
20
25
30
extensivity parameter - q
logistic map parameter - r
BIOSIGNALS 2017 - 10th International Conference on Bio-inspired Systems and Signal Processing
104

REFERENCES
Al-Nuaimi, A., Jammeh E., H., Sun L., Ifeacho E. 2016.
Changes in the EEG amplitude as a biomarker for early
detection of Alzheimer's disease. Engineering in
Medicine and Biology Society (EMBC) IEEE 38th
Annual International Conference, p. 993-996.
Bachmann M., Kalev K., Suhhova A., Lass, J., Hinrikus,
H., 2015. Lempel Ziv complexity of EEG in depression.
IFMBE Proceedings, v 45, p 58-61.
Bullmore E.; Sporns O., 2009. Complex brain networks:
graph theoretical analysis of structural and functional
systems. Nature reviews. Neuroscience. 10(3) p.186-
98.
Bullock, T., H., 1989. The micro-EEG represents varied
degrees of cooperativity among wide-band generators.
In: Basar, E., Bullock, T.H. (Eds.) Brain dynamics,
Progress and perspectives, Berlim, Springer-Verlag,
p.5-12.
Gómez C., Hornero R,, Abásolo D., Fernández A., López
M., 2006. Complexity analysis of the
magnetoencephalogram background activity in
Alzeimer’s disease patients. Medical Engineering and
Physics. v.28, n.9, p.851-859.
Lempel, A.; Ziv, J., 1976. On the complexity of finite
sequences. IEEE Transactions, IT-22, p.75-81.
McBride, J., Zhao, X., Nichols, T., Vagnini, V., Munro, N.,
Berry, D., Jiang, Y., 2013. Scalp EEG-Based
Discrimination of Cognitive Deficits After Traumatic
Brain Injury Using Event-Related Tsallis Entropy
Analysis. IEEE Transactions on Biomedical
Engineering, v 60, n 1, p 90-96.
Nagarajan, R., 2002. Quantifying physiological data with
Lempel-Ziv complexity – certain issues. Transactions
on Biomedical Engneering, v.49, n.11, p.1371-73,
2002.
Nagarajan, R., Szczepanski, J., Wajnryb, E., 2008.
Interpreting non-random signatures in biomedical
signal with Lempel-Ziv complexity. Physica D, v.237,
p.359-64.
Pei, X.. Zheng C., He W., Xu J,. 2006. Quantitative measure
of complexity of the dynamic event-related EEG data.
Neurocomputing, v.70, p.263-72.
Rajkovic M., 2004. Entropic nonextensivity as a measure
of time series complexity. Physica A, v.341 p.327-333.
Richman J., Moorman J. R., 2000. Physiological time series
analysis using approximate entropy and sample
entropy. The American Journal of Physiology Heart
and Circulatory Physiology, v. 278, p.2039–2049.
Sabeti, M.; Katebi, S. Boostani R., 2009. Entropy and
complexity measures for EEG signal classification of
schizophenic and control participants. Artificial
intelligence in medicine, 47(3):263-74.
Szczpánski, J., Amigó J. M., Wajnry E., Sanchez-Vives M.
V., 2003. Application of Lempel-Ziv complexity to the
analysis of neural discharges. Network: Computing in
neural systems, v.14, p.335-50.
Tong S., Bezerianosa A., Paula, J., Zhu, Y., Thakor, N.
2002. Nonextensive entropy measure of EEG following
brain injury from cardiac arrest. Physica A, v.305,
p.619-628.
Tsallis, C. 1988. Possible generalization of Boltzman-
Gibbs statistics. Journal of statistical physics, v.52,
n.1/2, p.479-87.
Tsallis, C.; Plastino, A., R., Zheng, w. (1997). Power-law
sensitivity to initial conditions – new entropic
representation. Chaos, Solitons and fractals. v.8, n.6,
p885-91.
Linking Non-Extensive Entropy with Lempel-ziv Complexity to Obtain the Entropic Q-index from EEG Signals
105
