
Fully Automated Lung Volume Assessment from MRI in a
Population-based Child Cohort Study
Tatyana Ivanovska
1
, Pierluigi Ciet
2
, Adria Rerez-Rovira
2
, Anh Nguyen
2
, Harm Tiddens
2
,
Liesbeth Duijts
2
, Marleen de Bruijne
2
and Florentin W¨org¨otter
1
1
Department for Computational Neuroscience, Georg-August-University, G¨ottingen, Germany
2
Erasmus MC: University Medical Center Rotterdam, Rotterdam, Netherlands
Keywords:
MRI, Lung, Segmentation and Volumetry, Child Cohort.
Abstract:
In this work, a framework for fully automated lung extraction from magnetic resonance imaging (MRI) inspi-
ratory data that have been acquired within a on-going epidemiological child cohort study is presented. The
method’s main steps are intensity inhomogeneity correction, denoising, clustering, airway extraction and lung
region refinement. The presented approach produces highly accurate results (Dice coefficients ≥ 95%), when
compared to semi-automatically obtained masks, and has potential to be applied to the whole study data.
1 INTRODUCTION
Magnetic resonance imaging (MRI) is a non-invasive,
non-ionizing 3D imaging method that is increasingly
applied in research settings. Numerous MR data are
acquired from thousands of subjects (V¨olzke et al.,
2011; Hetterich et al., 2015).
Thereafter, the parameters of interest, such as lung
or liver volumes, need to be extracted from the im-
ages. Manual processing is rather unfeasible due to
time constraints and inter- and intra-observer variabil-
ity. Therefore, automated methods for segmentation
of different organs from MRI are developed (Balafar
et al., 2010; Setarehdan and Singh, 2012; Ivanovska
et al., 2014; Toennies et al., 2015).
However, in a child cohort MR technique is not
so easily implementable, since the participants might
be scared of the closed environment or the necessity
to lie still for some amount of time. Moreover, chil-
dren anatomy varies widely due to the different stages
of growth. Thus, anatomical assumptions used to de-
velop algorithms for adult data might not hold, and,
therefore, the methods implemented for adult subjects
may not be directly applicable.
Here, we discuss the data from a population-based
prospective study with a child cohort and, in particu-
lar, a lung segmentation problem from these data, and
propose a fully automated solution for lung segmen-
tation.
The paper is organized as follows. In Section 3,
the general study information as well as MR protocols
are presented. The ultimate goals of the pulmonary
study and the structured step-by-step tasks are formu-
lated in Section 4.1. In Section 2, related works are
discussed. The algorithmic solution is proposed in
Section 4.2. The results and findings are presented
and discussed in Section 5. The Section 6 concludes
the paper.
2 RELATED WORK
In recent years, multiple automated approaches for
lung segmentation were proposed (Ivanovska et al.,
2016; Ivanovska et al., 2012; Tustison et al., 2015;
Kohlmann et al., 2015; Heimann et al., 2012) have
been proposed. The approaches for detection of
the lung volumes from anatomical MR scans can be
roughly separated in two groups: classical intensity-
based and model-based methods. The model-based
methods consist from a prior model or atlas construc-
tion (Tustison et al., 2015; Tustison et al., 2011), and
require usually a significant amount of training data.
The intensity-based methods (Ivanovska et al.,
2012; Kohlmann et al., 2015) rely on some low-level
features and general considerations on human lung
anatomy. Such methods are usually fast and require
no prior training.
Although there are some methods for airway sys-
tem segmentation available, there are only few meth-
ods that have been proposed for analysis of child
airway MR data. Heimann et al. (Heimann et al.,
Ivanovska T., Ciet P., Perez-Rovira A., Nguyen A., Tiddens H., Duijts L., de Bruijne M. and WÃ˝uergÃ˝uetter F.
Fully Automated Lung Volume Assessment from MRI in a Population-based Child Cohort Study.
DOI: 10.5220/0006075300530058
In Proceedings of the 12th International Joint Conference on Computer Vision, Imaging and Computer Graphics Theory and Applications (VISIGRAPP 2017), pages 53-58
ISBN: 978-989-758-227-1
Copyright
c
2017 by SCITEPRESS – Science and Technology Publications, Lda. All rights reserved
53

2012) presented a method for automated scoring of
regional lung perfusion in children with cystic fibro-
sis using contrast enhanced MRI. They used a com-
bined intensity- and model-based approach. Arens et
al. (Arens et al., 2003) applied a fuzzy connectedness
approach to perform a detailed analysis of the upper
airway (Liu et al., 2002) in children with obstruc-
tive sleep apnea. Thayyil et al. (Thayyil et al., 2009)
used a semiautomatic method for non-invasive in-
ternal organ weight measurement using post-mortem
MR imaging in fetuses, newborns, and children.
3 MATERIALS
3.1 Information on the Generation R
Study
The Generation R Study is a population-based
prospective cohort study, which is initiated in Rotter-
dam, the Netherlands, from fetal life until adulthood.
The study is designed to identify the early environ-
mental and genetic causes and causal pathways lead-
ing to normal and abnormal growth, development and
health during fetal life, childhood and adulthood. The
study focuses on six areas of research:
• maternal health;
• growth and physical development;
• behavioral and cognitive development;
• respiratory health and allergies;
• diseases in childhood;
• health and healthcare for children and their par-
ents.
Main exposures of interest include environmental, en-
docrine, genetic and epigenetic, lifestyle related, nu-
tritional and socio-demographic determinants. In to-
tal, 9778 mothers with a delivery date from April
2002 until January 2006 were enrolled in the study.
Response at baseline was 61 %, and general follow-
up rates until the age of 6 years exceed 80 %. Data
collection in mothers, fathers and children include
questionnaires, detailed physical and ultrasound ex-
aminations, behavioral observations, and biological
samples. A genome and epigenome wide association
screen is available in the participating children. From
the age of 5 years, regular detailed hands-on assess-
ments are performed in a dedicated research center in-
cluding advanced imaging facilities such as Magnetic
Resonance Imaging (MRI). Eventually, results forth-
coming from the Generation R Study contributeto the
development of strategies for optimizing health (Jad-
doe et al., 2012).
3.2 MRI Protocol
The goal of the MRI-study, which comprises ap-
proximately 4000 children aged 9, is to assess car-
diac, pulmonary, fat, and liver parameters. The MR
scanner is a 3-T MR 750w (GE Healthcare, Mil-
waukee, WI, USA). The pulmonary sequence is the
3D Spoiled Gradient Echo (SPGR) at end-inspiration
and end-expiration repeated twice (2 insp and 2 exp).
The parameters are: TR=repetition time: 1.6 ms,
TE=echo time: 0.7 ms, Flip angle=2
◦
; Average: 0.75,
FOV=40cm; Matrix= 200× 200, in-plane resolution
2× 2× 2 mm
3
, 32 channel torso coil. Additionally, a
mock scanner is used, in which children can practice
to lie within the MR scanner in a friendly way and get
used to the scanner protocols.
3.3 Test Set and Expert Annotations
To evaluate the approach, we randomly selected ten
subjects and evaluated two inspiratory scans for each
of them, i.e., twenty datasets were used as a test set.
We asked an experienced observer to semi-
automatically measure lung volumes including tra-
chea with a simple global thresholding, which was a
reasonable trade-off between the time and measure-
ment accuracy.
It has to be noted that with such and approach tra-
chea was included in the lung volume, whereas the
automated method produces the results without the
tracheal volume. This does not appear to be a prob-
lem though, due to the fact that trachea is a relatively
small organ, when compared to lungs, and its volume
is a minor addition (about 200-300 ml) to the total
lung volume. Moreover, the spirometry parameters
do not exclude the tracheal volume as well. However,
in the automatic approach, the trachea is detected and
excluded, since we are interested in separate lung vol-
umes as well as furthertracheal analysis is planned for
future work.
The expert evaluated each dataset two times. In
Section 5, two rounds of measurements are denoted
as R
e1
and R
e2
.
4 METHODS
4.1 Formulated Task
The ultimate goal of the research is to fully analyze
the pulmonary system in a child cohort study using
the available MRI data. The sub-tasks include (but
are not limited to)
VISAPP 2017 - International Conference on Computer Vision Theory and Applications
54
1. assessment of lung volumes from inspiratory MR
scans;
2. their correlation with spirometry data;
3. analysis of tracheal dimensions;
4. analysis of expiratory lung data.
In this work, we propose a solution to the first sub-
task, namely, a fully automated framework for lung
volume extraction in inspiratory MR scans.
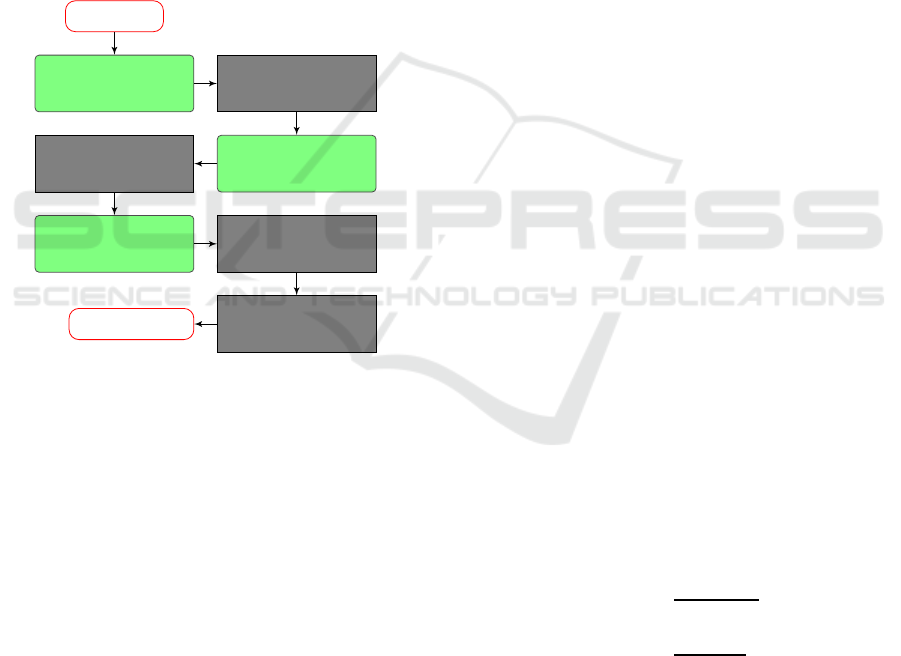
4.2 Proposed Approach
The proposed algorithm is the extended version of the
framework proposed by Ivanovska et al. (Ivanovska
et al., 2012). The framework scheme is shown in Fig-
ure 1.
Data Input
IIH Correction
Denoising
Clustering
Lung
Extraction
Trachea
Removal
Lung
Separation
Lung
Smoothing
LungVolumes
Figure 1: The framework scheme. The modules that differ
from the work of Ivanovska et al. (Ivanovska et al., 2012)
are marked green.
First, since the study data contain significant in-
tensity inhomogeneity, it requires correction. The
recently proposed method N4ITK (Tustison et al.,
2010) is applied three times in a row, and the results
are of acceptable quality. The example result is shown
in Figure 2.
Second, the corrected data are denoised us-
ing a boundary preserving method, the classical
Anisotropic diffusion filter (Perona et al., 1994),
and the intensity clustering, namely, the Fuzzy C-
Means (Bezdek et al., 1984) method, is applied.
Third, the regions that are classified to the dark-
est intensity class are selected, and the background
is removed from further processing. Here, a special
region evaluation procedure is introduced to prevent
the extraction of non-lung regions. We apply a re-
gion growing-based procedure, which evaluates the
lung region overlap in consecutive slices. Since a
rather smooth lung area decay is expected, any re-
gions that have an overlap with regions in the previ-
ous slice smaller than a pre-selected threshold value
are disregarded from the further processing.
Fourth, the tracheal, namely, dark tubular regions
are identified using the Vesselness filter (Frangi et al.,
1998). It analyzes the eigenvalues of the Hessian ma-
trix. Thereafter, the filter’s response is overlaid with
the lung mask segmented in the previous step. Then,
the tracheal region is tracked and the cut is made,
where main bronchi enter the lung parenchyma. The
Vesselness filter allows one to detect tracheal regions
even in the cases, where there is no clearly visible
boundary between the trachea and the lung tissue.
Finally, the lung regions are separated with pre-
filled 3D Watershed (Roerdink and Meijster, 2000)
and smoothed with morphological operations (Sonka
et al., 2014) similar to the approach of Ivanovska et
al. (Ivanovska et al., 2011). The lung masks and vol-
umes are computed and saved to a file.
In Figure 3, we present 3D and 2D exam-
ple results, demonstrating the excluded trachea and
smoothed lungs.
5 RESULTS AND DISCUSSION
The automated approach was implemented in the
MeVisLab Framework (Heckel et al., 2009). The pa-
rameters were fixed for the test set. Average compu-
tation time for each dataset is about 3-4 minutes on a
AMD Athlon II X4 860K, 4x 3700 MHz with 16 GB
DDR3-RAM.
To evaluate the expert readings and automatically
computed results, we use two metrics, namely, the
DICE coefficient (Dice, 1945) and the Jaccard in-
dex (Real and Vargas, 1996). The definition of the
metrics is given below. For two sets, in our case, the
results obtained from the expert and the automatically
computed results, R
e
and R
a
, respectively, the overlap
coefficients are computed as
DSC =
2|R
e
∩ R
a
|
|R
e
| + |R
a
|
(1)
Jacc =
|R
e
∩ R
a
|
|R
e
∪ R
a
|
(2)
Since our observer analyzed the test set two times,
we assess the intra-observer variability and compare
the automatically obtained results R
a
to both expert
measurements, denoted R
e1
and R
e2
, respectively.
The comparison results (mean µ ± standard deviation
σ) for 20 test datasets are presented in Table 1. We
evaluated the intra-observervariability using the same
Fully Automated Lung Volume Assessment from MRI in a Population-based Child Cohort Study
55
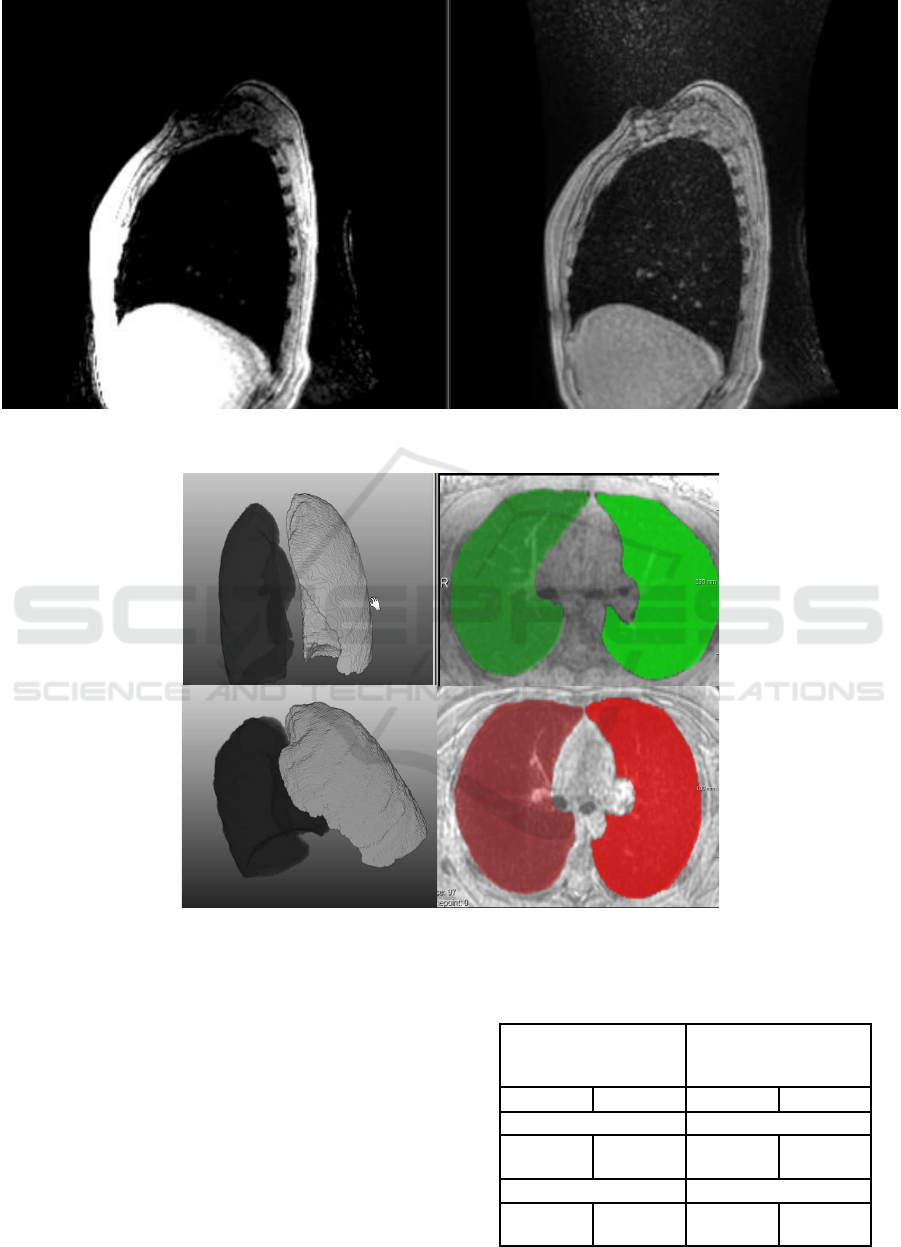
Figure 2: Example slice in a sagittal view. Left: original data; Right: corrected data with three consecutive N4ITK cycles.
Figure 3: Example results from 2 datasets. Left: 3D results; Right: Segmentation results are overlaid with the original data in
axial projection.
metrics, and for R
e1
vs R
e2
the DICE and Jaccard co-
efficients are 0.9674±0.00597and 0.9364± 0.02, re-
spectively.
As one can observe, the automatically computed
results lie close to both semi-automatically obtained
ground truth masks, and the Dice coefficient is about
95%. The differences are due to the fact that the
expert neither excluded the tracheal region from the
evaluation nor smoothed the lung regions. In Figure 4,
an overlay example of the expert readings (white) and
the automated results (green) are documented. The
Table 1: Manual and automated result comparison.
Proposed approach Previous
method (Ivanovska
et al., 2011)
DICE Jaccard DICE Jaccard
R
a
vs. R
e1
R
a
vs. R
e1
0.9521 ±
0.010
0.9083 ±
0.01
0.8901 ±
0.11
0.82 ±
0.0968
R
a
vs. R
e2
R
a
vs. R
e2
0.95485±
0.018
0.9145 ±
0.01
0.8875 ±
0.0906
0.81 ±
0.1004
VISAPP 2017 - International Conference on Computer Vision Theory and Applications
56

Figure 4: Comparison of manual readings (white) and auto-
mated results (green) in 2D.
expert readings differ from each other slightly (the
Dice coefficient is about 97%), since the differences
are only due to the selected global threshold value.
Additionally, we applied the technique of
Ivanovska et al. (Ivanovska et al., 2011) to our test
set. That method was designed for and tested on a dif-
ferent sequence with a higher spatial resolution and
less artifacts. The results are also presented in Ta-
ble 1. The previous technique did not include any
intensity inhomogeneity correction and the trachea
removal procedure was based only on region grow-
ing in the segmentation mask. We assume that this
affected the results negatively (the DICE coefficient
is less than 90%), since in some cases the parts of
lungs were either oversegmented or undersegmented
and misinterpreted as other structures and erroneously
removed. The proposed pipeline successfully over-
comes these problems and produces accurate results.
6 CONCLUSIONS AND FUTURE
WORK
In this paper, a fully automated approach for lung seg-
mentation in MRI data from the Generation R child
study. The results were applied to a sample of 20
datasets. Our expert established groundtruth in a
semi-automatic manner in two measurement sessions.
We assessed the segmentation accuracy by compar-
ing the automatically computed results to the expert
readings. Moreover, the comparison to a previously
established technique was also done. The proposed
framework produces highly accurate results and has a
potential to be applied to the whole pulmonary dataset
(above 4000 subjects).
Future extensions of the framework include analy-
sis of tracheal regions and segmentation of expiratory
scans.
REFERENCES
Arens, R., McDonough, J. M., Corbin, A. M., Rubin, N. K.,
Carroll, M. E., Pack, A. I., Liu, J., and Udupa, J. K.
(2003). Upper airway size analysis by magnetic res-
onance imaging of children with obstructive sleep ap-
nea syndrome. American journal of respiratory and
critical care medicine, 167(1):65–70.
Balafar, M. A., Ramli, A. R., Saripan, M. I., and Mashohor,
S. (2010). Review of brain mri image segmentation
methods. Artificial Intelligence Review, 33(3):261–
274.
Bezdek, J. C., Ehrlich, R., and Full, W. (1984). Fcm: The
fuzzy c-means clustering algorithm. Computers &
Geosciences, 10(2):191–203.
Dice, L. R. (1945). Measures of the amount of ecologic
association between species. Ecology, 26(3):297–302.
Frangi, A. F., Niessen, W. J., Vincken, K. L., and Viergever,
M. A. (1998). Multiscale vessel enhancement filter-
ing. In Medical Image Computing and Computer-
Assisted InterventationMICCAI98, pages 130–137.
Springer.
Heckel, F., Schwier, M., and Peitgen, H.-O. (2009). Object-
oriented application development with mevislab and
python. In GI Jahrestagung, pages 1338–1351. Cite-
seer.
Heimann, T., Eichinger, M., Bauman, G., Bischoff, A., Pud-
erbach, M., and Meinzer, H.-P. (2012). Automated
scoring of regional lung perfusion in children from
contrast enhanced 3d mri. In SPIE Medical Imaging,
pages 83150U–83150U. International Society for Op-
tics and Photonics.
Hetterich, H., Bayerl, C., Peters, A., Heier, M., Linkohr,
B., Meisinger, C., Auweter, S., Kannengießer, S. A.,
Kramer, H., Ertl-Wagner, B., et al. (2015). Feasibility
of a three-step magnetic resonance imaging approach
for the assessment of hepatic steatosis in an asymp-
tomatic study population. European radiology, pages
1–10.
Ivanovska, T., Buttke, E., Laqua, R., V¨olzke, H., and Beule,
A. (2011). Automatic trachea segmentation and evalu-
ation from mri data using intensity pre-clustering and
graph cuts. In Image and Signal Processing and Anal-
ysis (ISPA), 2011 7th International Symposium on,
pages 513–518. IEEE.
Ivanovska, T., Hegenscheid, K., Laqua, R., Gl¨aser, S., Ew-
ert, R., and V¨olzke, H. (2016). Lung segmentation of
mr images: A review. In Visualization in Medicine
and Life Sciences III, pages 3–24. Springer.
Ivanovska, T., Hegenscheid, K., Laqua, R., K¨uhn, J.-P.,
Gl¨aser, S., Ewert, R., Hosten, N., Puls, R., and
V¨olzke, H. (2012). A fast and accurate automatic
lung segmentation and volumetry method for mr data
used in epidemiological studies. Computerized Medi-
cal Imaging and Graphics, 36(4):281–293.
Fully Automated Lung Volume Assessment from MRI in a Population-based Child Cohort Study
57

Ivanovska, T., Laqua, R., Wang, L., Liebscher, V., V¨olzke,
H., and Hegenscheid, K. (2014). A level set based
framework for quantitative evaluation of breast tissue
density from mri data. PloS one, 9(11):e112709.
Jaddoe, V. W., van Duijn, C. M., Franco, O. H., van der Hei-
jden, A. J., van IIzendoorn, M. H., de Jongste, J. C.,
van der Lugt, A., Mackenbach, J. P., Moll, H. A., Raat,
H., et al. (2012). The generation r study: design and
cohort update 2012. European journal of epidemiol-
ogy, 27(9):739–756.
Kohlmann, P., Strehlow, J., Jobst, B., Krass, S., Kuhnigk, J.-
M., Anjorin, A., Sedlaczek, O., Ley, S., Kauczor, H.-
U., and Wielp¨utz, M. O. (2015). Automatic lung seg-
mentation method for mri-based lung perfusion stud-
ies of patients with chronic obstructive pulmonary dis-
ease. International journal of computer assisted radi-
ology and surgery, 10(4):403–417.
Liu, J., Udupa, J. K., Odhner, D., McDonough, J. M., and
Arens, R. (2002). Upper airway segmentation and
measurement in mri using fuzzy connectedness. In
Medical Imaging 2002, pages 238–247. International
Society for Optics and Photonics.
Perona, P., Shiota, T., and Malik, J. (1994). Anisotropic
diffusion. In Geometry-driven diffusion in computer
vision, pages 73–92. Springer.
Real, R. and Vargas, J. M. (1996). The probabilistic basis
of jaccard’s index of similarity. Systematic biology,
45(3):380–385.
Roerdink, J. B. and Meijster, A. (2000). The watershed
transform: Definitions, algorithms and parallelization
strategies. Fundamenta informaticae, 41(1, 2):187–
228.
Setarehdan, S. K. and Singh, S. (2012). Advanced algo-
rithmic approaches to medical image segmentation:
state-of-the-art applications in cardiology, neurology,
mammography and pathology. Springer Science &
Business Media.
Sonka, M., Hlavac, V., and Boyle, R. (2014). Image
processing, analysis, and machine vision. Cengage
Learning.
Thayyil, S., Schievano, S., Robertson, N. J., Jones, R.,
Chitty, L. S., Sebire, N. J., Taylor, A. M., group, M. M.
R. I. A. S. C., et al. (2009). A semi-automated method
for non-invasive internal organ weight estimation by
post-mortem magnetic resonance imaging in fetuses,
newborns and children. European journal of radiol-
ogy, 72(2):321–326.
Toennies, K. D., Gloger, O., Rak, M., Winkler, C., Klemm,
P., Preim, B., and V¨olzke, H. (2015). Image analysis
in epidemiological applications. it-Information Tech-
nology, 57(1):22–29.
Tustison, N. J., Avants, B. B., Cook, P. A., Zheng, Y., Egan,
A., Yushkevich, P. A., and Gee, J. C. (2010). N4itk:
improved n3 bias correction. Medical Imaging, IEEE
Transactions on, 29(6):1310–1320.
Tustison, N. J., Avants, B. B., Flors, L., Altes, T. A.,
de Lange, E. E., Mugler, J. P., and Gee, J. C. (2011).
Ventilation-based segmentation of the lungs using hy-
perpolarized 3he mri. Journal of Magnetic Resonance
Imaging, 34(4):831–841.
Tustison, N. J., Qing, K., Wang, C., Altes, T. A., and Mu-
gler, J. P. (2015). Atlas-based estimation of lung and
lobar anatomy in proton mri. Magnetic resonance in
medicine.
V¨olzke, H., Alte, D., Schmidt, C. O., Radke, D., Lorbeer,
R., Friedrich, N., Aumann, N., Lau, K., Piontek, M.,
Born, G., et al. (2011). Cohort profile: the study of
health in pomerania. International journal of epidemi-
ology, 40(2):294–307.
VISAPP 2017 - International Conference on Computer Vision Theory and Applications
58
