The Code-Map Metaphor
A Review of Its Use Within Software Visualisations
Ivan Bacher
1
, Brian Mac Namee
2
and John D. Kelleher
1
1
Dublin Institute of Technology, Dublin, Ireland
2
University College Dublin, Dublin, Ireland
Keywords:
Software Visualisation, Dense Pixel Representation, Review, Code-Map Metaphor, SeeSoft.
Abstract:
Software developers can use software visualisations employing the code-map metaphor to discover and cor-
relate facts spread over a large code base. This work presents an extensive review of the use of the code-map
metaphor for software visualisation. The review analyses a set of 29 publications, which together describe 21
software development tools that use visualisations employing the code-map metaphor. The review follows a
task oriented framework to guide the analysis of the literature in terms of the task, audience, target, medium,
representation, and evidence dimensions based on the code- map metaphor. Although the literature indicates
that software visualisations based on the code-map metaphor are perceived by the research community to be
helpful across all aspects of the software develop process, the main finding of our review is that there is a lack
of quantitative evidence to support this perception. Thus, the effectiveness of visualisations incorporating the
code-map metaphor is still unclear. The majority of the software visualisations analysed in this study, how-
ever, do provide qualitative observations regarding their usage in various scenarios. These are summarised
and presented in this review as we believe the observations can be used as motivation for future empirical
evaluations.
1 INTRODUCTION
Software visualisation (softvis), a sub-field of infor-
mation visualisation, is “the art and science of gen-
erating visual representations of the various aspects
of software (e.g. source code) and its development
process” (Diehl, 2007). Moreover, the goal of softvis
is to help stakeholders to comprehend software sys-
tems and to improve the productivity of the software
development process (Diehl, 2007). Researchers in
softvis are concerned with visualising the structure,
behaviour, and evolution of software; where structure
refers to the static aspects of a software system, be-
haviour to the dynamic aspects of a software system,
and evolution to the development process of a soft-
ware system.
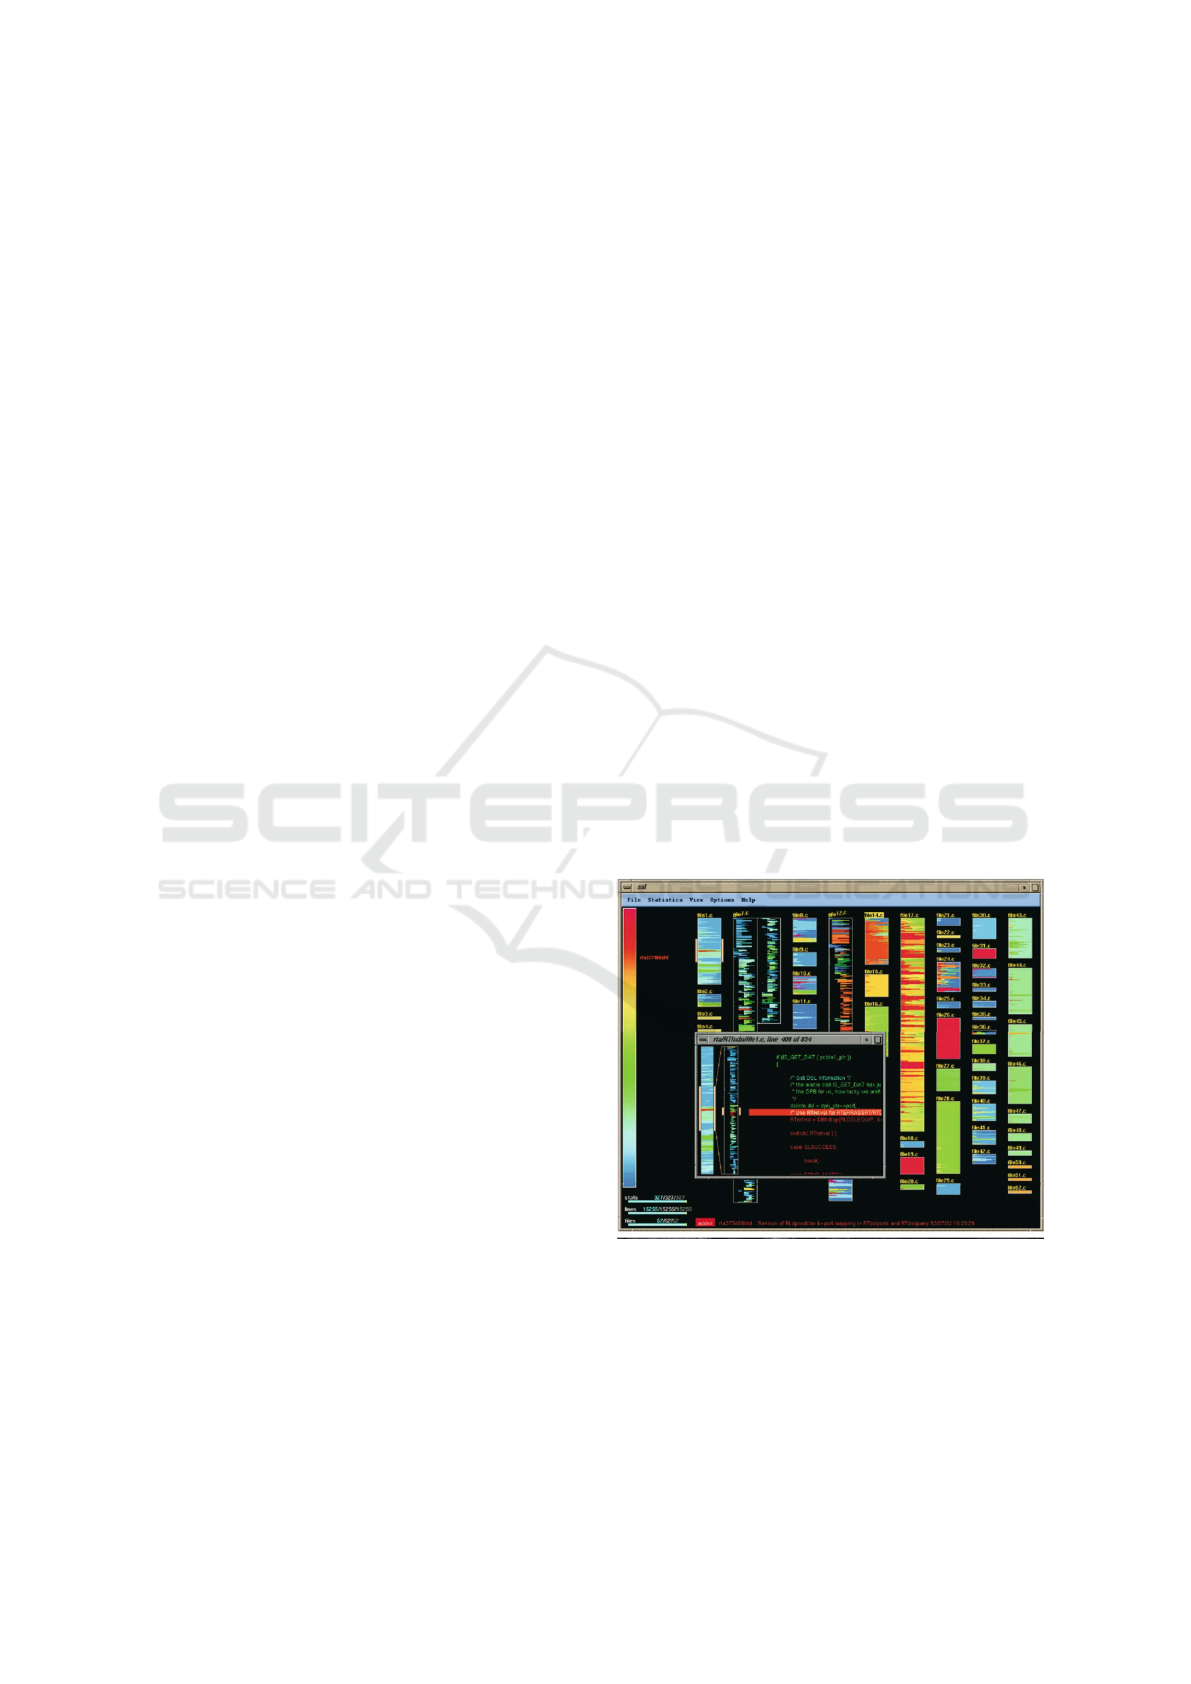
SeeSoft (Eick et al., 1992) is a prominent exam-
ple of a software visualisation. The original publica-
tion has over 800 citations. SeeSoft was pioneered
by Eick et al. in the 1990s to visualise the evolu-
tion of large and complex software systems. Figure
1 shows a screenshot of the SeeSoft system, visualis-
ing several files containing over five thousand lines
of code. Colour is used to show code age, where
red depicts recently modified code and blue depicts
Figure 1: SeeSoft - Visualising program code changes.
code that has been unchanged for a long time. The
smaller window shows the source code correspond-
ing to the current region in focus. Several facts about
the code base are shown including an overview of the
relative sizes of all files in the code base as well as
their structure. Marcus et al. (Marcus et al., 2003a)
suggest that SeeSoft is so successfully because it in-
Bacher I., Mac Namee B. and Kelleher J.
The Code-Map Metaphor - A Review of Its Use Within Software Visualisations.
DOI: 10.5220/0006072300170028
In Proceedings of the 12th International Joint Conference on Computer Vision, Imaging and Computer Graphics Theory and Applications (VISIGRAPP 2017), pages 17-28
ISBN: 978-989-758-228-8
Copyright
c
2017 by SCITEPRESS – Science and Technology Publications, Lda. All rights reserved
17

corporates a natural and direct mapping from the vi-
sual metaphor to the source code and back, leading
to a natural navigation between the representations.
This makes the visual representation easy to under-
stand, yielding high levels of trust on the part of the
user.
Many visualisations have been developed that are
based on the SeeSoft representation and several terms
have been used to describe these types of visualisa-
tions, including dense layouts for text, pixel oriented
views, and zoomed out views. However, none of
the above terms are able to include all visualisations
based on the SeeSoft representation, therefore, we
will be using the term code-map metaphor. We de-
fine the code-map metaphor as the mapping of source
code to a zoomed out representation, either by the use
of pixels, pixel lines, or a scaled down representation
of text, in order to allow stakeholders to comprehend
various statistics collected at the level of detail of in-
dividual lines of code. We feel that this term best de-
scribes the original intent of these software visualisa-
tions as they encode source code to a zoomed out rep-
resentation that maintains the spatial relationships be-
tween source code elements and visually encodes key
metrics describing the characteristics of these source
code elements.
To the best of our knowledge, there has been no
dedicated effort to identify and synthesise the softvis
literature relating to software visualisations employ-
ing the code-map metaphor. Therefore, to fill this gap,
this work reports the design, execution, and findings
of a review that identifies, selects, and summarises a
comprehensive set of literature on software visualisa-
tions, that employ the code-map metaphor. The pri-
mary research question this review aims to answer is:
How is the code-map metaphor employed by existing
software visualisations and what evidence exists of its
usefulness? The review follows a task oriented frame-
work to guide the analysis of the literature in terms
of the task, audience, target, medium, representation,
and evidence dimensions (Maletic et al., 2002; Schots
and Werner, 2014) of softvis. The main contribution
of this study is an extensive analysis of the code-map
metaphor, in terms of real world applicability, limi-
tations, and perceived usability. We believe that the
findings from this review can provide important ben-
efits to researchers and practitioners from the softvis
community.
The remainder of this paper is structured as fol-
lows. Section 2 presents previous overviews, reviews,
surveys, and systematic mapping studies in the field
of softvis. Section 3 describes the method used to
identify relevant literature corresponding to software
visualisations employing the code-map metaphor, as
well as the methodology used to extract data from the
literature. Section 4 presents a synthesis of the anal-
ysed software visualisations. Section 5 presents a dis-
cussion of the findings presented in Section 4. Finally,
Section 6 reiterates the most important aspects of this
study, as well as implications for future work.
2 RELATED WORK
This study presents a review of the code-map
metaphor and software visualisations that employ it.
We are interested in synthesising previous research
to provide insight into how various software visual-
isations have employed the code-map metaphor, as
well as investigating existing evidence in regards to
its usefulness and usability. To the best of our knowl-
edge, this is the first review that focuses exclusively
on software visualisations employing the code-map
metaphor.
A large body of literature exists in the field of
visualisation in order to guide researchers and tool
developers. For example (Munzner and Maguire,
2015; Ward et al., 2015; Telea, 2015) provide a syn-
thesis view of the infovis field. Moreover, there
have been several review (M
¨
uller and Zeckzer, 2015;
Shahin et al., 2014; Sharafi, 2011), overview (Diehl,
2007; Teyseyre and Campo, 2009; Petre and Quincey,
2006), and survey (Ghanam and Carpendale, 2008;
Caserta and Zendra, 2011) studies in the field of soft-
vis. These either focus on sofvis as a whole or spe-
cific areas, such as software architecture visualisation
(Shahin et al., 2014). In order to place this study into
the broader context of softvis literature, we present a
brief overview of a subset of these studies.
Petre and De Quincey (Petre and Quincey, 2006)
provide an overview of the softvis field in regards
to what software development tasks are supported by
software visualisations and what aspects of a software
system are visualised. The overview study does not
mention the code-map metaphor. However, the au-
thors do state that one of the main challenges of soft-
ware visualisation is to identify the most appropriate
visualisation technique for a given software develop-
ment task. This claim is considered in our study by
the use of the task oriented framework (Maletic et al.,
2002), which is described further in Section 3.
Shahin et al. (Shahin et al., 2014) conducted a sys-
tematic review of software visualisation techniques
for software architecture. The authors analysed 57
studies and were able to categorise them based on
the type of visualisation technique that was employed.
Out of the 57 studies, 26 employed graph-based visu-
alisations, 22 employed notation based visualisations,
IVAPP 2017 - International Conference on Information Visualization Theory and Applications
18

5 employed matrix based visualisations, and 4 em-
ployed metaphor based visualisations. The metaphor
based visualisations do not include any software visu-
alisation tools incorporating the code-map metaphor.
We believe that this supports the assumption that the
code-map metaphor is not suitable for software archi-
tecture visualisations, due to the fact that software ar-
chitecture visualisations typically do not include in-
formation at the source code level of detail and are
more tailored toward managers and system architects
rather than software developers.
The survey study on software architecture visu-
alisation by Carpendale and Ghanam (Ghanam and
Carpendale, 2008), emphasises the importance of
evaluation. They found that most software architec-
ture visualisation tools failed in evaluating how their
utilisation directly influenced the targeted audience.
Additionally, the authors state that it is not suffi-
cient to rely on guesses to decide whether a specific
metaphor should be used or not, but that there is a
need to study how effective and expressive an abstract
or a real metaphor is. This claim is taken into account
in this review by the use of the extended task oriented
framework (Schots and Werner, 2014), which is de-
scribed further in Section 3.
Caserta and Zendra (Caserta and Zendra, 2011)
present a survey on 2D and 3D based visualization
techniques representing the static aspects of software.
The authors find that visualisations of the static as-
pects of software can be split into two main cate-
gories: visualisations that show evolution and visuali-
sations that give a picture of the software at a specific
point in time. Additionally, visualisations belonging
to these categories can be further categorised based on
their level of abstraction: source code level, middle
level (consisting of package, class and method level),
and architectural level. Several tools included in the
survey are categorised as belonging to the source code
level of abstraction category, including SeeSoft (Eick
et al., 1992) and SV3D (Marcus et al., 2003a).
3 RESEARCH METHOD
A systematic literature review is a widely used re-
search method and is a means of identifying, evaluat-
ing, and interpreting all available research relevant to
a particular topic of interest. For this review, we fol-
lowed Kitchenham and Charters guidelines (Kitchen-
ham and Charters, 2007). These guidelines involve
three main phases: defining a review protocol, con-
ducting the review, and reporting the review. The pro-
tocol used in this study was inspired by (Shahin et al.,
2014) and is composed of the following components:
research questions, literature search, and study selec-
tion. These steps are detailed in the following subsec-
tions.
3.1 Research Questions
To answer our main research question (how is the
code-map metaphor employed by existing software
visualisations and what evidence exists of its use-
fulness?), a task oriented framework was used to
guide our analysis of the literature we reviewed. The
task oriented framework was originally proposed by
Maletic et al. (Maletic et al., 2002) and is intended to
be used for the characterisation and classification of
software visualisations. The framework makes use of
five dimensions which reflect the task, audience, tar-
get, medium, and representation of a software visual-
isation. However, the applicability of a software visu-
alisation to a specific task is not clearly emphasized
in the dimensions of the framework. The software vi-
sualisation literature (Ghanam and Carpendale, 2008;
Petre and Quincey, 2006) emphasises the importance
of evaluation in order to identify the most appropri-
ate visualisation technique for a given software de-
velopment task. In order to overcome this limita-
tion, Schots and Werner (Schots and Werner, 2014)
extended the task oriented framework to include a di-
mension capturing the evidence that a visualisation is
worthwhile for a specific task.
To improve support for mapping information to
each dimension, Schots and Werner (Schots and
Werner, 2014) include a comprehensive set of ques-
tions that relate to each dimension. These questions
were modified to fit this study and are presented in Ta-
ble 1. The modified task oriented framework utilised
by this study makes use of the following 6 dimensions
and associated questions.
Task (why): This dimension is used to answer
the question of why a particular software visualisa-
tion is needed. More specifically, in this study the di-
mension is used to determine the main motivation for
employing the code-map metaphor (SQ:1.1) and the
main goal of a visualisation (SQ:1.2). Additionally,
we are also interested in which software engineering
activities the visualisations employing the code-map
metaphor support (SQ:1.3).
Audience (who): Software visualisations can
be tailored toward users with different skills and
different information needs. In order to extract
this information this dimension attempts to answer
which stakeholders the software visualisations target
(SQ:2.1).
Target (what): The target dimension defines
which aspects of a software system’s source code are
The Code-Map Metaphor - A Review of Its Use Within Software Visualisations
19

Table 1: Research questions derived from (Schots and Werner, 2014, Table 1).
Dimensions Research questions
Task
SQ1.1: What is the main motivation for using the metaphor?
SQ1.2: What is the main goal of using the metaphor?
SQ1.3: Which software engineering activities are supported?
Audience SQ2.1: For which users are the visualisations intended?
Target
SQ3.1: Which aspects of the source code are visually represented?
SQ3.2: Do these aspects represent the structure, behaviour, or evolution of a software system?
Representation
SQ4.1: How is source code mapped to the visual representation?
SQ4.2: How are the various properties of source code mapped to the metaphor?
Medium
SQ5.1: Which medium is used to display the visualisation?
SQ5.2: Which resources can be used to interact with the visualisation?
Evidence
SQ6.1: Which methods are used for assessing the quality of the visualisation(s) employing the metaphor?
SQ6.2: Which aspects of the visualisation(s) are evaluated?
SQ6.3: What are the results and outcomes of the conducted evaluation(s)?
visualised (SQ:3.1) and attempts to categorise these
aspects in regards to the structure, behaviour, and evo-
lution categories of softvis (SQ:3.2).
Representation (how): The effectiveness of a vi-
sualisation can be measured based on its ability to
clearly and accurately represent information. For this
study this dimension asks how source code (SQ:4.1)
and the various properties (SQ:4.2) of the code are
mapped to the visual representation of the metaphor.
Medium (where): The medium dimension aims
to extract what type of display medium is used by the
software visualisation (SQ:5.1), which can include
paper, single monitors, multiple monitors, virtual re-
ality headsets, and mobile devices. This dimension
also attempts to gain insight into which resources can
be used to interact with the software visualisations
(SQ:5.2).
Evidence (worthwhile): The evidence dimen-
sion is used to determine if the software visualisa-
tions employing the code-map metaphor are effective
in helping their target users. Moreover, the dimen-
sion aims to answer which evaluation methods were
used (SQ:6.1), which aspects of the visualisation were
evaluated (SQ:6.2), and what the outcomes of these
evaluations were (SQ:6.3).
3.2 Literature Search
The process of extracting relevant literature for this
review was composed of three steps. Step one con-
sisted of analysing the literature presented in Table 2,
in order to extract relevant publications related to the
code-map metaphor. Step two consisted of search-
ing the proceedings of the publication venues (known
for including softvis research) presented in Table 3
using the query term “SeeSoft”. This query term
was constructed after examining the publications ex-
tracted from step one. The reasoning behind the query
term was that many of the extracted publications used
the terms “SeeSoft like represented” or “a view simi-
lar to SeeSoft” when describing visualisation systems.
Finally, step three consisted of manually analysing re-
lated work sections from the publications extracted in
step one and step two in order to extract any further
publications related to the code-map metaphor.
Table 2: Literature search phase 1.
Reference Type Extracted
(Munzner and Maguire, 2015) Book 2
(Ward et al., 2015) Book 1
(Telea, 2015) Book 1
(Diehl, 2007) Book 9
(M
¨
uller and Zeckzer, 2015) Review 1
(Shahin et al., 2014) Review 0
(Sharafi, 2011) Review 0
(Teyseyre and Campo, 2009) Overview 5
(Petre and Quincey, 2006) Overview 0
(Ghanam and Carpendale, 2008) Survey 1
(Caserta and Zendra, 2011) Survey 4
Table 3: Literature search phase 2.
Venue Years Papers Extracted
VISSOFT 02, 05, 07, 11, 13 - 15 161 16
SOFTVIS 03, 05, 06, 10 145 20
EuroVIs 2015 - 2016 130 0
InfoVis 2013 - 2016 136 0
ICPC 03, 11, 14, 15 153 1
3.3 Study Selection
The publications extracted from the literature search
were analysed in order to determine if these were rel-
IVAPP 2017 - International Conference on Information Visualization Theory and Applications
20

evant for this work. For a publication to be included
in the review, the study had to be peer-reviewed and
present a visualisation which employed the code-map
metaphor. In total, 29 publications describing 21 soft-
ware visualisations were extracted and are listed in
Table 4. For the remainder of this study, the names of
the individual visualisations are used rather than ref-
erences to the publications, as several visualisations
are described in multiple publications. To the best of
our knowledge, we have included all software visual-
isations that employ the code-map metaphor.
Table 4: Extracted visualisations.
Name References
SeeSoft
(Eick et al., 1992)
(Ball and Eick, 1996)
SeeSlice
(Ball and Eick, 1994)
(Ball and Eick, 1996)
Almost (Reiss, 1999)
Aspect Browser
(Griswold et al., 2001)
(Shonle et al., 2004)
Aspect Miner (Hannemann and Kiczales, 2001)
Bee/Hive
(Reiss, 2001a)
(Reiss, 2001b)
Tarantula (Jones et al., 2002)
SV3D
(Xie et al., 2005)
(Maletic et al., 2003)
(Marcus et al., 2003a)
(Marcus et al., 2003b)
Augur (Froehlich and Dourish, 2004)
Gammatella (Orso et al., 2004)
MicroPrints
(Ducasse et al., 2005)
(Robbes et al., 2005)
Visual Code Navigator (Lommerse et al., 2005)
War Room Command Console (O’Reilly et al., 2005)
CVSscan (Voinea et al., 2005)
Code Thumbnails (De Line et al., 2006)
SOLIDFX (Telea and Voinea, 2008)
Code Bubbles
(Reiss and Tarvo, 2013)
(Bragdon et al., 2010)
Decluvi (Islam et al., 2010)
MosaiCode (Maletic et al., 2011)
Chronos (Servant and Jones, 2013)
SpiderSense (Reddy et al., 2015)
4 RESULTS
This section will describe the results of analysing the
21 selected visualisations using the extended task-
oriented framework. For each dimension of the task
oriented framework that this study uses, the selected
publications were the only sources of information.
Due to space constraints, only some of the analysed
visualisations are mentioned throughout the descrip-
tion of the findings.
4.1 Task
SQ1.1: What is the main motivation for using the
metaphor? Examining the source code of a software
system is often the only reliable method for gain-
ing insight into the system’s structure, behaviour, and
evolution. During the maintenance of a software sys-
tem, software developers can face several challenges.
One of the challenges consisting of making changes
to an existing code base, either to extend the func-
tionality of the system of simply just to remove a bug.
However, due to the volume of code that is present in
a typical software system, developers can find it dif-
ficult to relate aspects from the structure, behaviour,
or evolution of the corresponding system back to the
code.
In general, the main motivation for produc-
ing software visualisations employing the code-map
metaphor was the need for a direct mapping from a vi-
sual representation to the source code and back. The
direct mapping is needed in order to support the en-
coding of specific properties and relationship, in or-
der to make developers aware of promising locations
within the code to motivate further exploration.
SeeSoft, one of the first tools employing the code-
map metaphor, was motivated by the fact that a new
scalable technique was needed for visualising pro-
gram text. SeeSlice, Almost, Aspect Browser, Au-
gur, Gammatella, and CSVscan were motivated by
the lack of adequate tools for a number of different
software development tasks including exploring pro-
gram slices, inspecting the behaviour of a system, pre-
senting search query results, and supporting the dis-
tributed process of software development. The moti-
vation of SV3D is described as overcoming the limita-
tions of SeeSoft by exploring new mediums and rep-
resentations to facilitate code understanding.
SQ1.2: What is the main goal of using the
metaphor? The main goal of using the code-map
metaphor is to provide developers with a “big picture”
view of a code base, while still being able to under-
stand information collected at the source code level of
detail. This information can include execution traces,
The Code-Map Metaphor - A Review of Its Use Within Software Visualisations
21
search query results, code ownership, and code age.
Keeping the main goal in mind, the analysed software
visualisations also support specific goals, depending
on which aspects of a system’s source code are repre-
sented. SeeSoft aims to allow developers, managers,
and testers to gain insight into the overall structure of
a software system. Almost aims to link the execution
history of a software system back to the correspond-
ing lines of code. Tarantula aims to help developers
in locating faults in a program by illuminating pos-
sible faulty statements. Augur aims to enrich source
code with information corresponding to development
activities in order to coordinate collaborative develop-
ment work.
SQ1.3: Which software engineering activities
are supported? All of the analysed software visu-
alisations employing the code-map metaphor support
the comprehension of one or more aspects of a soft-
ware system. This comprehension process in turn
supports a number of software development activities
including specification, design, implementation, val-
idation, and maintenance (Laplante, 2007). In gen-
eral, software visualisations employing the code map
metaphor can support all presented activities, except
specification. However, the visualisations are mainly
tailored towards supporting software maintenance.
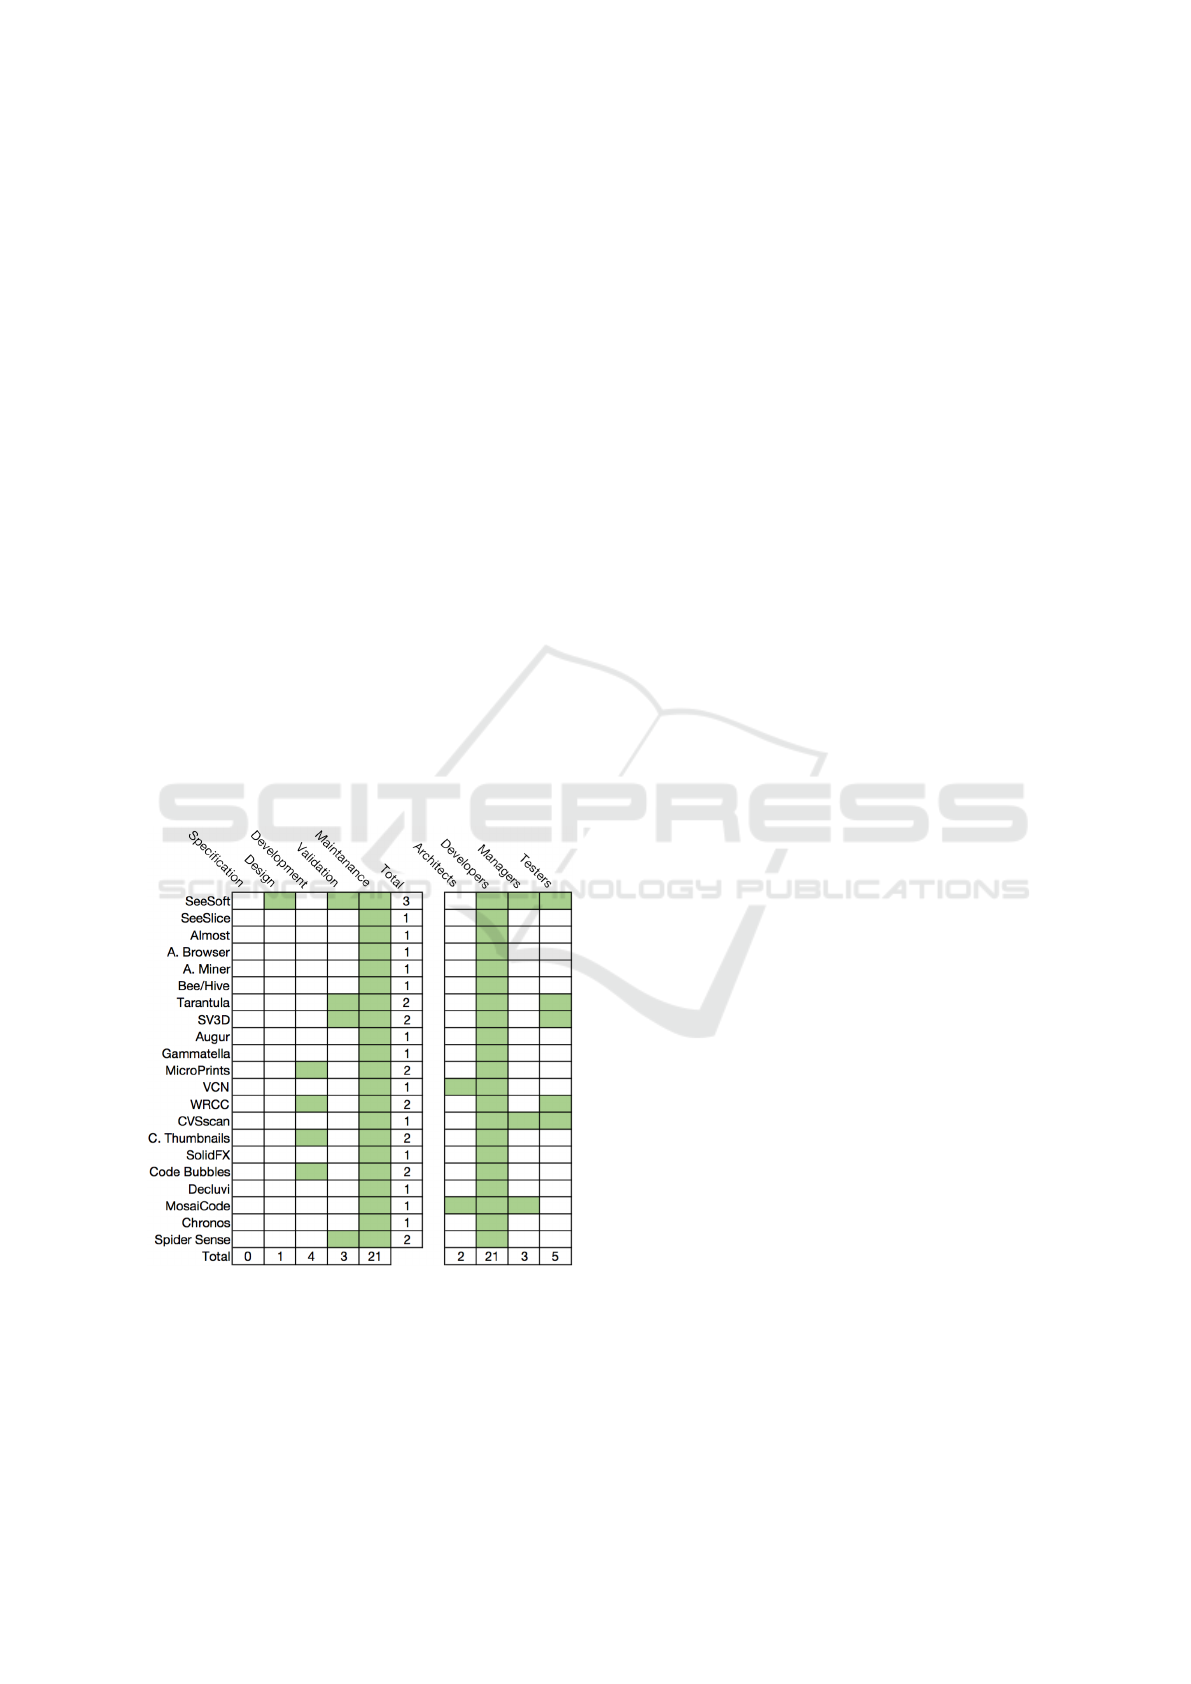
Table 5: SE activities & targeted stakeholders.
Table 5 depicts which of the software engineer-
ing activities are supported by the analysed software
visualisations. All visualisations address the main-
tenance activity, while only a minority address soft-
ware design, development, and validation. A num-
ber of the analysed visualisations, including WRCC,
Tarantula, and MicroPrints, aim to support multiple
actives. The authors of SeeSoft mention support for
designing code and describe how the the code-map
metaphor can be used to determine which subsystems
of a software system would benefit most from an ob-
ject oriented design. The authors of Code Thumb-
nails mainly focus on using the code-map metaphor
to facilitate source code navigation. However, the
tool is incorporated into an integrated development
environment. Therefore, we assume that it supports
the tasks of writing code. Almost utilises the code-
map metaphor for linking execution history to the cor-
responding lines of code in order for developers to
quickly gather enough knowledge about the system
to make small to medium changes. Gammatella and
Tarantula address the activity of verifying code by us-
ing the code-map metaphor for visualising program
faults. This is done be examining the results of test
cases and encoding the corresponding lines of code
with the colour green (passing tests) or red (failing
tests).
4.2 Audience
SQ2.1: For which users are the visualisations in-
tended? The analysed visualisations are targeted to-
wards four types of users: software architects, devel-
opers, managers, and testers. Many of the visualisa-
tions including Tarantula, VCN, and CSVscan men-
tion that the targeted users are maintainers. We as-
sume these to be similar to developers, therefore, the
visualisations which target maintainers are included
in the developer category. Table 5 depicts the tar-
geted users for each of the analysed software visu-
alisations. All visualisations target software devel-
opers/maintainers, where only 2 mention support for
software architects, 3 mention support for software
project managers, and 5 mention support for soft-
ware testers. An interesting finding was that none
of the analysed visualisations were targeted towards
students and/or instructors. Furthermore, none of the
analysed visualisations mention if they are tailored
towards novice or experienced users. This is an im-
portant aspect, as experienced programmers will have
drastically different information needs compared to
novices.
4.3 Target
SQ3.1: Which aspects of the source code are visu-
ally represented? The main data represented is the
source code of a software system. However, visu-
alisations employing the code-map metaphor aim to
visually encode at least one other aspect within the
code, depending on the task at hand. These aspects
IVAPP 2017 - International Conference on Information Visualization Theory and Applications
22
range from code-age to test execution data, to devel-
oper activity. For example, the authors of SeeSoft in-
clude several different examples where colour is used
to encode either execution traces, code structure, code
ownership, code age, code evolution or query results.
Augur displays code structure and developer activity
simultaneously. Aspect Miner and Aspect Browser
both use the code-map metaphor as a means of dis-
playing the results of queries on a global view of a
code base. These queries consist of regular expres-
sions used to locate specific code fragments.
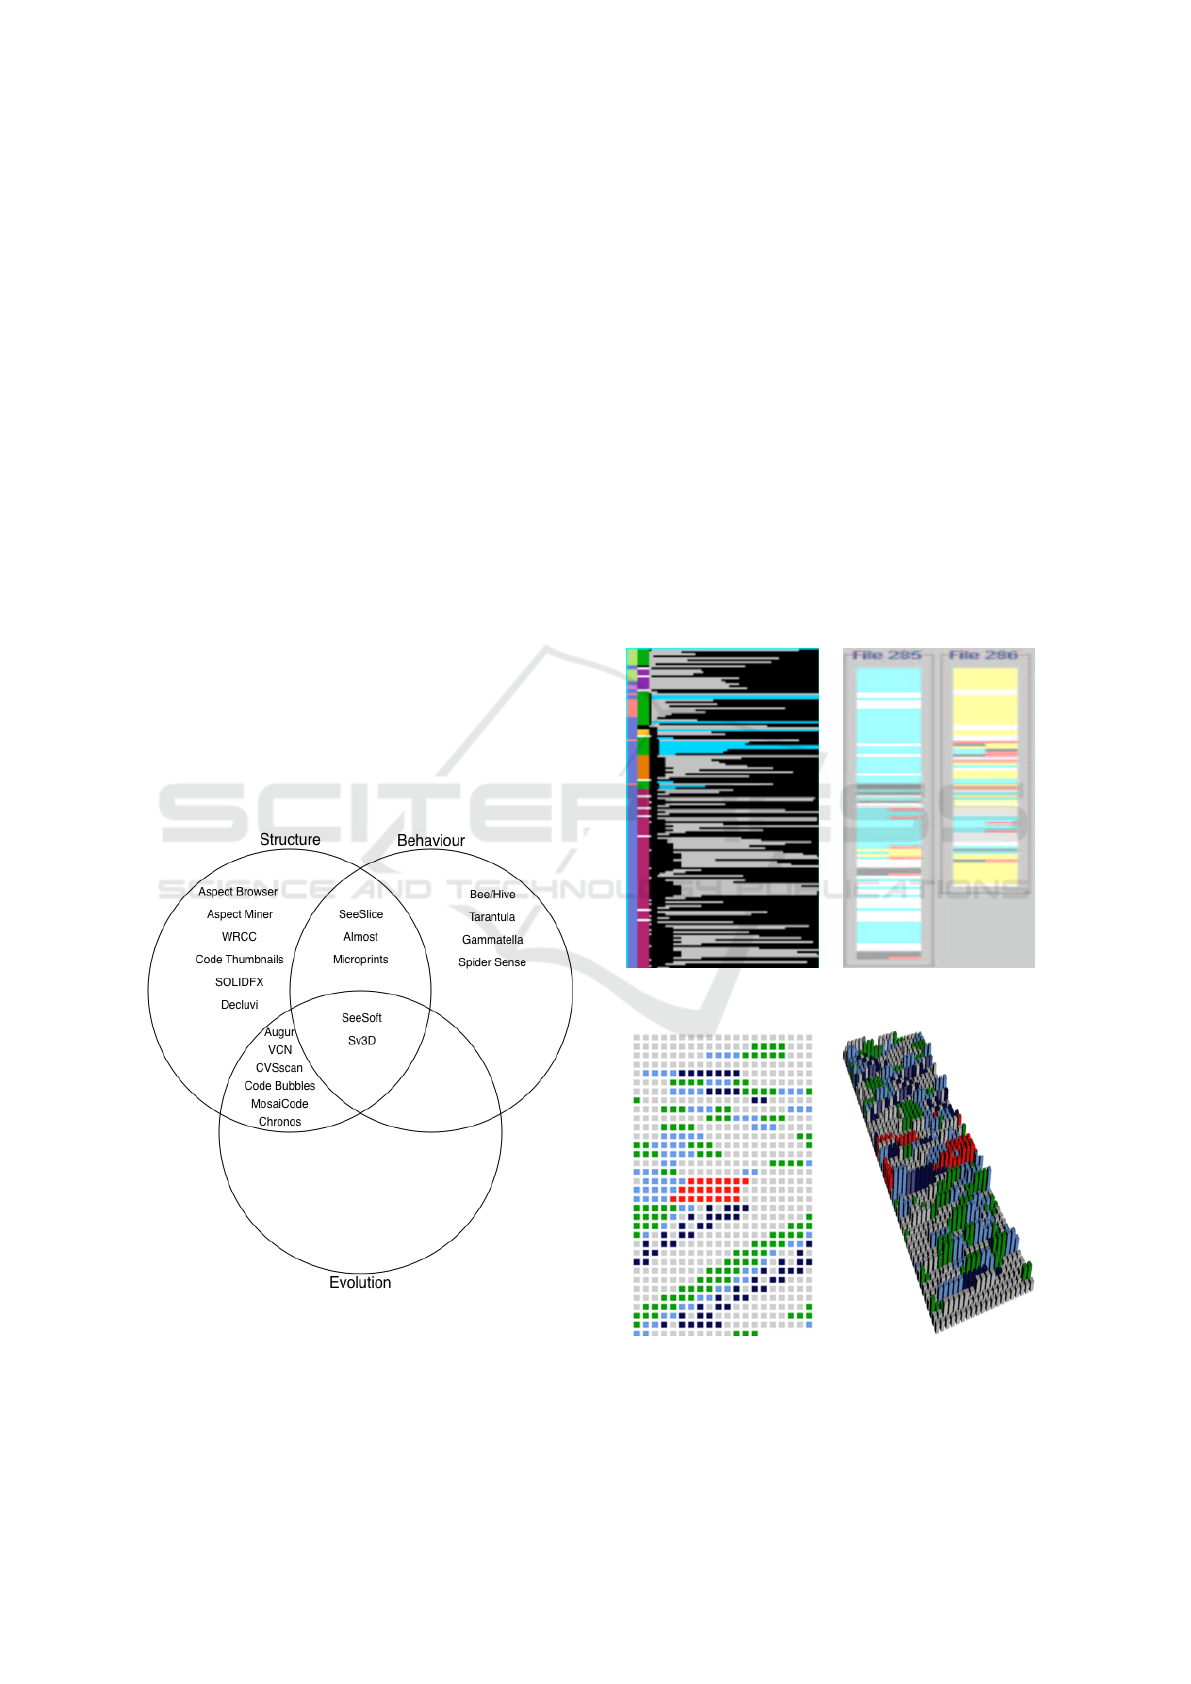
SQ3.2: Do these aspects represent the struc-
ture, behaviour, or evolution of a software sys-
tem? To better understand the use of the code-map
metaphor we categorised the visualisations that were
analysed for this review according to whether they
visualised structure, behaviour, and evolution. The
code-map metaphor can be used to visualise all three,
byt many visualisations focus on a subset. Figure 2
depicts the result of our classification. SeeSoft and
Sv3D correspond to the structure, behaviour, and evo-
lution of a software system. Aspect Browser, Aspect
Miner, and Code Thumbnails are mainly concerned
with visualising the static structure of a software sys-
tem. SeeSlice and MicroPrints visually represent as-
pects corresponding to the static structure and dy-
namic behaviour of a system.
Figure 2: Classification of analysed visualisations.
4.4 Representation
SQ4.1: How is source code mapped to the visual
representation? There are three main approaches to
mapping source code to a code-map representation.
The first approach maps each line of code to a pixel
line, as seen in Figures 3 and 4 . Figure 3 uses the
actual layout of the code, including indentation and
spacing. Visualisations that utilise this mapping in-
clude SeeSoft, Augur, and Tarantula. Figure 4 ignores
the layout of the code and maps each line of code
to a new line in the visual representation, as seen in
Aspect Browser and Aspect Miner. The second ap-
proach (Figures 5 and 6) maps each line of code to a
pixel (2D) or cuboid (3D). Both the 2D and 3D rep-
resentation can be seen in SV3D. The third approach
(Figure 7) is similar to the first approach, however,
it utilises a scaled down font representation instead
of pixel lines. This approach also takes the original
layout of the code into consideration and can be seen
in Code Thumbnails. The most commonly used ap-
proach for mapping lines of code to a display medium
is the pixel line approach depicted in Figure 3.
Figure 3: Pixel line 1. Figure 4: Pixel line 2.
Figure 5: Pixel (2D). Figure 6: Pixel (3D).
SQ4.2: How are the various properties of
source code mapped to the metaphor? Colour is
an important attribute and is used in most tools as a
The Code-Map Metaphor - A Review of Its Use Within Software Visualisations
23
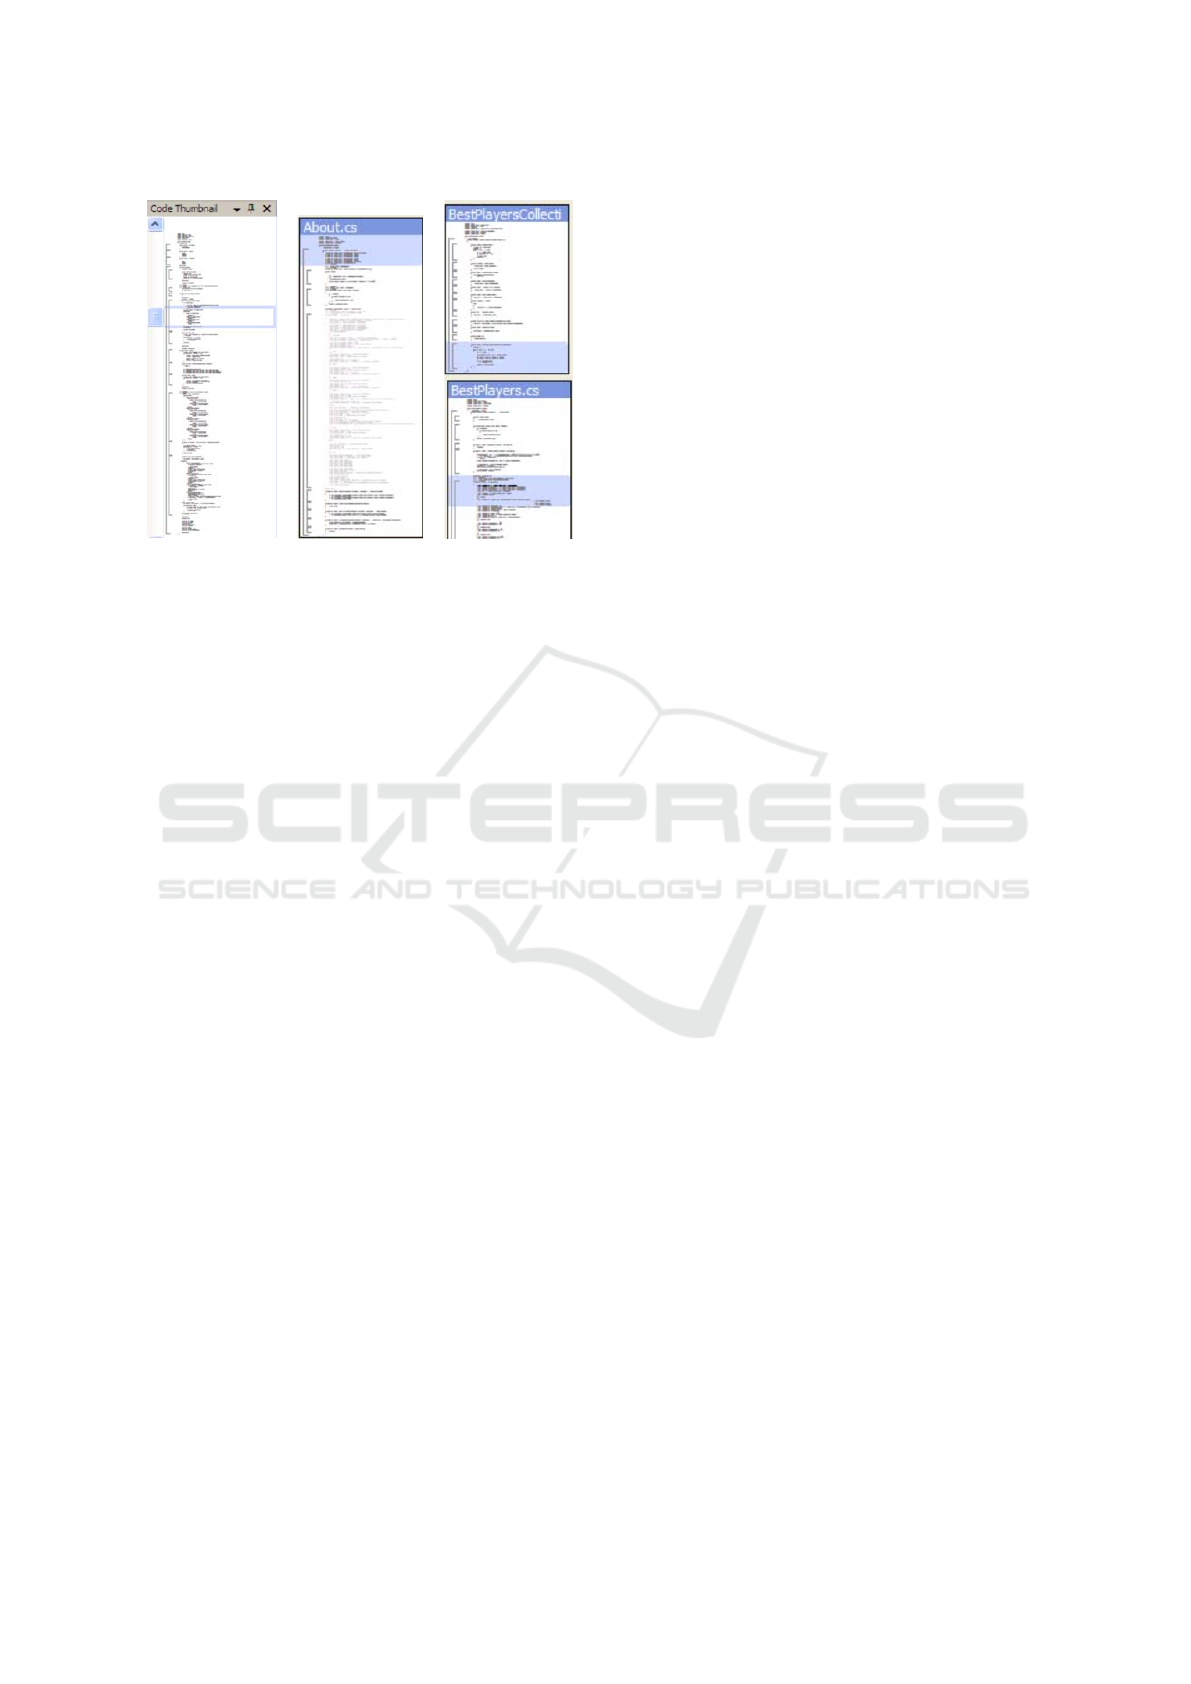
Figure 7: Scaled font.
means for encoding additional information. Aspect
Browser and Aspect Miner use colour to encode the
results of queries in order to make developers aware
which lines of code correspond to the queries. Taran-
tula uses colour to show which lines of code contain
faults. Augur uses colour to depict developer activity
(Figure 3) and SeeSoft uses colour to encode code age
(Figure 1). Several of the analysed software visual-
isations use other means such as lines, shapes, and
annotations to display additional information. The
code-map display in Augur is annotated with informa-
tion in two extra columns that run down the left-hand
side of each module block (Figure 3). The leftmost
column indicates developer activity, while the other
shows code structure by indicating line type (block
comments, method definitions, and method separa-
tors). Juxtaposing these columns allows developers
to see at a glance whether recent activity has added
whole new methods or modified existing ones. Code
Thumbnails uses brackets drawn to the left of the
code-map to convey the nesting structure of the code
(Figure 7).
4.5 Medium
SQ5.1: Which medium is used to display the vi-
sualisation? The medium of choice used to display
visualisations employing the code-map metaphor is a
standard computer display (in cases where authors do
not explicitly state this we feel it is safe to assume).
Some authors (e.g SeeSoft) include additional infor-
mation regarding the display medium supported by
the visualisations, however, this information is mostly
limited to the make and model of the display and the
supported resolution. No approaches mentioned the
use of virtual reality or mobile devices, which is ex-
pected as most were created before these were widely
available.
SQ5.2: Which resources can be used to inter-
act with the visualisation? While most of the anal-
ysed software visualisations employing the code-map
metaphor include information regarding the interac-
tions the visualisations support (e.g zooming, scal-
ing), all fail to provide information in regards to
which interaction devices are supported. Therefore,
we assume that all analysed visualisations support
a standard computer mouse and keyboard. No ap-
proaches mention support for other devices such as
virtual reality headsets or motion capture devices.
4.6 Evidence
SQ6.1: Which methods are used for assessing
the quality of the visualisation(s) employing the
metaphor? Table 6 summarises the description of
evaluation for visualisation included in this study. 14
of the 21 analysed visualisations did not include any
information on whether some type of evaluation was
performed other than providing a simple use case
demonstrating how the visualisation can be used. The
authors of Tarantula, Code Bubbles, and SolidFX did
conduct a quantitative evaluation. However, the eval-
uations measured the effectiveness of an algorithm
rather than the effectiveness of the code-map visu-
alisation. Therefore, this information was excluded
in our study as we focus exclusively on the code-
map metaphor. The papers describing SeeSoft and
SeeSlice provide an informal evaluation, describing
user experiences posthoc. The papers describing As-
pect Browser, Augur, and CSVscan provide obser-
vational evaluations, which present observations the
authors gathered of users using their tools to com-
plete various software development tasks. The pa-
per describing Code Thumbnails provides a quanti-
tative evaluation regarding the usage of the code-map
metaphor in the context of using spatial memory to
navigate source code. Additionally, the authors of
Code Thumbnails include user feedback through a
formal satisfaction questionnaire.
SQ6.2: Which aspects of the visualisation(s)
are evaluated? Of the papers which provided infor-
mation regarding some form of evaluation, all except
Augur and Code Thumbnails were concerned with
observing and evaluating the usage of the tools as a
whole and not of the utilised code-map metaphor. Ta-
ble 6 includes information on which aspects of the vi-
sualisations, presented in Section 3, were evaluated.
The authors of SeeSoft provided informal usage ex-
perience of the tool in the context of exploring un-
familiar code, assigning code ownership to develop-
ers, changing the design of a code base, examining
IVAPP 2017 - International Conference on Information Visualization Theory and Applications
24
developer activities, diffing versions of a code base,
and profiling a code base to find execution hotspots.
The authors of SeeSlice provided an informal us-
age experience of the tools ability to present devel-
opers with dynamic code slices. Papers describing
Aspect Browser, Visual Code Navigator, and Code
Thumbnails provided insight to how each tool can
be used to explore, re-factor, and modify an existing
code base. Furthermore, the paper describing Code
Thumbnails was the only paper to present quantitative
results. These results correspond to how the code-
map metaphor can be used as a navigational aid to
facilitate between and within file navigation.
Table 6: Evaluation type information.
SQ6.3: What are the results and outcomes of
the conducted evaluation(s)? The authors of SeeSoft
and SeeSlice state that by being able to visually see the
structure and change history of a code base or multi-
ple files within the code base, developers are able to
use the tool to drive code discovery and exploration.
Additionally, when using the code-map metaphor to
encode developer activity, it can be used as a means
to assign the ownership of source code files or frag-
ments within a code base to the developers respon-
sible for the majority of changes. Moreover, the au-
thors of SeeSoft note that the reaction of developers
and managers using the tool had been enthusiastic and
many stated that they wished that it had been available
for recent work.
The authors of Aspect Browser observed that the
1
The number of participants was not explicitly stated.
code-map metaphor influenced and aided the comple-
tion of tasks in regards to software evolution. Also,
the processes and strategies developed around the use
of the metaphor were successful in minimising the
introduction of bugs and produced a running system
with a minimum of debugging. The authors of Au-
gur presented observations on how the tool allowed
developers to gain insight into the coding and devel-
opment practises of distributed team members. Addi-
tionally, developers using the tool were interested and
engaged, as a participant from the observational study
noted that an interesting aspect one can comprehend
from the code-map metaphor, in the context of soft-
ware evolution, is the growth of a project over time.
The literature describing Code Thumbnails presented
quantitative results regarding the usage of the code-
map metaphor for search and spatial memory tasks,
as well as for usage during code base re-factoring.
Although developers were able to use standard nav-
igational features in the quantitative evaluation study,
it was clear that all participants frequently used the
code-map features for navigation, searching, and se-
lection. Even under time pressure, participants found
that the code map was easy to learn and helpful.
In summary, the observations and results pre-
sented here suggest that the code-map metaphor is
useful for providing developers with an overview of
a code base or several files within a code base. De-
velopers are able to use software visualisations em-
ploying the metaphor for several tasks including code
discovery, tracking and gaining insight into devel-
oper activities, comparing different versions of a sys-
tem or files, and navigating a large code base. How-
ever, there is a lack of quantitative evidence to support
these claims. Therefore, the effectiveness of the code-
map metaphor remains in question.
5 DISCUSSION
In this section we discuss the limitations of the
evaluations carried out by the authors of the anal-
ysed software visualisations employing the code-
map metaphor. Additionally, shortcomings of the
metaphor, derived from the analysed literature, are
also presented.
5.1 Evaluation
The lack of empirical studies is a shortcoming not
only of software visualisation research, but also of
software engineering and computer science in general
(Diehl, 2007). Quantitative evaluations involving hu-
man participants are time consuming. The authors of
The Code-Map Metaphor - A Review of Its Use Within Software Visualisations
25

Augur support this claim by stating that effective eval-
uation cannot be conducted in a laboratory, as true
validation requires longer-term deployment and an
analysis of the impact of a system on software devel-
opment practises. Therefore, Diehl (Diehl, 2007) rec-
ommends that at least qualitative evaluations should
be performed during the design of visualisation tools
or posthoc. While the majority of software visuali-
sations analysed in this study do present some form
of qualitative evaluation (informal, formal, and ob-
servational), the evaluations have several limitations
in terms of the methodology used for evaluating the
usability code-map metaphor. These limitations are
discussed below.
An important aspect for evaluating the usability
of a software visualisation is the number of partici-
pants incorporated in the study, as well as the method
used to collect observations of the usability of the
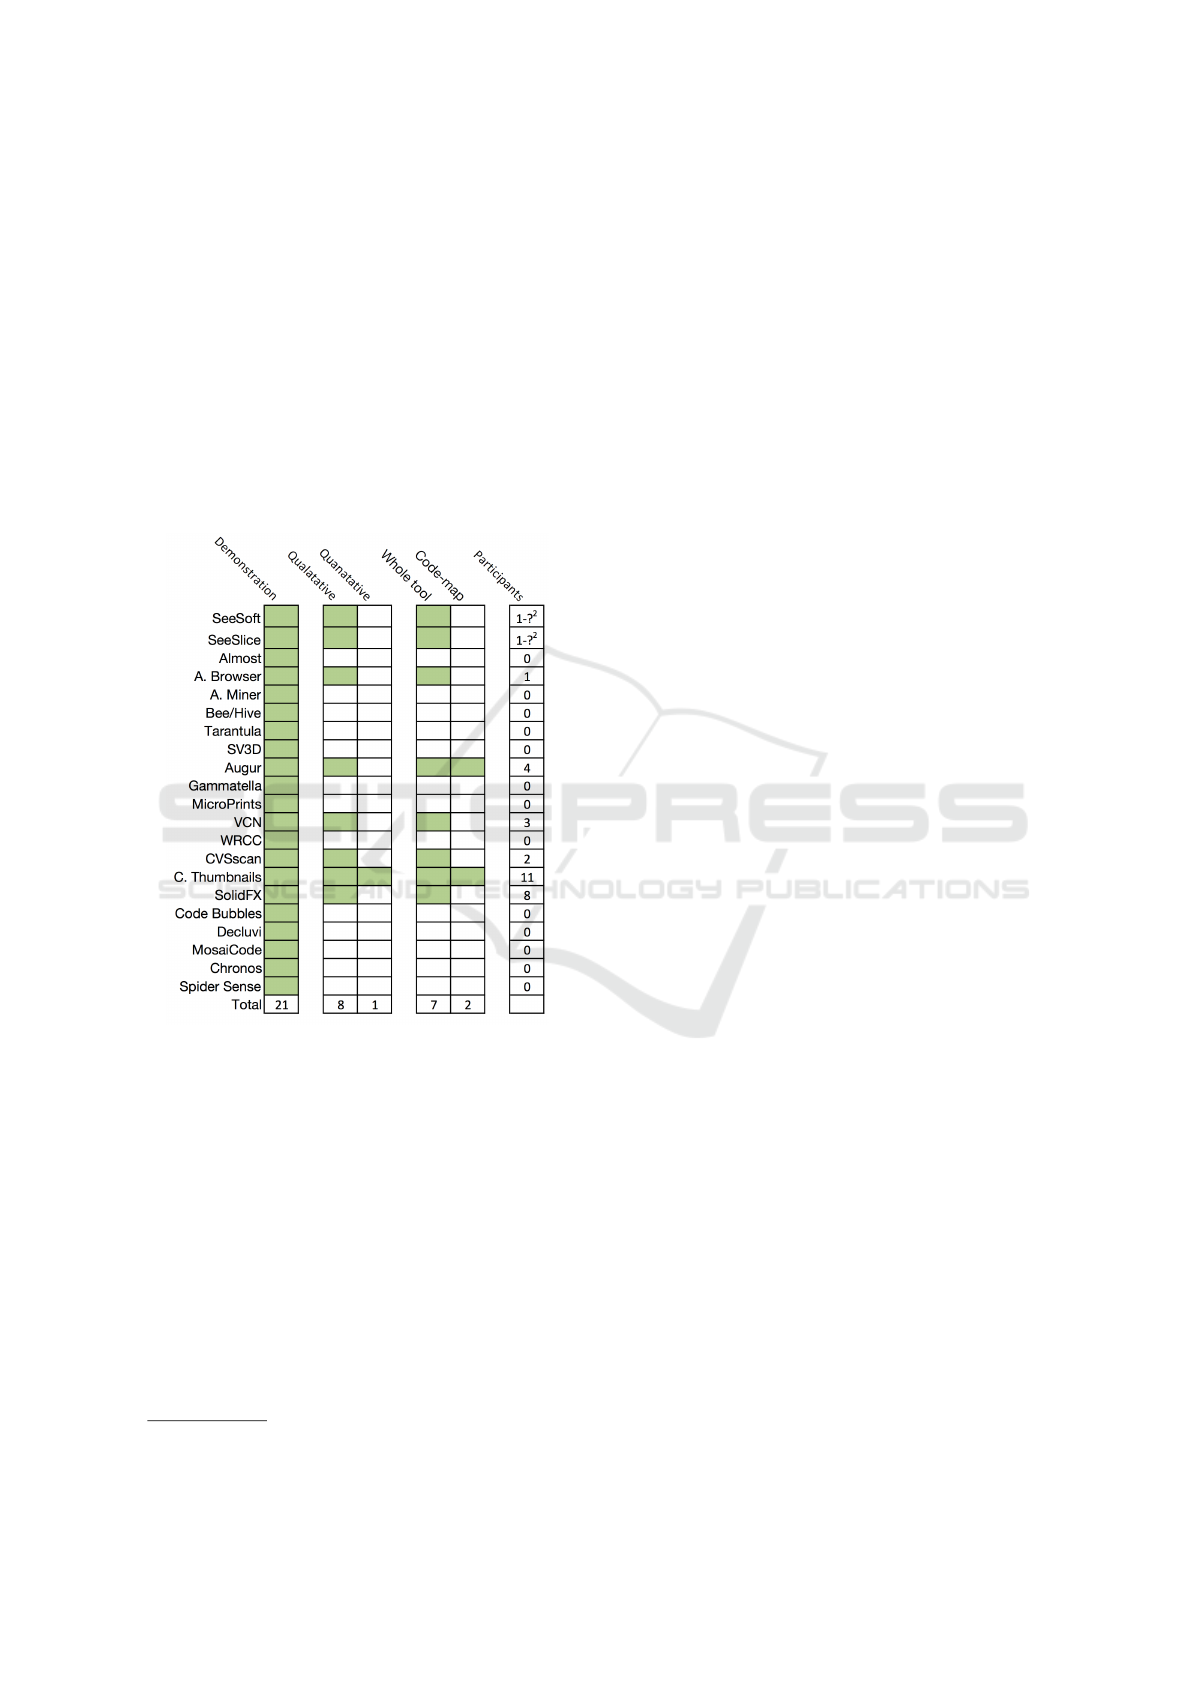
tools. Figure 6 shows the number of participants each
analysed software visualisation used during qualita-
tive and quantitative evaluations. There is no con-
sensus among the evaluations on the number of par-
ticipants needed in order to provide reliable support.
The authors of SeeSoft and SeeSlice do not explicitly
state the number of users that took part in their stud-
ies, therefore, we assume there to have been at least
one. Aspect browser provides observations based on
one user, CSVscan provides observations based on 2
users, while the remaining tools provide results based
on at least 3 users. Nelson (Nielsen, 2000) consid-
ers that at least 15 participants are needed to discover
all usability issues. However, Nielson (Nielsen, 2000)
also proposes that the best results come from testing
no more than 5 users and running many small tests.
For quantitative studies Nielson (Nielsen, 2006) sug-
gests that 20 participants typically offer a reasonably
tight confidence interval. Bridging these findings with
our study, the reader will find that from all of the anal-
ysed software visualisation tools, none meet the re-
quirements specified by Nielson. Therefore, in order
to provide a consensus among the number of partic-
ipants future evaluations should consider incorporat-
ing, we suggest using the numbers provided by Niel-
son’s research.
Regarding the method used to collect observations
of the usability of a tool, the authors of SeeSoft and
SeeSlice present the experiences of developers and
managers using the tools, but it is unclear how these
experience reports were obtained. The authors of
CSVscan use a silent observer to record both user ac-
tions and findings during tool usage. The authors of
the paper on Aspect Browser use a method similar to
the think-aloud protocol (Nielsen, 2012). When us-
ing a think-aloud protocol, test participants are asked
to use a system while continuously verbalising their
thoughts as they move through the user interface. The
main benefits of using the protocol include that there
is no special equipment needed, it can be used at any
stage in the development life-cycle, and the protocol
is easy to learn. While the authors of Aspect Browser
observe the activities of a single developer we believe,
however, that the method used to obtain these obser-
vations can be considered a step in the right direction.
Thus, for future evaluations we suggest using a think-
aloud protocol (Nielsen, 2012).
5.2 Limitations
Regarding the limitations of the code map metaphor,
publications corresponding to SV3D and SeeSoft in-
clude this information. We were able to extract 4
main limitations from these publications. The first is
that the 2D line representation limits the number of
attributes that can be visualised, as well as the type
of relationships and hierarchies that can be shown.
SV3D tries to tackle this limitation by using 3D in-
stead of 2D. The second limitation mentioned in the
literature is that the metaphor includes little support
for multiple abstraction levels. This limitation is sup-
ported by the fact that most of the analysed tools for
this study include multiple views or multiple visuali-
sation in a single view. The third limitation is that the
metaphor limits the usage of the available 2D space,
as the space is used to depict multiple files using a
zoomed out representation. However we believe that
this aspect cannot be considered a limitation, as the
main goal of the code-map metaphor is to present as
many files as possible to provide developers with an
overview of a code base. There is a limit to the num-
ber of lines of code that can be visualised at a single
point in time, but this is due to the limitations of avail-
able screen real estate. Finally, the fourth limitation is
that there is a lack of mechanisms that offer flexibility
to stakeholders in customising their visualisations.
6 CONCLUSION
In this work we provide an extensive review of the
code-map metaphor and analyse 21 software visual-
isations, all of which employ the metaphor. Using
an extended task oriented framework, we were able
to extract information regarding the task, audience,
target, medium, representation, and evidence dimen-
sions.
In summary the code-map metaphor, first pro-
posed by Eick et al. (Eick et al., 1992) in the early
nineties in a tool named SeeSoft, is widely perceived
IVAPP 2017 - International Conference on Information Visualization Theory and Applications
26

to be useful for software development. This is due
to the fact that the metaphor uses a natural and direct
mapping from the visual representation to the source
code and back, which leads to a natural navigation be-
tween multiple representations (Marcus et al., 2003a).
This yields high levels of trust on behalf of the user,
which is supported by qualitative observation from
several of the analysed tools. However, to date, lit-
tle to no quantitative data exists in the literature that
supports the claim that the use of the metaphor can
facilitate the process of software development.
The authors of Code Thumbnails provide quanti-
tative evidence that if present, a code-map visualisa-
tion feature will be used by developers for the tasks
of code exploration, navigation, and selection. Ad-
ditionally, developers using Code Thumbnails were
also starting to form a cognitive map of the code
base. We believe that this is an interesting and im-
portant finding as it provides initial evidence that the
code-map metaphor is useful for exploring and nav-
igating large code bases, as observations from the
usage of Aspect Browser support this claim. Using
these findings, we believe that a worthwhile direc-
tion for future work could be investigating the use
of the code-map metaphor in integrated development
environments, extending the work of Code Thumb-
nails. Furthermore, various source code editors, such
as Sublime Text
3
include a code-map of the currently
focused document. However, to date, no empirical
evidence, other than the results described in Code
Thumbnails, has been found to provide information
about the usefulness of this approach.
A large amount of information relating to soft-
ware developer activities and static characteristics of
source code can be obtained from source code repos-
itories, as it is already available in most revision con-
trol systems. We believe that visualisations employ-
ing the code-map metaphor should be able to provide
most of the above stated information to the user us-
ing a layering mechanism similar to that of an online
map (e.g. Google maps). Depending on the task at
hand, this would allow developers to switch between
viewing different types of information dynamically
and provide a way to tailor the visualisation to help
complete a specific task or answer a specific question.
REFERENCES
Ball, T. and Eick, S. (1996). Software visualization in the
large. Computer, 29(4).
Ball, T. and Eick, S. G. (1994). Visualizing program
2
https://www.sublimetext.com/
slices. Visual Languages, 1994. Proceedings., IEEE
. . . , (October):288–295.
Bragdon, A., Reiss, S. P., Zeleznik, R., Karumuri, S.,
Cheung, W., Kaplan, J., Coleman, C., Adeputra, F.,
and LaViola, J. J. (2010). Code bubbles: rethinking
the user interface paradigm of integrated development
environments. 2010 ACM/IEEE 32nd International
Conference on Software Engineering, 1:455–464.
Caserta, P. and Zendra, O. (2011). Visualization of the static
aspects of software: A survey. IEEE Transactions
on Visualization and Computer Graphics, 17(7):913–
933.
De Line, R., Czerwinski, M., Meyers, B., Venolia, G.,
Drucker, S., and Robertson, G. (2006). Code Thumb-
nails: Using spatial memory to navigate source code.
Proceedings - IEEE Symposium on Visual Languages
and Human-Centric Computing, VL/HCC 2006, pages
11–18.
Diehl, S. (2007). Software visualization: Visualizing the
structure, behaviour, and evolution of software.
Ducasse, S., Lanza, M., and Robbes, R. (2005). Multi-level
method understanding using microprints. In Proceed-
ings - VISSOFT 2005: 3rd IEEE International Work-
shop on Visualizing Software for Understanding and
Analysis, pages 33–38.
Eick, S. G., Steffen, J. L., and Sumner, E. E. J. (1992).
SeeSoft: A tool for visualizing line-oriented software
statistics. IEEE Transactions on Software Engineer-
ing, 18(11):957–968.
Froehlich, J. and Dourish, P. (2004). Unifying Artifacts and
Activities in a Visual Tool for Distributed Software
Development Teams. In Proceedings of the 26th Inter-
national Conference on Software Engineering, pages
387–396. IEEE Computer Society.
Ghanam, Y. and Carpendale, S. (2008). A survey paper
on software architecture visualization. University of
Calgary, Tech. Rep.
Griswold, W. G., Yuan, J. J., and Kato, Y. (2001). Exploit-
ing the map metaphor in a tool for software evolution.
Proceedings of the 23rd International Conference on
Software Engineering. ICSE 2001, (March):265–274.
Hannemann, J. and Kiczales, G. (2001). Overcoming the
Prevalent Decomposition of Legacy Code. In Work-
shop on Advanced Separation of Concerns, 167(May).
Islam, S. S., Krinke, J., and Binkley, D. (2010). Dependence
cluster visualization. In Proceedings of the 5th inter-
national symposium on Software visualization, pages
93–102.
Jones, J., Harrold, M. J., and Stasko, J. (2002). Visual-
ization of test information to assist fault localization.
Proceedings of 24th International Conference on Soft-
ware Engineering, pages 467–477.
Kitchenham, B. and Charters, S. (2007). Guidelines for
performing Systematic Literature reviews in Software
Engineering Version 2.3. Engineering, 45(4ve):1051.
Laplante, P. A. (2007). What every engineer should know
about software engineering.
Lommerse, G., Nossin, F., Voinea, L., and Telea, A. (2005).
The Visual Code Navigator: An interactive toolset for
The Code-Map Metaphor - A Review of Its Use Within Software Visualisations
27

source code investigation. Proceedings - IEEE Sympo-
sium on Information Visualization, INFO VIS, pages
25–32.
Maletic, J. I., Marcus, A., and Collard, M. L. (2002). A
Task Oriented View of Software Visualization. In Pro-
ceedings - 1st International Workshop on Visualizing
Software for Understanding and Analysis, VISSOFT
2002.
Maletic, J. I., Marcus, A., and Feng, L. (2003). Source
viewer 3D (sv3D): a framework for software visual-
ization. In Proceedings of the 25th International Con-
ference on Software Engineering, pages 812–813.
Maletic, J. I., Mosora, D. J., Newman, C. D., Collard, M. L.,
Sutton, A., and Robinson, B. P. (2011). MosaiCode:
Visualizing large scale software - A tool demonstra-
tion. In Proceedings of VISSOFT 2011 - 6th IEEE In-
ternational Workshop on Visualizing Software for Un-
derstanding and Analysis, pages 1–4.
Marcus, A., Feng, L., and Maletic, J. (2003a). 3D repre-
sentations for software visualization. In Proceedings
of the 1st ACM symposium on Software visuallization,
pages 27–36.
Marcus, A., Feng, L., and Maletic, J. I. (2003b). Com-
prehension of software analysis data using 3D visu-
alization. Program Comprehension, 2003. 11th IEEE
International Workshop on, pages 105–114.
M
¨
uller, R. and Zeckzer, D. (2015). Past, Present, and Fu-
ture of 3D Software Visualization - A Systematic Lit-
erature Analysis. Proceedings of the 6th International
Conference on Information Visualization Theory and
Applications, pages 63–74.
Munzner, T. and Maguire, E. (2015). Visualization analysis
& design.
Nielsen, J. (2000). Why you only need to test with 5 users.
Nielsen, J. (2006). Quantitative studies: How many users to
test.
Nielsen, J. (2012). Thinking aloud: The # 1 usability tool.
O’Reilly, C., Bustard, D., and Morrow, P. (2005). The war
room command console: shared visualizations for in-
clusive team coordination. In Proceedings of the 2nd
ACM symposium on Software visuallization, volume
St. Louis,, pages 57–65.
Orso, A., Jones, J., Harrold, M. J., and Stasko, J. (2004).
GAMMATELLA: visualization of program-execution
data for deployed software. In Proceedings of the
1st ACM symposium on Software visuallization, pages
699–700.
Petre, M. and Quincey, E. D. (2006). A gentle overview of
software visualisation. PPIG News Letter, (Septem-
ber):1 – 10.
Reddy, N. H., Kim, J., Palepu, V. K., and Jones, J. A.
(2015). SPIDER SENSE: Software-engineering, net-
worked, system evaluation. In 2015 IEEE 3rd Working
Conference on Software Visualization, VISSOFT 2015
- Proceedings, number 1, pages 205–209.
Reiss, S. (2001a). Bee/hive: A software visualization back
end. IEEE Workshop on Software Visualization, pages
1–5.
Reiss, S. P. (1999). Almost : Exploring Program Traces. In
NPIVM, pages 70–77.
Reiss, S. P. (2001b). An overview of BLOOM. Proc. 2001
ACM SIGPLAN-SIGSOFT Work. Progr. Anal. Softw.
tools Eng. - PASTE ’01, pages 2–5.
Reiss, S. P. and Tarvo, A. (2013). Tool demonstration:
The visualizations of code bubbles. In 2013 1st IEEE
Working Conference on Software Visualization - Pro-
ceedings of VISSOFT 2013.
Robbes, R., Ducasse, S., and Lanza, M. (2005). Micro-
prints: A Pixel-based Semantically Rich Visualiza-
tion of Methods. In Proceedings of 13th International
Smalltalk Conference (ISC’05), number August 2005,
pages 131–157.
Schots, M. and Werner, C. (2014). Using a task-oriented
framework to characterize visualization approaches.
In Proceedings - 2nd IEEE Working Conference on
Software Visualization, VISSOFT 2014, pages 70–74.
Servant, F. and Jones, J. A. (2013). Chronos: Visualizing
slices of source-code history. In 2013 1st IEEE Work-
ing Conference on Software Visualization - Proceed-
ings of VISSOFT 2013.
Shahin, M., Liang, P., and Babar, M. A. (2014). A system-
atic review of software architecture visualization tech-
niques. Journal of Systems and Software, 94:161–185.
Sharafi, Z. (2011). A Systematic Analysis of Software
Architecture Visualization Techniques. 2011 19th
IEEE International Conference on Program Compre-
hension, pages 254–257.
Shonle, M., Neddenriep, J., and Griswold, W. (2004). As-
pect Browser for Eclipse. Proceedings of the 2004
OOPSLA workshop on eclipse technology eXchange -
eclipse ’04, pages 78–82.
Telea, A. and Voinea, L. (2008). An interactive reverse en-
gineering environment for large-scale C++ code. In
Proceedings of the 4th ACM symposium on Software
visuallization, pages 67–76.
Telea, A. C. (2015). Data Visualization: Principles and
Practice.
Teyseyre, A. R. and Campo, M. R. (2009). An overview
of 3D software visualization. IEEE Transactions on
Visualization and Computer Graphics, 15(1):87–105.
Voinea, L., Telea, A., and van Wijk, J. J. (2005). CVSscan:
visualization of code evolution. In Proceedings of the
2nd ACM symposium on Software visuallization, vol-
ume 1, pages 47–56.
Ward, M., Grinstein, G., and Keim, D. (2015). Interactive
Data Visualization. Foundations, Techniques, and Ap-
plications.
Xie, X., Poshyvanyk, D., and Marcus, A. (2005). Support
for static concept location with sv3D. In Proceedings -
VISSOFT 2005: 3rd IEEE International Workshop on
Visualizing Software for Understanding and Analysis,
pages 102–107.
IVAPP 2017 - International Conference on Information Visualization Theory and Applications
28
