
RGB-D-λ: 3D Multispectral Acquisition with Stereo RGB Cameras
Alain Trémeau
1
, Simone Bianco
2
and Raimondo Schettini
2
1
Laboratoire Hubert Curien UMR 5516, University Jean Monnet, 18 Rue Benoit Lauras, Saint-Etienne, France
2
DISCo – Dept. of Informatics, Systems and Communication, University of Milano-Bicocca, Milano, Italy
Keywords: Recovery Reflectance Spectra, Color Calibration, 3D Reconstruction.
Abstract: In this paper we report some key questions related to the acquisition of accurate color images adressed by
the Colour and Space in Cultural Heritage (COSCH) project. We summarize the main criteria defined by
COSCH Working Group 1 and used by the authors to help Digital Cultural Heritage (DCH) users to have a
deepen knowledge and understanding of the constraints, preconditions and practical aspects related to the
use of a multi-spectral acquisition system. We also report how color data can be estimated from spectral
data and discuss several issues related to the measurement of reflective surfaces by 2D imaging systems.
1 INTRODUCTION
The paper introduces some key questions concerning
the acquisition of accurate color images in Digital
Cultural Heritage (DCH) identified through the
“Colour and Space in Cultural Heritage” project (see
www.COSCH.info), a trans-domain European Action
(TD1201) supported, since 2013, by the European
Cooperation in Science and Technology. The results
reported in this paper were done in collaboration with
the COSCH Working Group 1 (WG1) and will be
included in the interim report of this working group
which will be published on the next COSCH bulletin
(see http://cosch.info/publications/). This work is part
of a larger project in which the colorimetric accuracy
of traditional devices characterized with state-of-the-
art techniques (Bianco, Gasparini et al., 2008,
Bianco, Schettini et al., 2009, Bianco, Bruna et al.
2011) is compared with multispectral devices
(Bianco, Colombo et al., 2011).
The activities of WG1 are mainly focused on the
“identification, characterization and testing of
spectral imaging techniques in the visible and near
infrared (IR) field” and on the “identification,
characterization and testing of imaging techniques
beyond the visible and short wave radiation” for the
study and documentation of CH artefacts. Until now,
most of the activities supervised by the WG1 have
been dedicated to the use of spectral imaging
techniques to the investigation of artworks, mainly 2-
D objects such as paintings. Spectral imaging
systems are in general grouped in multi-band, multi-
spectral and hyper-spectral systems depending on the
number of bands selected over a given spectral
interval and on their bandwidths. In the period 1989-
2004, several projects (such as CRISATEL (Ribes,
2005), VASARI (Saunders, 1993) or NARCISSE
(Lahanier, 2003)), or reports (e.g. see (Liang, 2004,
Imai, 2010)) focused on the use of 2-D multi-band
and 2-D multi-spectral imaging systems, shown the
importance of spectral information to characterize 2-
D cultural heritage objects in the visible field. In the
last decade new developments in optical techniques
led to novel ways of splitting the visible radiation
(light). The COSCH WG1 decided in 2013 to explore
the limits and advantages of the actual instruments in
these wavebands. This WG1 defined a “Round Robin
Test” (RRT) in order to compare color and
spectroscopic measurements, as well as information
on calibrated standards and laboratory mock-ups
obtained through the use of diverse imaging devices
or prototypes, specifically designed for high-quality
digital imaging of artworks and for conservation
purposes, developed by the different research groups
that participate in the COSCH Action. In their
preliminary works, WG1 members agreed that there
are still no well-established and commonly accepted
criteria and guidelines for the selection and the use of
one of the above mentioned imaging systems. In this
paper, we summarize the main criteria defined by
COSCH WG1 and used by the authors to help
Cultural Heritage users to have a deepen knowledge
and understanding of the constraints, preconditions
Trémeau, A., Bianco, S. and Schettini, R.
RGB-D-λ: 3D Multispectral Acquisition with Stereo RGB Cameras.
DOI: 10.5220/0005845406890696
In Proceedings of the 11th Joint Conference on Computer Vision, Imaging and Computer Graphics Theory and Applications (VISIGRAPP 2016) - Volume 4: VISAPP, pages 689-696
ISBN: 978-989-758-175-5
Copyright
c
2016 by SCITEPRESS – Science and Technology Publications, Lda. All rights reserved
689
and practical aspects related to the selection and the
use of a multi-spectral acquisition system. Next, we
report how color data can be estimated from spectral
data and discuss several issues related to the
measurement of reflective surfaces by 2D imaging
systems.
2 ACCURACY OF 3D COLOR
ACQUISITIONS
In (Boochs, 2015) the authors reported how to
perform color acquisition using a multispectral
system and what are the effects due to parametric
factors (e.g. exposure time, camera response, etc.)
and other external factors (e.g. spectral distribution of
the lighting source) influencing the accuracy of color
acquisition. They also reported how to evaluate the
accuracy of a multispectral system and how to
improve this accuracy by color calibration using a
standardized color chart (e.g. the color checker
chart). Other papers also addressed these issues, such
as (Lopez-Alvarez, 2009, De Lasarte Rigueiro,
2009). Nevertheless there is still no well-established
and commonly accepted criteria and guidelines for
the selection and the use of standardized color charts
for accurate color calibration of multispectral
imaging systems. The number of color samples, the
color gamut, the spectral distribution and the
reflectance property of these samples are the four
main factors influencing the accuracy of the
calibration process. It is also important to remind that
the color rendering of digitized images depends also
of many other parameters, such as viewing geometry,
lighting geometry, camera settings, etc. (Faridul,
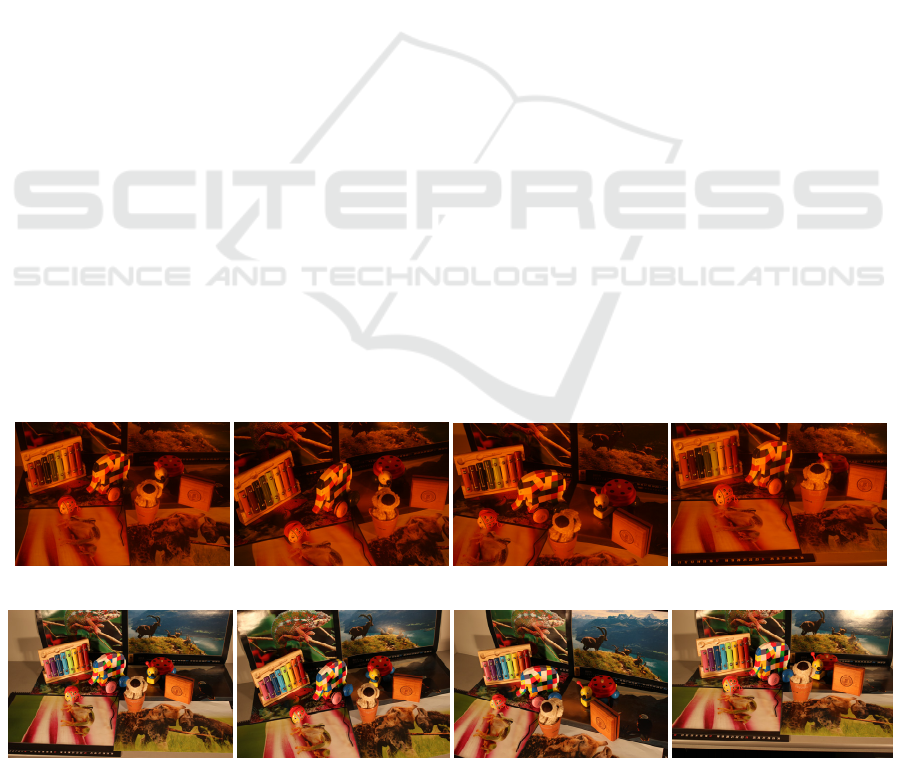
2015). As example, in Figure 1, due to shadows,
highlights, surfaces reflectance, viewing geometry,
camera settings, color filters, etc. the scene digitized
has different color appearances. As a consequence,
for each viewing geometry used (i.e. each 2D color
acquisitions) we suggest to apply again color
calibration. As example, the scene shown in Figure 1
was acquired from 8 viewing positions (see Figure
2). In order to digitize this 3D scene with accurate
color values, one solution consists: first to select
sample colors on different object surfaces (as shown
in Figure 3); next to calibrate each 2D view from the
expected color values (using a sparse approach); and
lastly to refine the color calibration (i.e. to minimize
color differences) by color correction (using a dense
approach). We suggest to use the solution proposed
by H.S. Faridul et al. to minimize color errors
between 2D views with high overlap (De Lasarte
Rigueiro, 2009).
The results of the calibration process depends
also of the material property of the color chart used,
thus it is possible to obtain different values with one
color checker chart or with another one. We
experimented this with the color checked chart of the
Round Robin Test, and two other color checker
charts (used at Saint-Etienne and Milano).
To evaluate color differences between measured
values and expected values, users can use the
CIELAB ΔE metric or similar metrics such as the
CIEDE2000. To evaluate spectral differences
between measured (or estimated) spectral values and
expected values, users can use the mean value and
the standard deviation of difference values between
spectral data. Another option consist to compute the
percentage of the Integrated Irradiance Error metric
(IIE(%)) which is a relative measurement of the
(a) Same scene viewed under four viewing positions and acquired with a RGB CANON camera sensor with a red filter (wide band filter)
put in front of the camera.
(b) Same scene viewed under four viewing positions and acquired with another RGB CANON camera sensor.
Figure 1: Example of a complex scene (composed of 3D objets put on and in front of colored planar surfaces) digitized by
two cameras under different viewing positions.
RGB-SpectralImaging 2016 - Special Session on RBG and Spectral Imaging for Civil/Survey Engineering, Cultural, Environmental,
Industrial Applications
690
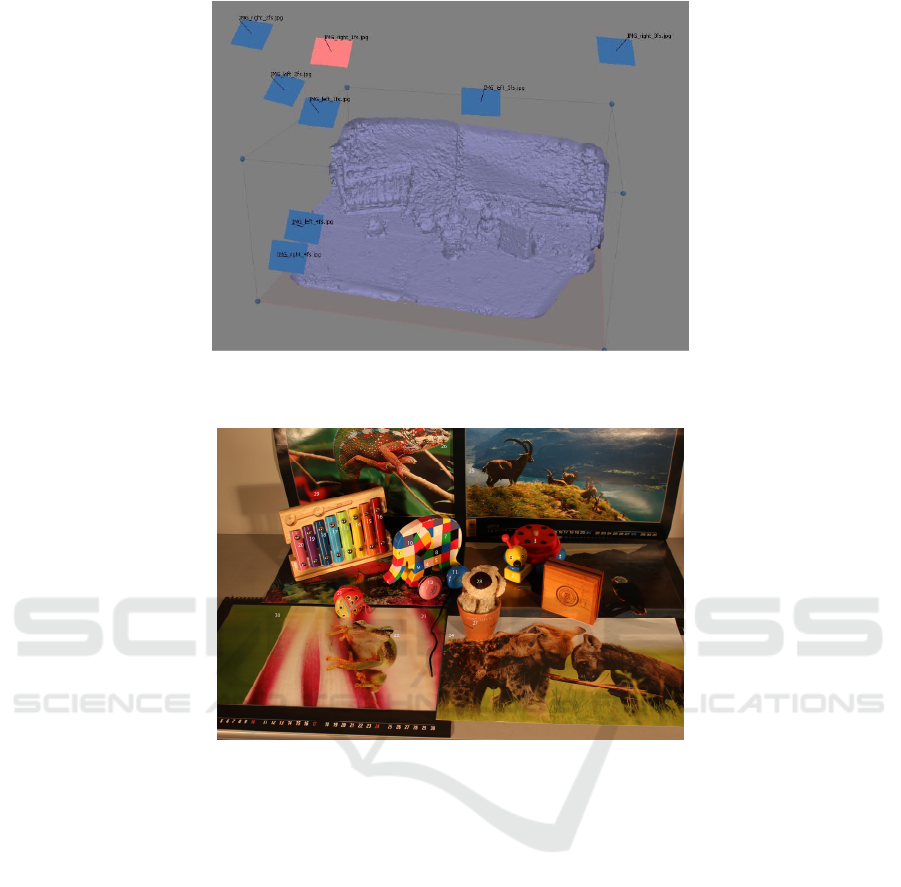
Figure 2: Screenshot of the dense reconstruction (922.000 points – 185.000 faces) of the 3D scene by the software Agisoft.
The 8 positions of cameras used are illustrated by blue and pink squares.
Figure 3: Position of the 29 samples (manually selected in different areas) measured by the spectroradiometer MINOLTA
CS1000.
difference in the total energy of the two spectral
curves being compared (viggiano, 2002), or to use
the colorimetric and spectral combined metric
(cscm) (lópez-álvarez, 2005) which is based on the
comparison of the spectra of natural illuminants
from the colorimetric and spectral points of view.
3 RECOVERY OF
REFLECTANCE SPECTRA
FROM COLOR SENSORS
In the state of the art, several solutions are proposed
to recover reflectance spectra from color values.
Some solutions are based on 3D interpolation, 2D
interpolation, non-negative matrix transformation or
hybrid methods (Kim, 2012). In (Zuffi, 2008) Zuffi
et al. demonstrated that the estimation of the spectra
of objects surfaces could be performed from data
having lower dimensionality (e.g. from a RGB
camera or from a generic N-filters camera
responses). They proposed a solution, based on a
linear model, which exploits the smoothness of
surface reflectance functions. Several other methods,
which also exploit the smoothness of surface
reflectance functions, have been proposed to
generate physically realizable natural spectra, while
some additional limitations would constrain the
recovered spectra (Peyvandi, 2011).
Several global optimization methods have been
proposed to recover the spectra reflectance (Dupond,
2002). Recent works have improved the spectra
recovery accuracy using local methods. In (Bianco,
2010) Bianco proposed a local optimization-based
method which is able to recover the reflectance
spectra with the desired tristimulus values, choosing
the metamer with the most similar shape to the
RGB-D-λ: 3D Multispectral Acquisition with Stereo RGB Cameras
691
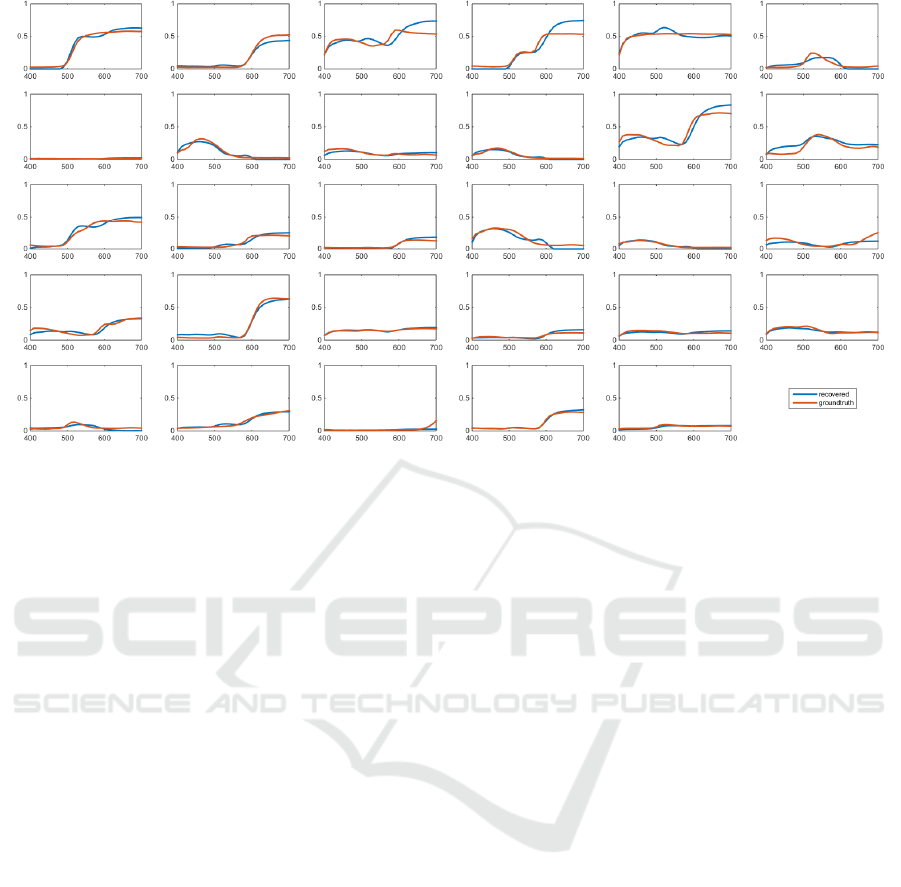
Figure 4: Recovery of the spectral distribution of the 29 samples selected in the scene considered.
reflectances available in a training set. The
reflectance spectra of the Munsell Atlas, the Vhrel
dataset, the Gretag MacBeth Color Checker CC, and
the Gretag MacBeth Color Checker DC were used as
samples in (Bianco, 2010).
In this paper we propose to recover reflectance
spectra, from N optical filters put in front of a RGB
camera sensor, using a two-step process. In our
experiment we performed several tests in two
different setups: i) using one large-band color filter
and two color camera sensors (to simulate a 6 bands
camera sensor, see example shown in Figure 1); ii)
30 narrow-band color filters and one monochromatic
camera (see example shown in Figure 7). The idea is
to combine the global optimization method proposed
by Zuffi et al. (Zuffi, 2008) with the local
optimization method proposed by Bianco (Bianco,
2010). Meanwhile the first method is used to
initialize the recovery of the spectra reflectance, the
second one is used in a second step to refine the
recovery.
The method of Zuffi et al. (Zuffi, 2008) has been
chosen as specifically designed to address the
problem that reflectance spectra can be unfeasible:
in fact the recovered reflectance can often present
lobes outside the range [0%, 100%], or can present
atypical spikes due to the reconstruction method or
to the clipping of the recovered reflectance in the
admissible range. The algorithm (Zuffi, 2008) starts
with estimating the recovered reflectance through a
linear combination of a spectral basis and then
decomposing it into the parts of spectrum inside,
above and under the admissible range, respectively.
An iterative procedure then starts to reduce the
magnitudes of the parts above and below the
admissible range. At each step, a smoothing
procedure can be run on them. The procedure ends
when the required accuracy or the maximum
number of iterations has been reached.
The final recovery is performed using the
method by Bianco (Bianco, 2010), using the
previous one as initialization. The method (Bianco,
2010) has the advantage of using multiple spectral
bases for the reconstruction. The basis is
automatically chosen on the basis of the position in
the color space of the sample to be recovered. The
main steps of the method are reported in Figure 8,
where V
0
and B are fixed basis, V
1
is the adaptive
one, GFC is the Goodness of Fit Coefficient
(Hernàndez-Andrés, 2001), and p is a value to be
heuristically set.
The results shown in Figures 4 and 5
demonstrate that this solution is efficient. However,
some errors are noticeable. For instance in Figure 4
for samples #3 (red sample on the ladybird at right),
#4 (light pink sample on the elephant), #5 (pink
sample on the elephant), #11 (blue sample on the
wheel below the elephant) and #12 (pink sample on
the wheel below the elephant). This is mainly due to
the non-uniformity of these samples (reflective
surfaces) and of their size (which was for some of
them lower that the viewing field of the spectro-
radiometer used). The Figure 6 shows the result of
the 3D reconstruction obtained from the 6-bands
camera sensor setup considered (from 8 viewing
positions). We also performed 3D reconstruction
RGB-SpectralImaging 2016 - Special Session on RBG and Spectral Imaging for Civil/Survey Engineering, Cultural, Environmental,
Industrial Applications
692
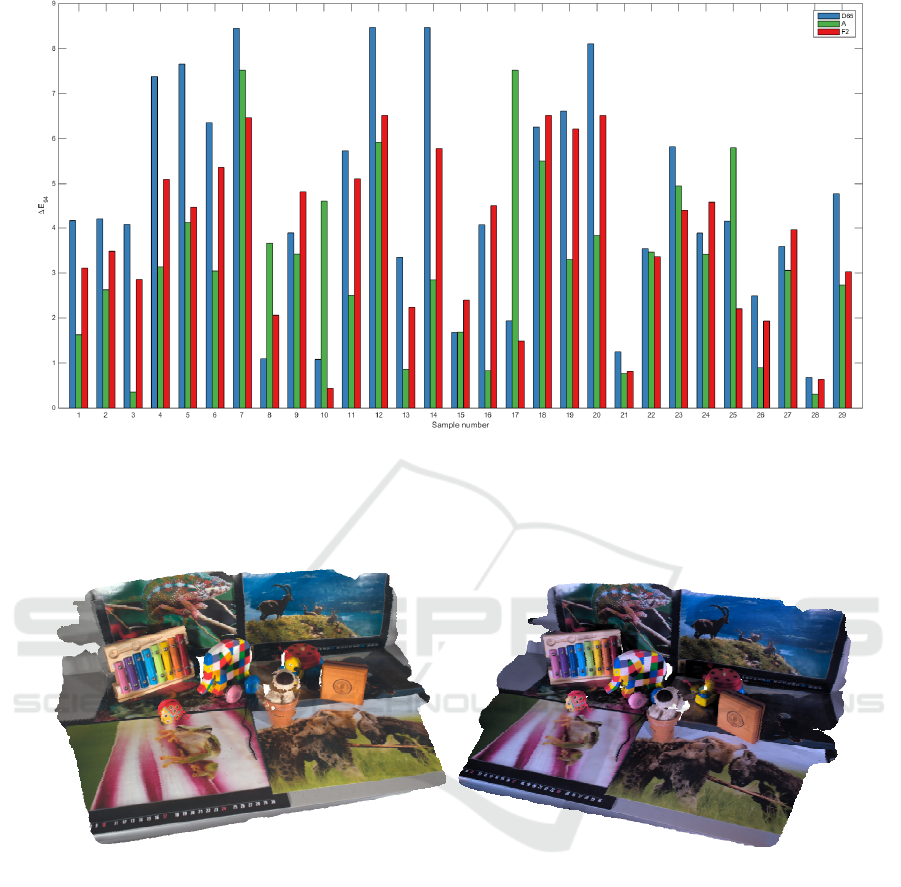
Figure 5: Computation errors between measured values (ground thruth values measured by the spectroradiometer) and
estimated values. Depending of the object/surface properties (e.g. specular reflectance) and of the SPD of the light sources
used, some ΔE94 values are quite low (e.g. the red sample below the ladybird at lelf, sample 21 or the brown nose of the
dog, sample 28) meanwhile for other objects/surfaces (e.g. the yellow sample below the head of the ladybird at right,
sample 2 or the blue sample of the elephant, sample 9) these values are higher.
(a) (b)
Figure 6: Examples of 3D reconstruction of the scene considered viewed under illuimant D65 (a), or under illuminant F2
(b). White areas (i.e. holes) are due to occlusions between 3D objects and the background.
from the 30-bands camera sensor setup considered.
In both cases results were satisfying.
We also performed 2D image reconstruction
from the two setups considered (see Table 1 and
Figure 7) in order to compare the accuracy of the
two multi-spectral systems considered with the other
multi-spectral systems used by other research
laboratories having performed measurements for the
COSCH WG1 on the “Round Robin Test”. The
results of these comparisons is under process. In
both cases the acquisitions taken for the different
spectral bands have been automatically aligned
following the method described in (Bianco &
Cusano, 2011).
4 CONCLUSION
In this paper we introduced some key questions
concerning the acquisition of accurate color images
in cultural heritage applications inside the COSCH
project. We summarized the main criteria defined by
COSCH and used by the authors to help cultural
heritage users to have a deepen knowledge and
understanding of the constraints, preconditions and
RGB-D-λ: 3D Multispectral Acquisition with Stereo RGB Cameras
693
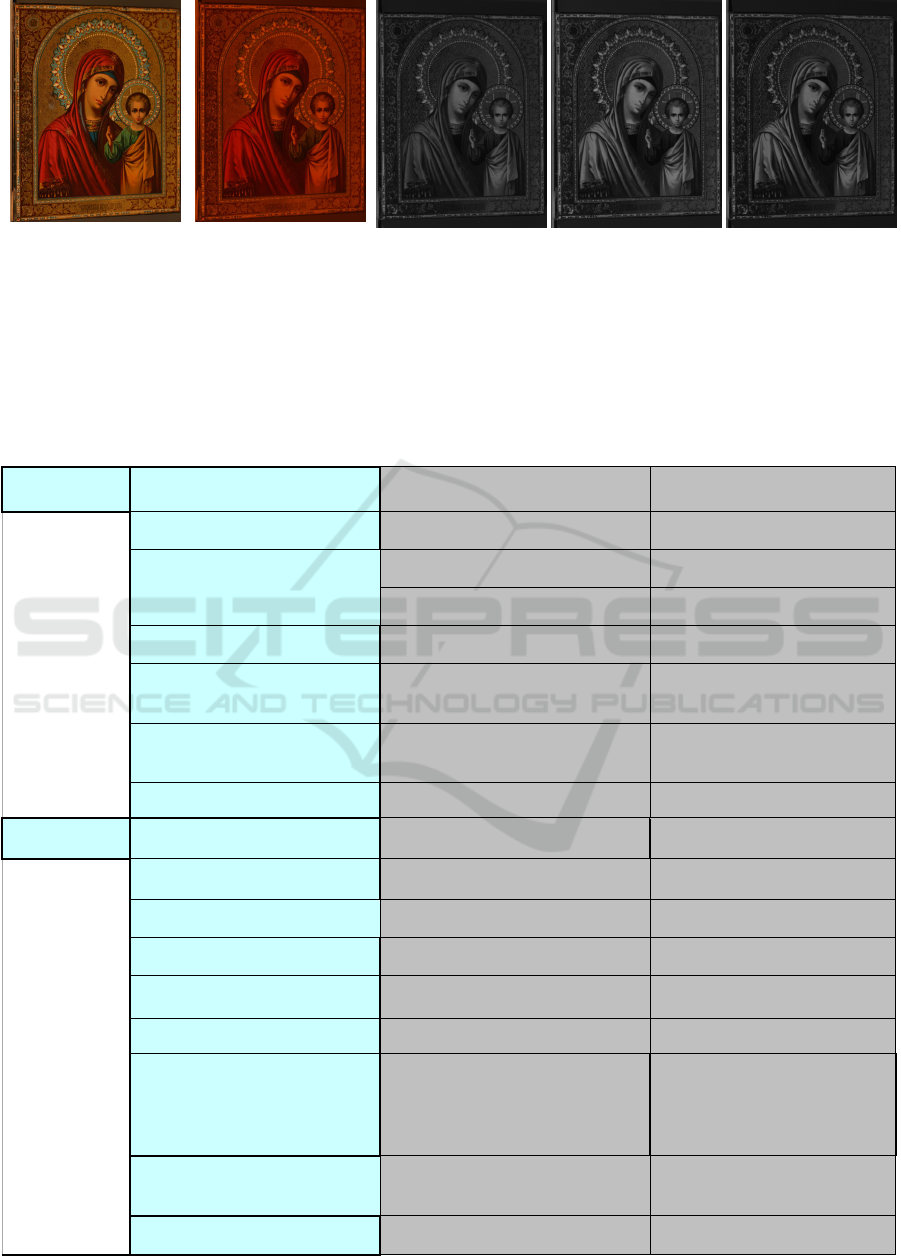
(a) (b) (c) (d) (e)
Figure 7: Example of a 2D scene (COSCH robin test ICON) digitized by : (a) a RGB CANON camera, (b) another RGB
CANON camera sensor with a red filter (large band filter) put in front of the camera, (c) to (e) a monochrome camera with
respectively a 400 nm, 450 nm and 500 nm filter (bandwith 10 nm) put in front of the camera. During our experiments we
used: 30 optical filters (from 400 nm to 70 nm) of 10 nm bandwith and 3 optical filters of 100 nm bandwith to compare
spectral distribution recovery form either a multispectral system based on 30 narrow-band filters or a multispectral system
based on 6 wide-band filters.
Table 1: Report form defined by COSCH. Here we reported technical data related to measurement performed on the ICON
shown in Figure 7.
Spectral imaging
device details
Spectral region Vis [400-700nm] Vis [400-700nm]
No. of bands Vis 31 Vis 5
Make and mode
The Imaging Source DMK41AU02. AS
monochrome camera
Canon 1000D
31 narrowband optical filters
coupled with a yellow wideband
filter for the second shot
Detector type CCD CMOS
Details of any optics used in the
acquisition (other than those part of
the camera)
Nikon AF Nikkor 24mm f/2.8 lens with
C-mount adapter
Canon EF-S 60mm f/2.8 Macro
lens
Capture settings (Exposure time,
averaging etc.)
Different for each filter. from 5s to 1/5
1/160s for the first shot (unfiltered),
1/60s for the second one (filtered)
Actual Spectral resolution Spectral Resol: ~ 10 nm FWHM N.A.
Details of
illuminant
Type 2x ~3200K 500-Watt 2x ~3200K 500-Watt
Details of illuminant spectrum grey body radiator grey body radiator
Position of the analyzed target
(vertical/horizontal)
45° on a stand 45° on a stand
Working distance btw target and the
system
100 cm btw target and lens 130 cm btw target and lens
Angle btw targets and lights approx 2x45°/0 approx 2x45°/0
Reconstruction matrix (Y/N) N Y
Calibration workflow (Capture to
Reflectance)
Standard linear reflectance calibration
on 99% reflectance spectralon plus
non-uniformity correction with neutral
gray card
Standard linear reflectance
calibration on 99% reflectance
spectralon plus non-uniformity
correction with neutral gray card
Description of related algorithms
reconstruction matrix computed
using the acquisition of the MCC
provided
Noise reduction methods none
2 reference image averages for the
second shot
RGB-SpectralImaging 2016 - Special Session on RBG and Spectral Imaging for Civil/Survey Engineering, Cultural, Environmental,
Industrial Applications
694

Figure 8: Main steps of the spectral reconstruction method by Bianco (Bianco, 2010).
practical aspects related to the selection and the use
of a multi-spectral acquisition system.
We also reported how color data can be estimated
from spectral data and discuss several issues related
to the measurement of reflective surfaces by 2D
imaging systems.
As future work we plan to extend the spectral
reconstruction to uncontrolled light setups, where a
light estimation and correction step is needed to
render the scene as taken under a canonical light
(Bianco, Bruna et al., 2012, Bianco, Bruna et al.,
2013, Bianco & Schettini, 2014). We will also
investigate the use of more complex metrics to
compare the acquisition taken with different devices:
instead of using single-valued metrics, we will
investigate the use of metrics able to output an error
map combining both colorimetric and structural
errors (Bianco, Ciocca et al., 2009). Often
multispectral systems are calibrated using the Gretag
MacBeth chart, which colors and substrate are not
representative of those found in art. Sometimes even
the use of an external chart is too invasive. Thus, we
will investigate the use of techniques to design ad-
hoc charts (Bianco & Schettini, 2012), even taking
the optimal samples from the artifact itself. We also
plan to investigate spatio-temporal effects, such as
those reported in the ITN-DCH project (Makantasis,
2013, Kyriakaki, 2014, Doulamis, 2015) under
uncontrolled light conditions.
REFERENCES
Bianco S., Gasparini F., Schettini R., Vanneschi L., 2008.
Polynomial modeling and optimization for
colorimetric characterization of scanners. Journal of
Electronic Imaging, Vol. 17, No. 4, pp. 043002-
043002.
Bianco S., Schettini R., Vanneschi L., 2009. Empirical
modeling for colorimetric characterization of digital
cameras. IEEE International Conference on Image
Processing (ICIP).
Bianco S., Ciocca G., Marini F., Schettini R., 2009. Image
quality assessment by preprocessing and full reference
model combination. In Proc of IS&T/SPIE Electronic
Imaging. International Society for Optics and
Photonics, pp. 72420O-72420O.
Bianco S., 2010. Reflectance spectra recovery from
tristimulus values by adaptive estimation with
metameric shape correction, J. Opt. Soc. Am. A/Vol.
27, No. 8/August, pp 1868-1877.
Bianco S., Cusano C., 2011. Color target localization
under varying illumination conditions. Proc of
Computational Color Imaging workshop, pp. 245-255.
Bianco S., Bruna A., Naccari F., Schettini R., 2011.
Towards the design of low cost colorimetric imaging
device. IEEE International Conference on Consumer
Electronics-Berlin (ICCE-Berlin), pp. 229-233.
Bianco S., Colombo A., Gasparini F., Schettini R., Zuffi
S., 2011. Applications of spectral imaging and
reproduction to cultural heritage. Digital Imaging for
Cultural Heritage Preservation, pp. 183-209.
Bianco S., Schettini R., 2011. Computational color
constancy. 3rd European Workshop on Visual
Information Processing (EUVIP), pp. 1-7.
Bianco S., Schettini R., 2012. Sampling optimization for
printer characterization by direct search. IEEE
Transactions on Image Processing, Vol. 21, No. 12,
pp. 4868-4873.
Bianco S., Bruna A., Naccari F., Schettini R., 2012. Color
space transformations for digital photography
exploiting information about the illuminant estimation
process. Journal of the Optical Society of America A,
Vol. 29, No. 3, pp. 374-384.
Bianco S., Bruna A., Naccari F., Schettini R., 2013. Color
correction pipeline optimization for digital cameras.
Journal of Electronic Imaging, Vol. 22, No. 2, pp.
023014-023014.
Bianco S., Schettini R., 2014. Error-Tolerant Color
Rendering for Digital Cameras. Journal of
RGB-D-λ: 3D Multispectral Acquisition with Stereo RGB Cameras
695

Mathematical Imaging and Vision, Vol. 50, No. 3, pp.
235-245.
Bianco S., Cusano C., Schettini R., 2015. Color Constancy
Using CNNs, IEEE Conference on Computer Vision
and Pattern Recognition Workshops (CVPRW).
Boochs F., Trémeau A., Karmacharya A., Reich T., Heinz
G., Kato Z. and Tamas L., 2015. Towards a
Knowledge Model to Document and Select
Algorithms and Processes in Cultural Heritage,
Proceedings of Taima, Hammamet, 11-16 june, pp
201-209.
De Lasarte Rigueiro Marta, 2009. Thorough
characterization and analysis of a multispectral
imaging system developed for colour measurement,
PhD Thesis of the Universitat Polytècnica de
Catalunya.
Doulamis, Anastasios, et al. 2015. Selective 4D modelling
framework for spatial-temporal land information
management system", Third International Conference
on Remote Sensing and Geoinformation of the
Environment. International Society for Optics and
Photonics.
Dupont D., 2002. Study of the reconstruction of
reflectance curves based on tristimulus values:
comparison of methods of optimization, Color Res.
Appl. 27, 88–99.
Faridul H. S., Pouli T., Chamaret C., Stauder J., Kuzovkin
D., Trémeau A. and Reinhard E., 2015. Color
Mapping: A Review of Recent Methods, Extensions,
and Applications”, Computer Graphics Forum, to be
published.
Hernàndez-Andrés Javier and Romero Javier, 2001.
Colorimetric and spectroradiometric characteristics of
narrow-field-ofview clear skylight in Granada, Spain,
Journal of Optical Society of America A, 18(2), 412–
420.
Imai F. H., 2010. Spectral reproduction from scene to
hardcopy: Part I – Multi-spectral acquisition and
spectral estimation using a Trichromatic Digital
Camera System associated with absorption filters,
Report of Munsell Color Science Laboratory,
Rochester Institute of Technology, published in
http://www.cis.rit.edu/research/mcsl2/research/reports.
php#DupontReports (last access 21/07/2015).
Kim Bog G., Han Jeong-won, and Park Soo-been, 2012.
Spectral reflectivity recovery from the tristimulus
values using a hybrid method, J. Opt. Soc. Am. A / Vol.
29, No. 12 / December, pp 2612-2621.
Kyriakaki, Georgia, et al. 2014. 4D Reconstruction of
Tangible Cultural Heritage Objects from Web-
Retrieved Images, International Journal of Heritage in
the Digital Era 3.2: 431-452.
Lahanier C., Schmitt F., 2003. Le Bœuf P. and Aitken G.,
Multi-spectral Digitisation and 3D Modelling of
Paintings and Objects for Image Content Recognition,
Image Classification and Multimedia Diffusion. An
Ontology Access to the C2RMF Database and Library
using the CIDOC-CRM, Intl. Conf. of Museum
Digitization, Antiquities, Painting and Calligraphy,
November 17-18, Taipei, Taiwan.
Liang H., Saunders D., Cupitt J., and Lahanier C., 2004.
Multispectral Imaging for Easel and Wall Paintings,
PART 6: “Examination and Documentation
Techniques” of the book Conservation of Ancient
Sites on the Silk Road, Proceedings of the Second
International Conference on the Conservation of
Grotto Sites, Mogao Grottoes, Dunhuang, People's
Republic of China, June 28–July 3, pp 267-274.
López-Álvarez Miguel A., Hernández-Andrés J., Romero
J., Campos J. and Pons A., 2009. Calibrating the
Elements of a Multispectral Imaging System, Journal
of Imaging Science and Technology, May-Jun., pp
031102-1- 031102-10.
López-Álvarez M.A., Hernández-Andrés J., Valero E.M.
and Nieves J.L., 2005. Colorimetric and Spectral
Combined Metric for the Optimization of
Multispectral Systems, Proc of the 10th Congress of
the International Colour Association, pp 1685- 1688.
Makantasis, K., Doulamis A., and Doulamis N. 2013. A
non-parametric unsupervised approach for content
based image retrieval and clustering, Proceedings of
the 4th ACM/IEEE international workshop on Analysis
and retrieval of tracked events and motion in imagery
stream. ACM.
Peyvandi S. and Amirshahi S. H., 2011. Generalized
spectral decomposition: a theory and practice to
spectral reconstruction, J. Opt. Soc. Am. A, Vol. 28,
No. 8 / August, pp 1545-1553.
Ribés A., Schmitt F., Pillay R. and Lahanier C. 2005.
Calibration and Spectral Reconstruction for
CRISATEL: An Art Painting Multispectral
Acquisition System. Journal of Imaging Science and
Technology, 49, pp. 563–573.
Saunders, D., Cupitt, J., 1993. Image processing at the
National Gallery: The VASARI Project, National
Gallery technical bulletin, 14:72.
Viggiano J. A. S., 2002. A perception-referenced method
for comparison of radiance ratio spectra and its
application as an index of metamerism, Proc. of the
9th Congress of the International Colour Association,
NY, pp. 701-704.
Zuffi S., Santini S., and Schettini R., 2008. From Color
Sensor Space to Feasible Reflectance Spectra, IEEE
Transactions on Signal Processing, Vol. 56, No. 2, pp
518-531
RGB-SpectralImaging 2016 - Special Session on RBG and Spectral Imaging for Civil/Survey Engineering, Cultural, Environmental,
Industrial Applications
696
