
Semantic Social Network Analysis Foresees Message Flows
Matteo Cristani, Claudio Tomazzoli and Francesco Olivieri
Dipartimento di Informatica, University of Verona, Strada le Grazie 15, Verona, Italy
Keywords:
Social Network Analysis, Information Flow, Semantics of Data Flow.
Abstract:
Social Network Analysis is employed widely as a means to compute the probability that a given message
flows through a social network. This approach is mainly grounded upon the correct usage of three basic
graph- theoretic measures: degree centrality, closeness centrality and betweeness centrality. We show that, in
general, those indices are not adapt to foresee the flow of a given message, that depends upon indices based
on the sharing of interests and the trust about depth in knowledge of a topic. We provide an extended model,
that is a simplified version of a more general model already documented in the literature, the Semantic Social
Network Analysis, and show that by means of this model it is possible to exceed the drawbacks of general
indices discussed above.
1 INTRODUCTION
Social Networks are considered, on the current
panorama of web applications, as the principal vir-
tual space for online communication. Therefore, it is
of strong relevance for practical applications to un-
derstand how strong a member of the network is with
respect to the others.
Traditionally, sociological investigations have
dealt with problems of defining properties of the users
that can value their relevance (sometimes their impor-
tance, that can be considered different, the first denot-
ing the ability to emerge, and the second the relevance
perceived by the others). Scholars have developed
several measures and studied how to compute them
in different types of graphs, used as models for so-
cial networks. This field of research has been named
Social Network Analysis. Sometimes the same name
is attributed to a wider context, where we also mean
to include analysis of the ways in which such values
arise (for instance, processes able to change impor-
tance of members), or to provide methods for employ-
ing these measures in applications.
Majorly, scholars dealt with the Social Network
Analysis from the viewpoint of information flow,
namely they provide models of importance (and other
aspects as well) to understand how probable would
be that a piece of information passed through a given
node. Mainly, the information flow has been stud-
ied for propagation of viruses (both in medical and
in computer security contexts), news spread-out (and
hence, studies about viral marketing as well), and
message passing in certain application contexts.
Three basic measures have been developed that
belong to the family of centrality measures: degree
centrality, closeness centrality and betweeness cen-
trality. In this paper we criticize the models of so-
cial network analysis developed for these measures,
showing that there are cases in which these measures
are not adapt. The criticism arises mainly as related
to the absence of semantic aspects in measures. To
show what we mean with these limits, let us introduce
a general example.
Example 1. Consider two users of facebook, Alice
and Bob, and assume that the measures of importance
is settled to coincide with the number of friends, the
distance to non-friends, and the probability of being
in common between two non-friends. Alice results to
be much more important in the network than Bob, un-
der all the three measures. However, to a closer ob-
servation we notice that this result is definitely true for
certain topics whilst it results false for other ones. In
particular, Alice is much more expert than Bob about
Geography and History, equivalent with respect to
Sport and weaker for Cuisine. When someone passes
a message to Alice and the message regards Geogra-
phy, she is much more likely to pass the message than
Bob. Conversely, when a message regards Sport the
opposite case holds. Cuisine information flow is bet-
ter when passes through Bob.
The above described example shows that it can be the
case that two members of a social network can ex-
hibit different orders of prevalence in terms of central-
ity depending on the topic we refer the prevalence to.
296
Cristani, M., Tomazzoli, C. and Olivieri, F.
Semantic Social Network Analysis Foresees Message Flows.
DOI: 10.5220/0005832902960303
In Proceedings of the 8th International Conference on Agents and Artificial Intelligence (ICAART 2016) - Volume 1, pages 296-303
ISBN: 978-989-758-172-4
Copyright
c
2016 by SCITEPRESS – Science and Technology Publications, Lda. All rights reserved

This may produce effects that cannot be reproduced
by a single index, as shown in the example below.
Example 2. Consider five individuals: Alice, Bob,
John, Annie and Charlie.Alice is connected to Bob
and John; John connects also to Bob and Charlie and
also Annie is connected to Bob and Charlie, while
Bob is connected directly to everyone and is person
who loathes gossips when the others like or accept it.
If we don’t consider topics we would say that
dropping a gossip in the network, the right person to
deliver it to have it spread is of course Bob.
Unfortunately, the message has contents of a topic
which probably will see Bob cancel it, instead of for-
warding it, while both John and Charlie are good
choices because they are directly connected to three
people each and they have a different attitude toward
gossip than Bob.
The purpose of this paper is to give account to the
aspects showed in the example above. We provide a
model of Social Network Analysis that takes into ac-
count topics, and show that it can foresee information
flow for message treating those topics in a more accu-
rate way than classical topic-free social network anal-
ysis. We also name Semantic Social Network Anal-
ysis the techniques we studied in this investigation to
cover a part of research that some previous studies did
not cover satisfacorily.
The rest of the paper is organised as follows: in
Section 2 we provide the actual technical part of the
paper. Further we employ Section 3 to discuss related
work. Finally Section 4 takes some conclusions and
sketches further work.
2 SEMANTIC SOCIAL
NETWORK ANALYSIS
In this section we introduce two distinct themes of
graph theory: Social Network Analysis and Informa-
tion Flow. The basis of both is the very general notion
of a labelled graph, that we assume to be known to the
reader, and specify in terms of form of the labels in
Subsection 2.1. Social Network Analysis is extended
in semantic terms in Subsection 2.2 and analysed in
computational details in Subsection 2.3. The ability
of the introduced modified measures to foresee Infor-
mation Flow is discussed in Subsection 2.4.
2.1 Graph Theory Preliminaries and
Social Network Analysis
A graph is a pair G = hV , E i, where V is a finite
set of vertices, and E is a set of edges. A graph G is
labelled when to each vertex or to each edge is associ-
ated a label, determined by Λ, a function that associ-
ated vertices and edges to the label sets (that are thus
denoted by ∆(V ) and ∆(E), or simply by ∆, meant to
be the union of the above). We use the term node and
the term vertex indifferenty.
In this paper we concentrate ourselves onto in-
directed graphs, and delay the investigation on di-
rected graphs to further work. We also assume that the
graphs we deal with have no circular edge (although
we do not assume them to be acyclic).
We name incident edges of a node v, the set of
nodes that are on one extreme of an edge that has v
as opposite extreme. We use the term path between
two vertices v and w, to denote a sequence of nodes
p = {v = v
1
, v
2
, ..., v
n
= w} that connects v to w, so
that every pair (v
i
, v
i+1
) is an edge of the graph. We
call length of p the number n. We say that a vertex v
is between two nodes v
1
and v
2
when v belongs to the
shortest path from v
1
to v
2
.
The number n of vertices in a graph is named the size
of the graph. Given a graph G of size n, if e is the
number of edges in G, then the ratio δ =
e
n
2
is named
the density of G. When a graph G
1
is denser than
another graph G
2
, we also say that G
2
is sparser than
G
1
.
To treat the notion of distance we employ no-
tions derived from classic algorithmic graph theory,
as widely discussed in (Eppstein, 1999). The distance
between two vertices v
1
and v
2
, denoted by δ(v
1
, v
2
),
in a graph, is the length of the shortest path connect-
ing v
1
and v
2
.
We now introduce three basic measures of social
network analysis, and discuss several flaws they ex-
hibit.
Definition 1. A node v of a graph is said to have ab-
solute degree centrality k when the number of edges
incident to v is k.
From absolute degree centrality we can easily derive
relative degree centrality, as the absolute degree cen-
trality weighted by the size of the graph. In other
terms, if a graph has n vertices, and a node v has abso-
lute degree centrality k, the relative degree centrality
of v is
k
n
.
The absolute degree centrality clearly depends on
the size of the graph. In a graphs with n vertices abso-
lute degree centrality can vary from 0 to n − 1, and
therefore if a graph is larger than another, vertices
may have greater degree centrality.
Relative degree centrality does not suffer of this
flaw. On the other hand, if you consider two graphs
of the same size, where one is denser than the other, in
the denser one the relative degree centrality varies less
than in the sparser one. A way to reduce this effect is
Semantic Social Network Analysis Foresees Message Flows
297
to consider a third variant of the degree centrality: the
graded degree centrality. This variant considers the
relative degree of each vertex and compares it to the
corresponding values of the other vertices. A vertex
v has a graded degree centrality δ =
k
n
where n is the
size of the graph and k is the number of vertices in the
graph with a relative degree centrality less than the
relative degree centrality of v.
We now introduce the second measure of social
network analysis.
Definition 2. A node v of a graph is said to have far-
ness f such that:
f (v
i
) =
N
∑
k=1,k6=i
δ(v
i
, v
k
)
The closeness centrality of a vertex is the reciproce of
the farness of v:
c(v) =
1
f (v)
Closeness centrality only works for connected graphs.
Conceptually, however, two vertices that are not con-
nected ar as far as infinite, thus being closeness cen-
trality of these equivalent to 0. This is clearly faulty.
There have been several proposals to solve this aspect,
mainly by means of techniques that are based upon
weights. For the purpose of this research we assume
that networks are connected.
For comparison purposes closeness centrality suf-
fers of the same flaws of degree centrality. Larger
graphs have potentially longer paths, and thus longer
distances, consequenly closeness centrality can vary
significantly. In particular, since the distance between
two vertices in our graphs is at least one (we exclude
networks with self-cycles), and at most is the length of
the longest possible connection path that is as long as
the size (specifically n − 1), the farness of a vertex is
obtained as the sum of the lenghts n − 1 for each other
vertex connected to it, that sums to (n − 1) · (n − 1).
Therefore, the closeness varies from a minimum of
1
n
2
to a maximum of
1
n
. To normalize this and make
it indipendent from the size we cannot use fractions,
as we did for degree centrality. A possible approach
is to employ a logarithmic measure, and then normal-
ize it by n. In other terms we can measure farness as
the sum of the logarithmic measure of shortest paths,
weighted by the size of the graph itself. Formally
f (v
i
) = n ·log(
N
∑
k=1,k6=i
δ(v
i
, v
k
))
The above introduced measure does not suffer of de-
pendence on either size or density of the graph, and its
reciproce varies from 0 to 1. More precisely, it varies
from
1
2
and 1, evidently. We can obtain a normalised
measure by using
cc
n
(v
i
) = ()
1
f (v
i
) −
1
2
) · 2
The third measure we consider here is betweeness
centrality. It is obtained as the number of pairs of ver-
tices that are traversed by a path containing the mea-
sured vertex, or such that the vertex is between the
elements of the pair.
Definition 3. The betweeness centrality of a vertex v
is the number K of pairs in the graph for which v is
between.
Analogously to the previous analysis about degree
centrality we can note that large networks may exhibit
wider spectrum of betweeness centrality than smaller
ones, and conversely, less wide
2.2 Semantic Social Network Analysis
Social network Analysis starts from unlabelled and
for the settings of this investigation indirected graphs
1.
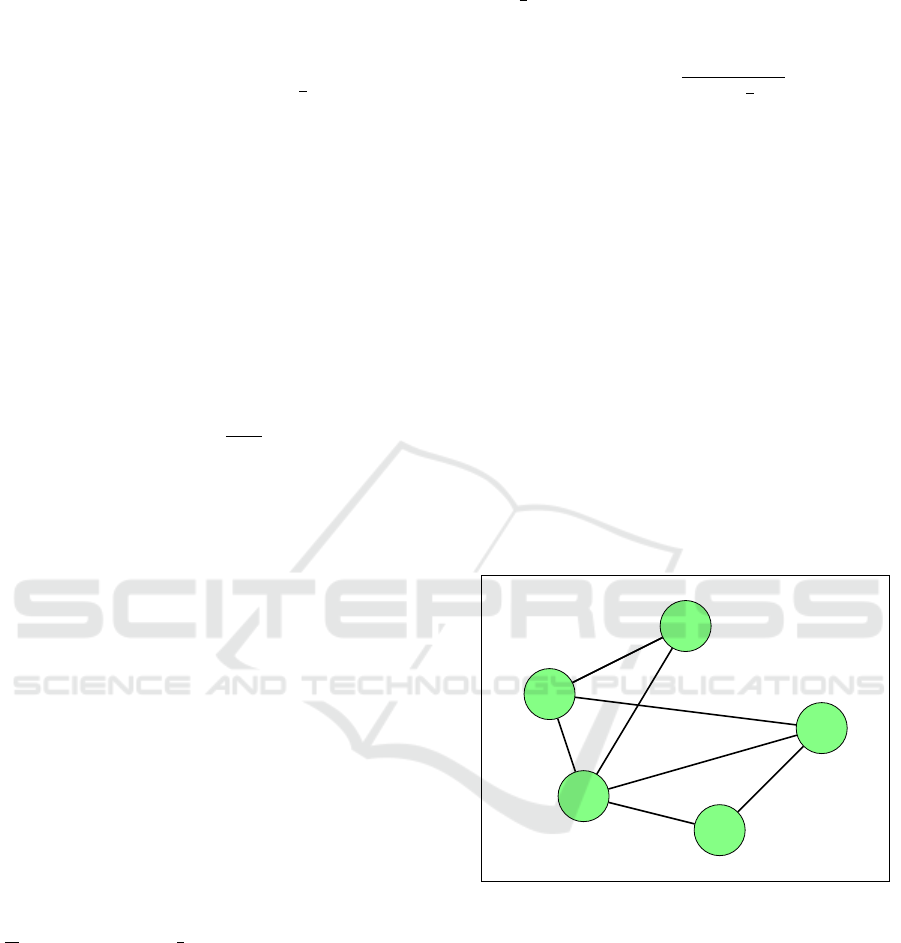
John
Alice
Bob
Annie
Charlie
Figure 1: Representing a social network by an unlabelled
indirected graph.
This, as discussed in Section 1 is unrealistic. An
individual can be connected to another over a cer-
tain topic, but definitively disconnected over another
topic. Moreover, the link between individuals can be
indipendent from the shared topics. This concepts are
known as homophily and have been discussed in Sec-
tion 3.
If we measure centralities by means of unlabelled
graphs, we may be rather misleading in defining the
relevance (or importance, in some sense) of a vertex
in the graph, since an individual can exhibit strong
connections on one specific topic and weak ones
on other topics, providing therefore a differentiated
ICAART 2016 - 8th International Conference on Agents and Artificial Intelligence
298
degree centrality, in particular, and analogously for
closeness and betweeness measures.
Consider two individuals John and Alice belong-
ing to the same school but not sharing a hobby like
music. A message regarding a class has a good prob-
ability of being forwarded from John to Alice while
one regarding the hobby hasn’t.
So we can say that John and Alice are connected
over a topic school but are disconnected over topic
music.
A method to provide this is to add a label to
vertices in the graph with label corresponding to a
measure of depths relative to a set of topics T =
{t
1
, . . . ,t
k
}. The label will be vector D = {d
1
t
1
, . . . d
n
t
k
}
whose component d
i
t
j
is the depth over the topic t
j
of
the individual represented by vertex i as can be seen
in Figure 2.
N
1
N
2
N
3
N
4
N
5
d
1
t
1
, d
1
t
2
, d
1
t
3
, d
1
t
4
, d
1
t
5
d
2
t
1
, d
2
t
2
, d
2
t
3
, d
2
t
4
, d
2
t
5
d
3
t
1
, d
3
t
2
, d
3
t
3
, d
3
t
4
, d
3
t
5
d
4
t
1
, d
4
t
2
, d
4
t
3
, d
4
t
4
, d
4
t
5
d
5
t
1
, d
5
t
2
, d
5
t
3
, d
5
t
4
, d
5
t
5
Figure 2: Introducing labels for depth in topics.
The goal of centrality measures is to provide a tool
for foreseeing information flow. The basic assump-
tion we make here is that when someone is not in-
volved in a specific topic, it is rather unlikely that she
promotes the flow of a piece of information through
the vertex she occupies.
Considering the aforementioned two individuals
John and Alice, their interests in the set of topics
T = {gossip, music, sport, cooking, politics} can be
expressed as D
a
= (0.3, 0.5, 0.5, 0.0, 0.0) for Alice
and D
j
= (0.9, 0.7, 0.0, 0.5, 0.0) for John, meaning
that while both are interested in gossip and music and
not interested in politics, Alice is keen to sport and
John is not but he likes cooking while Alice does not,
as is expressed in Figure 3.
An individual has depth on a certain topic mea-
suring the degree of involvement on it; an individ-
ual has also an activation threshold which describes
the inverse of the likelihood of that individual of be-
coming active when “hit” by a message. The notion
introduced here is inspired by that used in scientific
John
Alice
Bob
Annie
Charlie
(0.9, 0.7, 0.0, 0.5, 0.0)
(0.3, 0.5, 0.5, 0.0, 0.0)
(0.5, 0.7, 0.9, 0.3, 0.0)
(0.3, 0.0, 0.7, 0.0, 0.0)
(0.9, 0.5, 0.7, 0.3, 0.0)
Figure 3: An Example of a social network with labels on
topics gossip, music, sport, cooking, politics.
evalutation as proposed in (Tonta and Darvish, 2010).
N
1
N
2
N
3
N
4
N
5
a
1
t
1
, a
1
t
2
, a
1
t
3
, a
1
t
4
, a
1
t
5
d
1
t
1
, d
1
t
2
, d
1
t
3
, d
1
t
4
, d
1
t
5
a
2
t
1
, a
2
t
2
, a
2
t
3
, a
2
t
4
, a
2
t
5
d
2
t
1
, d
2
t
2
, d
2
t
3
, d
2
t
4
, d
2
t
5
a
3
t
1
, a
3
t
2
, a
3
t
3
, a
3
t
4
, a
3
t
5
d
3
t
1
, d
3
t
2
, d
3
t
3
, d
3
t
4
, d
3
t
5
a
4
t
1
, a
4
t
2
, a
4
t
3
, a
4
t
4
, a
4
t
5
d
4
t
1
, d
4
t
2
, d
4
t
3
, d
4
t
4
, d
4
t
5
a
5
t
1
, a
5
t
2
, a
5
t
3
, a
5
t
4
, a
5
t
5
d
5
t
1
, d
5
t
2
, d
5
t
3
, d
5
t
4
, d
5
t
5
Figure 4: Activation thresholds: a means for representing
sensitivity to information flows.
A method to express this is to add another label
to vertices in the graph with label corresponding to
a measure of activation threshold relative to a set of
topics T = {t
1
, . . . ,t
k
} as can be seen in Figure 4.
The label will be vector A = {a
1
t
1
, . . . a
n
t
k
} whose
component a
i
t
j
is the activation threshold over the
topic t
j
of the individual represented by vertex i, with
a higher threshold meaning that it is less probable to
see that individual i activated on topic t
j
.
Considering the aforementioned two individuals
John and Alice, their activation in the set of top-
ics T = {gossip, music, sport, cooking, politics} can
be expressed as A
a
= (0.6, 0.3, 0.7, 0.5, 0.8) for Alice
and A
j
= (0.3, 0.6, 0.3, 0.5, 0.9) for John meaning that
while both are equally active in music and cooking,
Alice is more reactive to gossip than John while he is
probably forwarding more messages over topic sport
than Alice and both will probably stop messages re-
Semantic Social Network Analysis Foresees Message Flows
299
garding politics, as is expressed in Figure 5.
John
Alice
Bob
Annie
Charlie
(0.3, 0.6, 0.3, 0.5, 0.9)
(0.9, 0.7, 0.0, 0.5, 0.0)
(0.6, 0.3, 0.7, 0.5, 0.8)
(0.3, 0.5, 0.5, 0.0, 0.0)
(0.9, 0.4, 0.5, 0.5, 0.6)
(0.5, 0.7, 0.9, 0.3, 0.0)
(0.3, 0.3, 0.3, 0.3, 0.8)
(0.3, 0.0, 0.7, 0.0, 0.0)
(0.3, 0.9, 0.9, 0.9, 0.9)
(0.9, 0.5, 0.7, 0.3, 0.0)
Figure 5: An example of a social network with topic depths
and activation thresholds on topics gossip, music, sport,
cooking, politics.
2.3 Computational Analysis of
Semantic Social Network Analysis
Computation of degree centrality is straightforwardly
obtained from the basic algorithm for Social Net-
works, that simply counts the number of incident
edges of each vertex, and then derives the consequent
computations for relative and graded variants. In Se-
mantic Social Network Analysis, we sum the weights,
instead of counting the incident edges.
The base for computing both closeness and be-
tweeness centrality is the labelling of edges by the
graph distance, meant as shortest path. We extend
here the method known as Floyd Warshall Algorithm.
In indirected unlabelled graphs, the algorithm com-
putes just the incident edges to obtain the correct
value of distances. We use the vectorial min() func-
tion both to initialize the distance matrix and to give
a the value of the distance between two vertices in the
core of the algorithm.
The distance of two vertices v
i
, v
j
with corre-
sponding labels λ
i
, λ
j
will be δ[i, j] = min(λ
i
, λ
j
).
The sum in Floyd Warshall will be substituted
with the min()in our vectorial case.
As the minimum function is compliant with the tri-
angle inequality the algorithm still holds.
It is easy to show that the method is polynomial and
that the resulting labels provide an Euclidean distance
between vertices in the graph.
Theorem 1. FWSSNA terminates labelling of the
input graph in O(n
3
) where n is the size of the graph.
Algorithm 1: ALGORITHM FWSSNA. Given a graph G
with vertices V , returns matrix of distances.
1: Input: a graph G of vertices V = v
1
, . . . , v
n
with
corresponding labes Λ = λ
1
, . . . , λ
n
;
2: Output: a matrix of distances ∆;
3: i ← 1, j ← 1;
4: ∆ ←
/
0;
5: for i < |V | do
6: for j < |V | do
7: δ[i, j] ← min(λ
i
, λ
j
);
8: end for
9: end for
10: i ← 1, j ← 1, k ← 1;
11: for k < |V | do
12: for j < |V | do
13: for i < |V | do
14: δ[i, j] ← min(δ[i, j], min(δ[i, k], δ[k, j]));
15: end for
16: end for
17: end for
Theorem 2. FWSSNA returns a labelling that is a
Euclidean distance between vertices.
As a consequence, we can employ FWSSNA to pro-
vide semantic closeness centrality, and semantic be-
tweeness centrality.
Closeness centrality is obtained by simply la-
belling vertices in the graph with the minimum of the
computed distance from the node to the other nodes.
Minimum is well known to respect Euclidean distance
properties as well. Once we have executed the algo-
rithm FWSSNA, every other node is connected to a
given node, and thus we can consider the closeness
computation as a second step. We say, in particular
that an algorithm A
1
is in overhead computational cost
C with respect to another algorithm A
2
, when the cost
of executing A
1
is C, after A
2
has been executed as a
preliminary step wrt A
1
.
Theorem 3. Computing semantic closeness central-
ity is in overhead O(n) wrt FWSSNA.
Betweeness centrality can be obtained by modifying
the method of FWSSNA with the introduction of a la-
bel reporting the shortest path, or better, the internal
nodes of the path. If the shortest path connecting two
vertices x and y is the sequence x = x
1
, x
2
, ..., x
n
= y,
then the computed set of internal nodes is formed by
{x
2
, x
3
, ..., x
n−1
}. To obtain, therefore, the correct be-
tweeness it is sufficient to compute those labels (that
is with no overhead wrt to FWSSNA) and then, for a
vertex v determine the number of shortest paths that
pass through v by counting the number of appearances
of v in the labels of the vertices. This can obviously
ICAART 2016 - 8th International Conference on Agents and Artificial Intelligence
300

be done in a number of steps that is equivalent to the
number of edges, giving the result below.
Theorem 4. Computing semantic betweeness cen-
trality is in overhead O(n
2
) wrt FWSSNA.
2.4 Forecasting the Information Flow
with Semantic Social Network
Analysis
A message injected in a social network, i.e. sent to
a person, has a higher probability of being forwarded
if the person has a low activation threshold and if the
content of the messages catches the attention of the
person, or in other word if the information content
of the message is higher or equal to the depth of the
person on the topic.
In particular we assume that every information
piece, that we name a message passing through the
network, is associated with depth measures for the
same topic vector employed to label the vertices of
the network itself.
Therefore, we can say that the probability of a
message m of topics t
1
,t
2
, ...,t
k
to be forwarded by
an individual i can be expressed as a function of
the depth on the topics, the information content over
those topics of the message and the reactivity of the
member. We denote by t
m
the vector of topic depths of
the message m, by d
i
t
the vector of topic depths of the
member i and by a
i
t
the vector of activation threshold
of the member i.
P(m, i) = Ψ(t
m
, d
i
t
, a
i
t
)
If we consider a message of the topic gossip when
this hits John or Charlie is is less likely that it will be
forwarded, as shown in Figure 6.
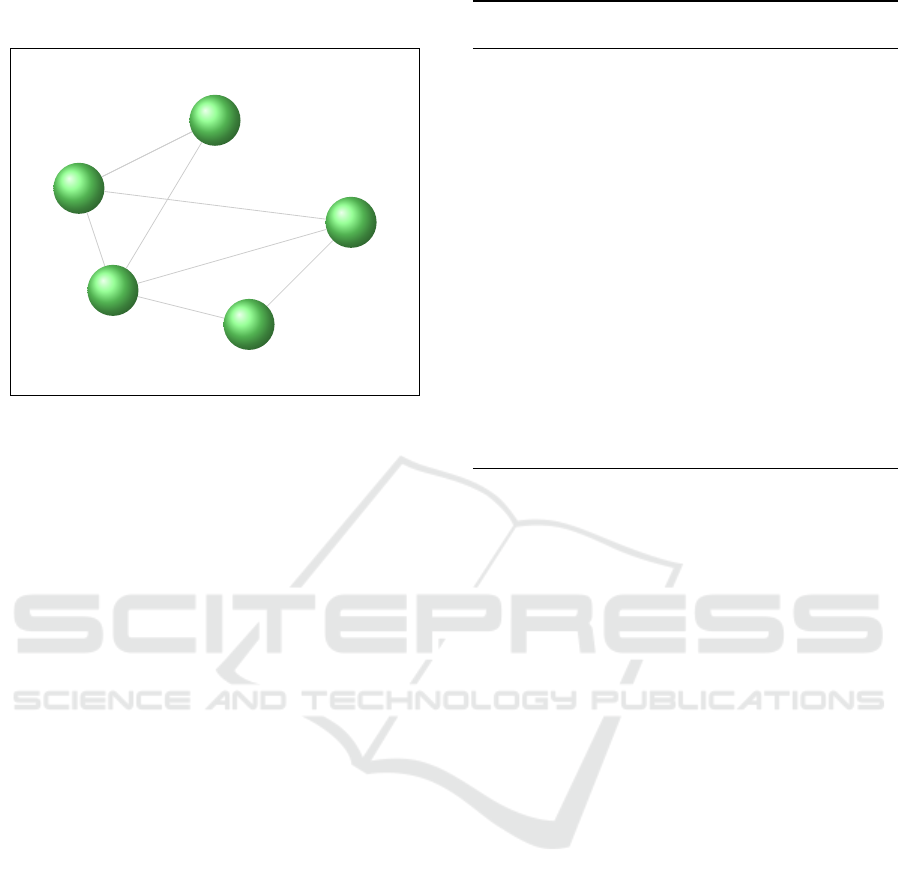
John
Alice
Bob
Annie
Charlie
Figure 6: Our representation of a social network.
To introduce the notion we need, let us recall the
idea of probablistic complement. When an event has
the probability p, the proablistic complement of p,
namely 1 − p is the probability of the opposite event.
When two events can occur, the probablity of the oc-
currence of some of them is the probablistic comple-
ment of the conjunction of the opposite events. For in-
stance, if two events have probabilities p
1
and p
2
, the
probability of the occurrence of some of them is the
probabilistic complement 1 − (1 − p
1
)(1 − p
2
), to be
read as the probability that among all cases it would
not be the case that none of the two events occur. For a
set of values between 0 and 1 we P = {p
1
, p
2
, ..., p
k
},
we denote by P
C
the probablistic complement
P
C
= 1 −
n
∏
i=1
1 − p
i
The simplest function we can promote, when as-
suming that one message only deals with a single
topic, is the direct product of the probabilistic com-
plement of the activation threshold, the depth of the
member in that topic and the depth of the message in
the topic itself. When the topics involved are more
than one, then the above is poor, and we need to work
on the probablistic complement for the depths of the
involved topics.
P(m, i) = (t
m
)
C
· (d
i
t
)
C
· (a
i
t
)
C
On a purely theoretical basis, it is clear that when two
members of a network have a good activation thresh-
old on a given topic, when a message on that topic
reaches the vertex, and the message has a high depth
in that topic, then the message has a good probability
of being passed.
The ability of the above mentioned index to fore-
see correctly the information flow is under experimen-
tal evaluation and the first preliminary results are very
encouraging.
3 RELATED WORK
The reference literature can be considered as articu-
lated in three themes:
• Studies about implicit social links that exist
among users of the internet (or of an internet ap-
plication), or about enrichment of social web;
• Investigations of the semantics of social networks;
• Research about Social Network Analysis and re-
lationships to semantic issues.
Regarding the first topic, we can look at meth-
ods for social link extraction, as discussed below, as
one of the best structured investigations on the theme.
This specific method for extracting social networks
Semantic Social Network Analysis Foresees Message Flows
301

from the web using similarity between collective con-
texts is proposed in (Alguliev et al., 2011). The au-
thors construct three social networks on the same set
of named entities. They use Jaccard, overlap and
Normalized Google Distance (NGD) (Cilibrasi and
Vit
´
anyi, 2007) coefficients to retrieve degree of close-
ness between entities. They show how actors may be
assigned different relevance degrees and that actors
having higher ranking results may be assigned lower
ranks and inversely by choosing another measure to
perform the ranking. In our perspective their work is
solid, but lacks in one important aspect, the authors
build homophily on the based of the contents.
This is a technique to build a network, and not an
analysis of the network itself, as we do in this work.
Suffering the same issue is the work of (Er
´
et
´
eo et al.,
2009), where the authors present a new framework
for applying Social Netork Analysis to RDF repre-
sentations of social data. In particular, the use of
graph models underlying RDF and SPARQL exten-
sions enables us to extract efficiently and to param-
eterize the classic Social Network Analysis features
directly from these representations.
The main criticisms to the proposed approach lie
on the fact that, as already shown in many practical
cases, it makes a lot of difference, in terms of under-
stading of the structure of similarity between nodes,
to know the relevance of the two nodes. In fact, sim-
ilarity can be used, as done, for instance in (Cruz
et al., 2014), for community detection, where mem-
bers are related to each other based on their similarity
in semantic terms. This is different in terms of rela-
tionship, with respect to measuring the relevance and
study attactivity. Clearly, being interested in Football
lies on liking it, but the community is formed around
authoritative persons, for instance journalists.
A more practical research has been documented in
(Yuan and Fei, 2010) where an application of seman-
tic social networks and attraction theory to web based
services is carried out.
The relation between trust and Social Network
Analysis has been investigate in (Zhang et al., 2006)
and specified as a means for understanding deeply the
meaning of centrality and other measures as related to
authority. The same concept is employed to provide a
framework for the general interpretation of the logic
bases of recommendation systems in (Davoodi et al.,
2013).
The studies cited above all aim at discovering net-
work links by means of mining techniques. On the
other hand, the introduction of notions derived from
semantic web into social networks is the core quest
of many recent studies, including (Zhou et al., 2011).
As a complete reference to the current literature about
meaning of social links, and relationships between so-
cial web and semantics, readers can look at (Leydes-
dorff, 2012).
More deeply, in (Mika, 2004) a direct and ex-
plicit comparison between social networks and the
semantic web is carried out. This paper proposes a
parallel between networked knowledge of members
in a network and the basic notions of semantic web.
The same issue is dealt with, with the specificity of a
known technique, the semantic networks, in (Downes,
2005). More generally, the semantic web methods
are employed for understanding the meaning of social
networks as sharing platforms for common knowl-
edge, in (Mika, 2005).
The idea of using Social Network Analysis as a
means for forecasting the probability of a message to
pass through a given member of the network itself is
not novel at all. Base of our analysis is the criticisms
to the roughness of the employed measures, criticisms
that are not novel anyhow.
This has been dealt in two distinct ways: by us-
ing semantic methods for habilitating the forecast pro-
cesses: in particular in (Zywica and Danowski, 2008),
authors use semantic networks for foreseeing the be-
haviour in facebook.
On the other hand, many criticisms are applied to
centrality measures ((Landherr et al., 2010), (Kang,
2007)). The main criticisms, that are met by the above
mentioned investigations as well as by researches
tending to correct the flaws of the general methods
for centrality measures, and the measures themselves,
lie on the weakness of the notion of similarity derived
from the notion of centrality.
The above mentioned notion of similarity as de-
rived from centrality measures, and its applications to
the notion of reciprocity, a concept that has a crucial
importance, for instance, in asymmetric social net-
works (Instagram, Twitter) are dealt with in (A. Ra-
machandra Rao, 1987). Authors show that centrality
measures as used so far are unsuccessful in forecast-
ing the information flows.
4 CONCLUSIONS
In this paper we investigated an extension to Social
Network Analysis based upon the usage of a network
model that includes the notion of topic. This leads to
a further model that incorporates the notion of sensi-
tivity, by means of a value, called activation threshold
that is meant to denote the probability of a member of
the network to be active in an information flow. Algo-
rithms for computing extended notions of centrality
are provided, and proved to be correct, complete and
ICAART 2016 - 8th International Conference on Agents and Artificial Intelligence
302

computationally efficient. We provide examples that
show that our approach can fruitfully solve few ev-
ident drawbacks of the general model, as applied to
information flow forecast.
There are at least three different ways in which
this investigation can be extended. First of all we aim
at formalising a problem of dissemination of informa-
tion pieces throughout a network. The problem can be
formulated as follows: given a social network, a num-
ber k and a probability value p, select k members in
such a way that the set of members reached by an in-
formation piece sent to the members in the selection
and dissemintated by them and the chains of mem-
bers generated therefore, has a probability of being
total (namely to cover the entire network) of at least
p.
A second study investigates ways of providing
reacher models of topics. In particular, we aim at in-
vestigating topics with sub-topics.
A third investigation will introduce the notion of
orientation. Foir instance two persons can be both
interested in football, but one may support Juventus
F.C., whilst the other one may support A.C. Chievo
Verona. These studies are taken into a track of re-
search for viral marketing purposes, including meth-
ods to evaluate networks for advertisment, alerts, and
emergencies.
REFERENCES
A. Ramachandra Rao, S. B. (1987). Measures of reciprocity
in a social network. Sankhy: The Indian Journal of
Statistics, Series A (1961-2002), 49(2):141–188.
Alguliev, R., Aliguliyev, R., and Ganjaliyev, F. (2011). In-
vestigation of the role of similarity measure and rank-
ing algorithm in mining social networks. Journal of
Information Science, 37(3):229–234.
Cilibrasi, R. and Vit
´
anyi, P. M. B. (2007). The google
similarity distance. IEEE Trans. Knowl. Data Eng.,
19(3):370–383.
Cruz, J. D., Bothorel, C., and Poulet, F. (2014). Commu-
nity detection and visualization in social networks: In-
tegrating structural and semantic information. ACM
Trans. Intell. Syst. Technol., 5(1):11:1–11:26.
Davoodi, E., Kianmehr, K., and Afsharchi, M. (2013). A se-
mantic social network-based expert recommender sys-
tem. Applied Intelligence, 39(1):1–13.
Downes, S. (2005). Semantic networks and social networks.
The Learning Organization, 12(5):411–417.
Eppstein, D. (1999). Finding the k shortest paths. SIAM J.
Comput., 28(2):652–673.
Er
´
et
´
eo, G., Gandon, F. L., Corby, O., and Buffa, M.
(2009). Semantic social network analysis. CoRR,
abs/0904.3701.
Kang, S. M. (2007). A note on measures of similarity based
on centrality. Social Networks, 29(1):137 – 142.
Landherr, A., Friedl, B., and Heidemann, J. (2010). A
critical review of centrality measures in social net-
works. Business and Information Systems Engineer-
ing, 2(6):371–385.
Leydesdorff, L. (2012). Advances in science visualiza-
tion: Social networks, semantic maps, and discursive
knowledge. CoRR, abs/1206.3746.
Mika, P. (2004). Social networks and the semantic web.
In Web Intelligence, 2004. WI 2004. Proceedings.
IEEE/WIC/ACM International Conference on, pages
285–291.
Mika, P. (2005). Flink: Semantic web technology for the
extraction and analysis of social networks. Web Se-
mantics: Science, Services and Agents on the World
Wide Web, 3(2):211 – 223. Selcted Papers from
the International Semantic Web Conference, 2004
ISWC, 20043rd. International Semantic Web Confer-
ence, 2004.
Tonta, Y. and Darvish, H. R. (2010). Diffusion of latent
semantic analysis as a research tool: A social network
analysis approach. Journal of Informetrics, 4(2):166
– 174.
Yuan, S.-T. and Fei, Y.-L. (2010). A synthesis of seman-
tic social network and attraction theory for innovating
community-based e-service. Expert Systems with Ap-
plications, 37(5):3588 – 3597.
Zhang, Y., Chen, H., and Wu, Z. (2006). A social network-
based trust model for the semantic web. In Yang,
L., Jin, H., Ma, J., and Ungerer, T., editors, Au-
tonomic and Trusted Computing, volume 4158 of
Lecture Notes in Computer Science, pages 183–192.
Springer Berlin Heidelberg.
Zhou, L., Ding, L., and Finin, T. (2011). How is the se-
mantic web evolving? a dynamic social network per-
spective. Computers in Human Behavior, 27(4):1294
– 1302. Social and Humanistic Computing for the
Knowledge Society.
Zywica, J. and Danowski, J. (2008). The faces of facebook-
ers: Investigating social enhancement and social com-
pensation hypotheses; predicting facebook and offline
popularity from sociability and self-esteem, and map-
ping the meanings of popularity with semantic net-
works. Journal of Computer-Mediated Communica-
tion, 14(1):1–34.
Semantic Social Network Analysis Foresees Message Flows
303
