
A Support Vector Machine based Prediction Model for
Discrimination of Malignant Pulmonary Nodules from Benign
Nodules
Yan Wu
1,2
, Emmanuel Zachariah
1
, Judith K. Amorosa
2
, Anjani Naidu
2
, Mina L. Labib
2
,
Jamil Shaikh
2
, Donna Eckstein
2
, Sinae Kim
3
, John E. Langenfeld
1
, Joseph Aisner
1
, John L. Nosher
2
,
Robert S. DiPaola
1
and David J. Foran
1
1
Rutgers Cancer Institute of New Jersey, Rutgers, The State University of New Jersey,
195 Little Albany Street, New Brunswick, NJ 08903, U.S.A.
2
Department of Radiology, Rutgers Robert Wood Johnson Medical School, Rutgers, The State University of New Jersey,
1 Robert Wood Johnson Place, New Brunswick, NJ 08901, U.S.A.
3
Department of Biostatistics, Rutgers School of Public Health, Rutgers, The State University of New Jersey,
683 Hoes Lane West, Piscataway, NJ 08854, U.S.A.
Keywords: Support Vector Machine, Malignant Nodules, Benign Nodules, Pulmonary Nodules, Prediction Model.
Abstract: Lung cancer is the leading cause of cancer death in the United States and worldwide. Most patients are
diagnosed at an advanced stage, usually stage III or IV. Identification of lung cancer patients at an early
stage might enable oncologists to surgically remove the tumors. Currently, low dose CT scans are used to
identify the malignant nodules in high risk patients. However, screening CT scans yield a high rate of false-
positive results. A prediction model was developed for improved discrimination of malignant nodules from
benign nodules in patients who underwent lung screening CT. CT images and clinical outcomes of 39
patients were obtained from the National Lung Screening Trial (NLST), National Cancer Institute, National
Institute of Health. Images were analyzed to extract computational features relevant to malignancy
prediction. A Support Vector Machine (SVM) based model was developed to predict the malignancy of
nodules. During pilot studies, our model achieved the following prediction performance: accuracy of 0.74,
sensitivity of 0.85, and specificity of 0.61.
1 INTRODUCTION
Lung cancer is the leading cause of cancer death in
the United States and worldwide. The mortality rate
from lung cancer is greater than the number of
deaths from breast, colon, and prostate cancer
combined. In 2015, there will be an estimated
226,000 new cases of lung cancer diagnosed in the
United States and over 160,000 individuals are
expected to die from this disease (Cancer Facts and
Figures 2015). Most patients will be diagnosed with
locally advanced (stage III) or metastatic (stage IV)
disease and the expected 5‐year survival rate is only
~15% (Sozzi and Boeri 2014). Adenocarcinoma, the
most common form of lung cancer, presents as a
solitary pulmonary nodule which is easier to detect
on CT than on a chest X-ray. Identification of
patients at an early stage could potentially enable
oncologists to surgically remove the tumors.
Presently, there is no simple screening protocol
for lung cancer that yields discriminatory results
similar to those realized in breast (mammogram) and
colon cancers (colonoscopy). The National Lung
Screening Trial (NLST), initiated during 2002,
established the potential utility of low dose CT
(LDCT) screening to reduce lung cancer specific
mortality in the high-risk population of current and
former smokers (55–74 years of age, cigarette
smokers with a history of at least 30 pack-years, and
former smokers who quit smoking within the past 15
years). The data showed that there was a significant
reduction (20%) in the death rates from lung cancer
in participants who had LDCT compared to
participants who had standard chest X-ray (National
Lung Screening Trial Research Team, 2011);
however, LDCT scans yield a high rate of false-
positive results (National Lung Screening Trial
Wu, Y., Zachariah, E., Amorosa, J., Naidu, A., Labib, M., Shaikh, J., Eckstein, D., Kim, S., Langenfeld, J., Aisner, J., Nosher, J., DiPaola, R. and Foran, D.
A Support Vector Machine based Prediction Model for Discrimination of Malignant Pulmonary Nodules from Benign Nodules.
DOI: 10.5220/0005824101290133
In Proceedings of the 9th International Joint Conference on Biomedical Engineering Systems and Technologies (BIOSTEC 2016) - Volume 2: BIOIMAGING, pages 129-133
ISBN: 978-989-758-170-0
Copyright
c
2016 by SCITEPRESS – Science and Technology Publications, Lda. All rights reserved
129

Research Team, 2011), (Wood et al., 2012),
(Arenberg and Kazerooni 2012). In the NLST CT
group, almost 40% of participants had at least 1
positive CT result during the study, but more than
96% of the positive test results in the CT group of
the NLST were false-positive. Consequently, it may
lead to unnecessary and costly biopsies or follow up
Positron emission tomography–computed
tomography (PET-CT) scans or follow up CT.
RECIST (Response Evaluation Criteria In Solid
Tumors) criteria is being used to identify and follow
nodules in lung cancer patients (Eisenhauer et al.,
2009). However, it has limited capability to
distinguish malignant nodules from benign lesions.
In our study, we developed and tested a Support
Vector Machine (SVM) based risk prediction model
to investigate it performance in discriminating
between malignant and benign nodules in
asymptomatic high risk patients.
2 MATERIAL AND METHODS
2.1 CT Scan Image Analysis
CT images from 39 patients who participated in the
NLST were obtained from National Cancer Institute
(NCI), National Institute of Health. A trial-wide
database is available for download at
https://biometry.nci.nih.gov/cdas/, Cancer Data
Access Systems (CDAS), NCI. The data set for each
patient acquired at each year includes 100–300 slices
of dicom images. An approval was obtained from
Rutgers Internal Review Board to process the
images.
Images were analyzed using software developed
at the Center for Biomedical Imaging and
Informatics, Rutgers Cancer Institute of New Jersey
(http://pleiad.umdnj.edu). For each patient, a
pulmonary nodule was first segmented on the Vitrea
workstation (Vitrea 2; Vital Images, Plymouth,
MN). Within the tumor region, texture analysis was
performed using the Local Binary Pattern (LBP)
method (Ojala et al., 1996). The local binary pattern
of a single pixel is determined by its signal intensity
relative to its neighbors (if a neighbor has signal
intensity higher than that of the central pixel, then 1”
is assigned; otherwise “0” is assigned). In this way, a
binary sequence is generated for the pixel, indicating
the relative variation in its signal intensity compared
with its neighbors. In the binary sequence, the
number of consecutive “1”s is counted as the LBP
for the pixel, if all "1”s are consecutive; otherwise,
the LBP is set as N+1 and not differentiated further.
With local binary pattern of each pixel obtained, the
histogram of LBP is collected within the tumor
region and normalized to eliminate the influence of
tumor size. Although the local binary pattern can be
measured at different scales (to capture the texture
characteristics from fine to coarse), a single scale
LBP was measured in this study due to the small
size of some pulmonary nodules, where a small
radius (1 pixel, 8 neighbors) was used. For each
nodule, the volume of the nodule and its histogram
of signal intensity were also calculated
automatically.
Other features were specified by diagnostic
radiologists in the Department of Radiology, Rutgers
Robert Wood Johnson Medical School. Those
features include the location of nodules (left, right;
superior, middle, inferior), the margin of nodules
(smooth, lobular, irregular, spiculated), the shape of
nodules (round, oval, complex), the attenuation of
nodules (soft tissue, ground glass, mixed, solid,
calcium), the attachment of nodules (none, fissural,
pleural), and whether the patient has emphysema.
All the features specified or extracted from images
were used as the input to statistical prediction model.
2.2 SVM based Risk Prediction Model
The prediction of malignancy of nodules was
accomplished by establishing and using the SVM
model. Support Vector Machine is a supervised
learning algorithm (Cortes and Vapnik, 1995). The
SVM classifier was established during the training
procedure based on the clinical outcomes (malignant
vs benign) and image features (extracted from CT
images or specified by radiologists as described
above). The optimal decision boundary was
determined by maximizing the distance in features
between two different classes. After a SVM
prediction model was established, the prediction of
tumor progression of a new patient could be
automatically made based on his own image
features. The prediction was compared with the
clinical outcome (truth) for evaluation of accuracy,
sensitivity, and specificity. Due to the limited
sample size, we adopted leave-one-out approach to
build the prediction model.
In the SVM classifier developed for this study,
soft margin was used to allow for mislabeled
samples, where training errors were incorporated
into the cost function, and optimization became a
tradeoff between a large margin and a small error
penalty controlled by a parameter C. By using a
nonlinear kernel, the SVM classifier permitted
nonlinear decision boundary that fits data more
BIOIMAGING 2016 - 3rd International Conference on Bioimaging
130
closely. When Gaussian Radial Basis function was
used (as one of the most popular kernels), a
parameter sigma determines how smoothly input
features varied. The choice of parameters (C for soft
margin and sigma for GRB) was determined by
cross validation – the parameters with the best cross
validation accuracy were selected during the training
procedure and would be used for future predictions
during the test procedure.
3 RESULTS
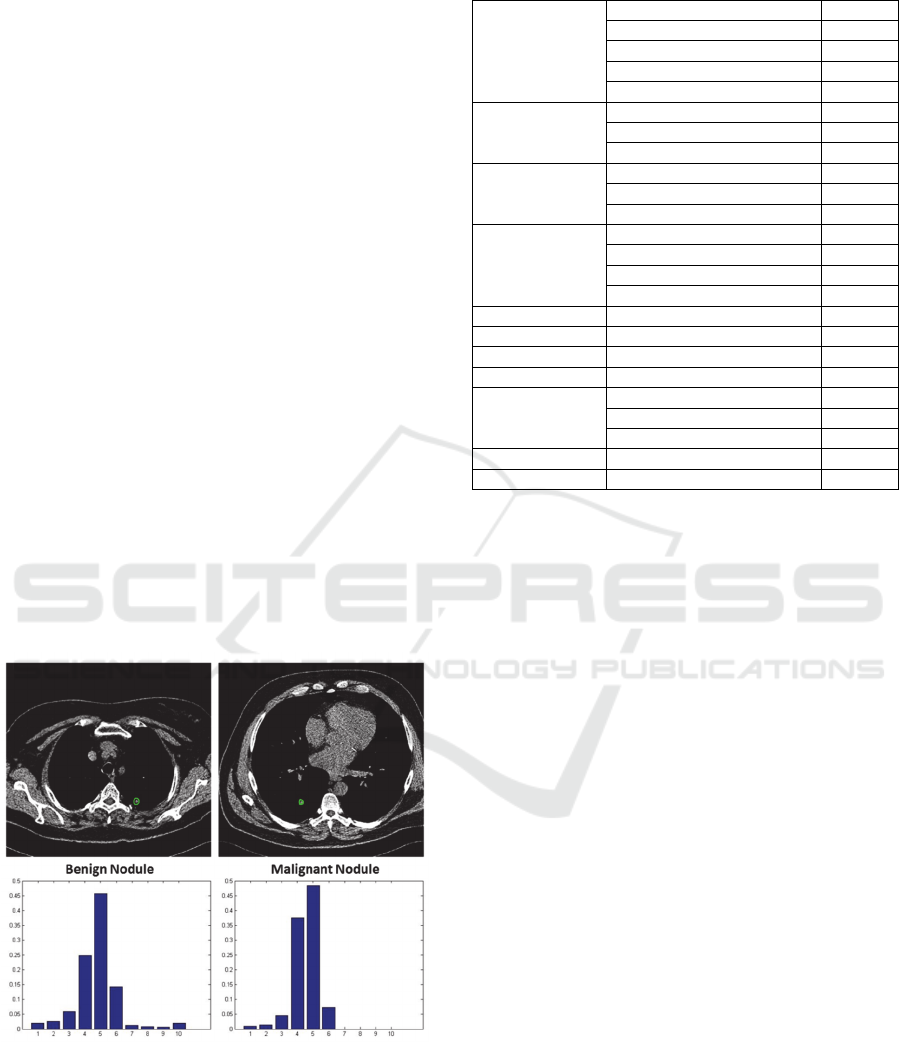
CT images obtained from 39 patients were analyzed
in the present study. Pulmonary nodules were first
segmented by diagnostic radiologists. Then texture
features were automatically calculated using the
Local Binary Pattern method, and 10D local binary
histograms were generated, as shown in Figure 1.
Values were assigned for other imaging features
(including tumor location, attachment, shape,
attenuation, margin, and emphysema) depending on
its possibility of malignancy, as shown in Table 1.
The SVM prediction model was used with RBF
(radius basis function) kernel and soft margin. The
prediction result is shown as follows:
Accuracy= 0.74, sensitivity = 0.85, specificity =
0.61.
Figure 1: Tumor segmentation and texture feature
extraction.
Table 1: Image features specified by radiologists.
Location
Right Upper Lobe
1.0
Right Middle Lobe
1.5
Right Lower Lobe
2.0
Left Lower Lobe
1.1
Left Upper Lobe
2.1
Attachment
None
0
Fissure
1
Pleural
2
Shape
Oval
1
Round
2
Complex
3
Attenuation
Soft Tissue
1
Ground glass
2
Mixed
3
Solid Density
4
Margins
Smooth
1
Lobulated
2
Irregular
3
Spiculated
4
Calcification
None
0
Central
1
Diffuse
2
Emphasyma
None
0
Yes
1
4 DISCUSSION
Several lung cancer risk models have been
established during the past ten years (Tammemagi,
2015). Risk factors were used to predict the
probability that a person was likely to develop lung
cancer (Bach et al., 2003), (Spitz et al., 2007),
(Cassidy et al., 2008). More recently, radiology
image features were incorporated to predict
malignancy of pulmonary nodules (Sluimer et al.,
2006) (Maldonado et al., 2013). In these studies,
logistic regression model was widely used.
However, in several recent clinical studies and
simulations, SVM demonstrated better performance
in various classification applications than the logistic
regression model (Entezari-Maleki et al. 2009),
(Wang and Huang 2011), (Salazar et al., 2012). In
the present pilot study, we developed a SVM based
model to discriminate malignant nodules from
benign nodule.
While we recognize that the present study
utilized a relatively small number of subjects,
incorporation of CT scan data from more subjects
could potentially increase the prediction accuracy of
our present standalone model. In addition, we
hypothesize that the incorporation of molecular
biomarkers with the CT scan image data for both
risk assessment and early diagnosis will further
improve the diagnostic accuracy of LDCT (Rutman
A Support Vector Machine based Prediction Model for Discrimination of Malignant Pulmonary Nodules from Benign Nodules
131

and Kuo 2009), (Zander et al., 2011), (Gevaert et al.,
2012), (Tammemagi, et al., 2013). There are a few
reports on the integration of genomic data with CT
scan image data (Showe et al., 2009) however, there
is no commercial test available using the integrated
approach to discriminate nodules in lung cancer.
Further studies are in progress to analyze CT scan
images and genomic data collected from high risk
individuals.
ACKNOWLEDGEMENTS
This research was funded, in part, by grants from the
National Institute of Health through contract
5R01CA161375-03 from the National Cancer
Institute; and contract 5R01LM009239-06 from the
National Library of Medicine (D.F.).
COMPETING INTEREST
E.Z. holds position and shares in OncoPath
Genomics, Inc.
REFERENCES
American Cancer Society. (2015) Cancer Facts and
Figures. http://www.cancer.org/research/cancerfacts
statistics/cancerfactsfigures2015/ Accessed on
10/10/2015.
Arenberg, D., and Kazerooni, E.A., (2012). Setting up a
lung cancer screening program. Journal of the
National Comprehensive Cancer Network, 10(2):277–
285.
Bach, P.B., Kattan, M.W., Thornquist, M.D., Kris, M.G.,
Tate, R.C., Barnett, M.J., Hsieh, L.J., and Begg, C.B.
(2003).Variations in lung cancer risk among smokers.
Journal of the National Cancer Institute, 95(6): 470–
478.
Cassidy, A., Myles, J.P., Van-Tongeren, M., Page, R.D.,
Liloglou, T., Duffy, S.W. and Field, J.K. (2008). The
LLP risk model: an individual risk prediction model
for lung cancer. British Journal of Cancer, 98(2):270–
276.
Cortes, C., and Vapnik, V., (1995). Support-vector
networks. Machine Learning, 20:273-297.
Eisenhauer, E.A., Therasse, P., Bogaerts, J., et al. (2009).
New response evaluation criteria in solid tumors:
Revised RECIST guideline (version 1.1). European
Journal of Cancer, 45:228-247.
Entezari-Maleki, R., Rezaei, A., a nd Minaei-Bidgoli, B.,
(2009). Comparison of Classification Methods Based
on the Type of Attributes and Sample Size. Journal of
Convergence Information Technology, 4(3):94-102.
Gevaert, O., Xu, J., Hoang, C.D., Leung, A.N., Xu, Y.,
Quon, A., Rubin, D.L., Napel, S., and Plevritis, S.K.
(2012). Non–Small Cell Lung Cancer: Identifying
prognostic imaging biomarkers by leveraging public
gene expression microarray data-Methods and
preliminary results. Radiology, 264(2):387-396.
Maldonado, F., Boland, J.M., Raghunath, S., et al. (2013).
Non-invasive Characterization of the Histopathologic
Features of Pulmonary Nodules of the Lung
Adenocarcinoma Spectrum using Computer Aided
Nodule Assessment and Risk Yield (CANARY) – a
Pilot Study. Journal of Thoracic Oncology, 8(4): 452-
460.
National Lung Screening Trial Research Team. (2011).
Reduced lung-cancer mortality with low-dose
computed tomographic screening. New England
Journal of Medicine, 365(5):395-409.
Ojala, T., Pietikainen, M., and Harwood, D., (1996). A
comparative study of texture measures with
classification based on featured distributions. Pattern
recognition, 29(1):51-59.
Rutman, A.M., and Kuo, M.D., (2009). Radiogenomics:
creating a link between molecular diagnostics and
diagnostic imaging. European Journal of Radiology,
70(2):232–241.
Salazar, D.A., Velez, J.I., and Salazar, J.C., (2012).
Comparison between SVM and Logistic Regression:
Which One is better to Discriminate? Revista
Colombiana de Estadística Número especial en
Bioestadística, 35:223-237.
Showe, M.K., Vachani, A., Kossenkov, A.V., et al.
(2009). Gene Expression Profiles in Peripheral Blood
Mononuclear Cells Can Distinguish Patients with
Non-Small-Cell Lung Cancer from Patients with Non-
Malignant Lung Disease. Cancer Research,
69(24):9202–9210.
Sluimer, I., Schilham, A., Prokop, M., and Van-Ginneken,
B. (2006). Computer Analysis of Computed
Tomography Scans of the Lung: A Survey. IEEE
Transactions on Medical Imaging, 25(4):385-405.
Sozzi, G., and Boeri, M., (2014). Potential biomarkers for
lung cancer screening. Transl. Lung Cancer Research,
3(3):139-148.
Spitz, M.R., Hong, W.K., Amos, C.I., Wu, X., Schabath,
M.B., Dong, Q., Shete, S. and Etzel, C.J. (2007). A
risk model for prediction of lung cancer. Journal of the
National Cancer Institute, 99(2):715–726.
Tammemagi, M.C., Katki, H.A., Hocking, W,G., et al.
(2013). Selection criteria for lungcancer screening.
New England Journal of Medicine, 368(8):728–736.
Tammemagi, M.C., (2015). Application of Risk Prediction
Models to Lung Cancer Screening: a review. Journal
of Thoracic Imaging, 30(2):88–100.
Wang, H., and Huang, G., (2011). Application of support
vector machine in cancer diagnosis. Medical
Oncology, 28(1):613-618.
Wood, D.E., Eapen, G.A., Ettinger, D.S., et al. (2012).
Lung cancer screening. Journal of the National
Comprehensive Cancer Network, 10(2):240–265.
Zander, T., Hofmann, A., Staratschek-Jox, A., et al.
BIOIMAGING 2016 - 3rd International Conference on Bioimaging
132

(2011). Blood-Based Gene Expression Signatures in
Non–Small Cell Lung Cancer. Clinical Cancer
Research, 17(10):3360-3367.
A Support Vector Machine based Prediction Model for Discrimination of Malignant Pulmonary Nodules from Benign Nodules
133
