
Increasing Alertness while Coding Secondary
Diagnostics in the Medical Record
Ghazar Chahbandarian
1
, Nathalie Souf
1
, R
´
emi Bastide
1
and Jean-Christoph Steinbach
2
1
University of Toulouse, IRIT/ISIS, F-81100 Castres, France
2
Department of Medical Information, Pays d’Autan Hospital, Castres, France
Keywords:
Electronic Medical Records, EMR, Context, Data Mining, Decision Tree, ICD, PMSI.
Abstract:
In order to measure the medical activity, hospitals are required to manually encode information concerning a
patient’s stay using International Classification of Disease (ICD-10). This task is time consuming and requires
substantial training for the staff. We propose to help by speeding up and facilitating the tedious task of coding
patient information, specially while coding some secondary diagnostics that are not well described in the
medical resources such as discharge letter and medical records. Our approach consists of building a decision
tree out of big variety of inpatient stay information in particular, contextual information such as age, sex,
diagnostic count and other related information, next figure out missing secondary diagnostics. The results
are still preliminary, we identify some important information variables that can be interesting to verify while
coding certain secondary diagnostics.
1 INTRODUCTION
In medical environment, and especially in hospitals,
accurate and fast documenting of diagnosis and
of medical procedures becomes a necessity. The
estimation of monthly hospital costs will be more
accurate, thus leading to better funding in the future.
In the US, in 1983 the health system started using
a system called Prospective Payment System (PPS)
to store all the diagnostics under standardized codes
International Classification of Disease (ICD-10)
(WHO, ), which in turn helped to save more than
$50 billion since 1990 (Fetter, 1991). Similarly in
France, in 1996 the ministry of health introduced
a computerized medical data recording system
PMSI ’Programme de m
´
edicalisation des syst
`
emes
d’information‘- Medical Program Information Sys-
tem (Dubois-Lefr
`
ere and Coca, 1992). In the PMSI,
each inpatient stay is classified into groups called
GHS ’Groupe Homog
`
ene de S
´
ejour’ equivalent to
Diagnosis Related Group (DRG) in the US. The GHS
groups together all the similar inpatient stays in order
to evaluate the cost of the hospital activity and finally
to fairly refund the hospital.
Each inpatient stay leads to the recording of infor-
mation such as diagnostics, medical procedures,
prescriptions, complications and comorbidities, the
diagnostics are coded according to ICD-10.
Each hospital tries to encode all the diagnostics
and the medical procedures as accurately as possible
to maximize its funding efficiency. However, coding
process is a difficult task and it depends on the knowl-
edge of the coders in addition to the interpretation of
the coding rules. The process involves reading and
understanding diagnostic medical resources such as
discharge letters written by the doctors or the physi-
cians, firstly to find the right principal diagnostic that
motivates the inpatient stay, secondly to find other
secondary diagnostics related to the stay and finally
all found diagnostics are encoded into ICD-10 codes.
Coding all the diagnostics accurately is not an
easy task. Some hospitals hire specialized people
with coding experience to translate diagnostics faster
and more accurately. In reality it’s not difficult to code
the principal diagnostic and medical procedures be-
cause they are clearly mentioned in the medical let-
ter most of the time, whereas certain secondary diag-
nostics are not well described, such as obesity, de-
nutrition and respiratory failure and they are often
not coded in PMSI. In France, one hospital reported
that more than a third of the patients with denutrition
and obesity were not coded in the database (Potignon
et al., 2010).
In this paper. we focus on helping the coders by
increasing their alertness level to detect secondary di-
490
Chahbandarian, G., Souf, N., Bastide, R. and Steinbach, J-C.
Increasing Alertness while Coding Secondary Diagnostics in the Medical Record.
DOI: 10.5220/0005824004900495
In Proceedings of the 9th International Joint Conference on Biomedical Engineering Systems and Technologies (BIOSTEC 2016) - Volume 5: HEALTHINF, pages 490-495
ISBN: 978-989-758-170-0
Copyright
c
2016 by SCITEPRESS – Science and Technology Publications, Lda. All rights reserved

agnostics even if they are not well described in the
medical resources. In order to achieve this goal we
will use different kind of information available in the
inpatient stay to build a decision tree and finally high-
light the important variables used for each diagnostic.
2 RELATED WORK
There are few research works focusing on the use of
data mining to predict a diagnostic code and we can
report some of the following used methods:
• Sequential patterns. (Djennaoui et al., 2014) used
sequential patterns to detect similar medical pro-
cedures patterns between different inpatient stays
and to extract rules of these patterns to predict
missing diagnostics. They studied three diag-
nostics and they were able to extract three rules,
two of them are predicting the same diagnostic.
Another similar work is done by (Pinaire et al.,
2015).
• Text Mining. Other few works tried to extract the
diagnostic codes directly from the medical letter
using thesaurus such as MeSH (Medical Subject
Heading) in (Pereira et al., 2006) or using proba-
bilistic methods as in (Lecornu et al., 2009).
• Clustering. (Erraguntla et al., 2012) used K-
nearest method to cluster all the similar inpatient
stays and predict a missing diagnostic.
In our work we want to explore the use of decision
tree method. Decision trees are useful in a context
when clear results are needed, visually understand-
able, specially when they need to be validated by non
specialist. We made the hypothesis that if we are able
to determine which variables may help to predict a
secondary diagnosis, we could help the coders to pay
attention to these variables while coding.
3 METHODS
3.1 Used Data
We used an anonymous sample data extracted from
the PMSI database of “Pays d’Autan” hospital, it
contains around 75,000 inpatient stays between 2011
and 2014. We decided to use the information recorded
in the PMSI database which are often well encoded
as they are easy to detect (primary diagnoses, sex,
age, stay duration...) to build decision tree. We also
used two levels of diagnostics grouping, the first level
groups the diagnostics into 19 general categories de-
pending on thier similarities, the second level groups
the diagnostics into 126 more specific categories. Af-
ter fixing the primary and the secondary diagnostic of
the inpatient stay, we retained the following informa-
tion to include in the construction of the decision tree:
Table 1: Used variables in building the decision tree.
Sex Male or Female
Mode of Entry (ME)
Patient acceptance mode in the inpa-
tient stay. (GUIDE, 2006)
Mode of Sortie/Exit
(MS)
Patient leaving mode of the inpa-
tient stay. (GUIDE, 2006)
Age Patient’s age when accepted in the
inpatient stay.
Duration The duration of the inpatient stay in
days.
Season
The season of the inpatient stay
when the patient is accepted.
Frequency
Patient’s inpatient stay count in the
hospital
Gap
The gap in days between the entry
date and the first medical procedure.
Passage count
The movements count between dif-
ferent sections during the inpatient
stay.
Medical procedures
count
Medical procedure count while the
inpatient stay.
ICR
The quota cost of medical proce-
dures in teh inpatient stay.
Classified
Whether the inpatient stay contains
a classified/important medical pro-
cedure.
Emergency Whether the inpatient stay contains
an emergency case.
Example/Label
Positive if the inpatient stay has both
the principal and the secondary di-
agnostics. Negative if it has only the
principal diagnostic
Medical procedure
chapters
A set of 19 variables each variable
indicates if the inpatient stay con-
tains a corresponding medical pro-
cedure.
Urgent medical pro-
cedure chapters
A set of 5 variables each variable in-
dicates if the inpatient stay contains
a corresponding urgent medical pro-
cedure category.
First level diagnostic
grouping
A set of 19 variables each vari-
able indicates if the inpatient stay
contains a corresponding diagnostic
grouping.
Second level diagnos-
tic grouping
A set of 126 variables each vari-
able indicates if the inpatient stay
contains a corresponding diagnostic
grouping.
In total, we have 181 information variables we can
use to learn our model. The diagnostics were en-
coded according to the 10th revision of the Interna-
tional Classification of Diseases (ICD-10) (WHO, ).
The French version of it contains 33,816 codes, the
first three characters of the codes stand for code cate-
Increasing Alertness while Coding Secondary Diagnostics in the Medical Record
491

gories, there are 2,049 categories and they are usually
used for code predication. In our work we used the
categories instead of the full code in order to increase
the learning set as much as possible when studying a
certain diagnostic.
We decided to focus on interesting and frequent
secondary diagnostics but difficult to detect as they
are usually not well described in the medical letters.
For this reason, the responsible doctor of the Medical
Information Department (DIM) in the ’Pays d’Autan’
hospital helped us to choose some secondary diagnos-
tics that fulfil the criteria. Table 2.
As for the machine learning method, we used
Classification and Regression Tree (CART) algo-
rithms to build a decision tree (Tuff
´
ery, 2010), we
have chosen decision tree because it generates simple
rules, easy to interpret and can be validated by doctors
who are not necessarily specialist in the domain.
Table 2: Summary of the chosen secondary diagnostics.
ICD-10
codes
Lables Count in
DB
J96 Respiratory failure 2381
L97 Ulcer of lower limb 332
B96
Other specified bacterial agents as
the cause of diseases classified to
other chapters
4008
T81 Complications of procedures 590
R29
Other symptoms and signs involv-
ing the nervous and musculoskele-
tal systems
744
R26 Abnormalities of gait and mobility 1456
3.2 Implementation
For the implementation phase we used R language in
R-studio environment, R is famous for its algorithms
and statistics libraries that are easy to implement and
test, such as rpart. The first step is to choose the right
configuration such as:
• The secondary diagnostic list to study.
• Manuel or automatic discretization of continues
variables.
• the granularity level of variables.
• The weight of positive and negative examples.
Then, for each secondary diagnostic we query the
most ten frequent principal diagnostics. Afterwards,
for each principal and secondary diagnostic we query
the positive and negative examples. The positive ex-
amples are all the inpatient stays that contain both
the principal and the secondary diagnostic at the same
time. Whereas, the negative examples are all the in-
patient stay that contain only the principal diagnostic
without the secondary one. We used the example vari-
able as an output variable to teach our model on the
positive examples.
We discretized the continuous variables into three
ranges (below average - average - over average),
knowing that rpart library in R give us the possibil-
ity to discretize the variables into ranges, we pref-
ered to do it ourselves to avoid non meaningful ranges
and to avoid to cut them into to many ranges. For
future tests, the automatic discretization option is al-
ways available.
Then, we use all the processed data to build the
decision tree using rpart library (Therneau and Atkin-
son, 2015). Rpart is using CART decision tree with
Gini impurity measure to choose the right variables to
split and it performs pruning on the trees using cross-
validation. (Tuff
´
ery, 2010)
Finally to calculate the important variables we
used a built-in function in rpart library that is defined
by ”A variable may appear in the tree many times,
either as a primary or a surrogate variable. An over-
all measure of variable importance is the sum of the
goodness of split measures for each split for which it
was the primary variable, plus goodness * (adjusted
agreement) for all splits in which it was a surrogate.”
(Therneau and Atkinson, 2015), consequently we cu-
mulated all the measurement of the important vari-
ables so we have a final measurement at the end of
the loop. We export the important variables table for
further analysis.
Begin
Choose the right configuration (granularity
level of diagnostics chapter variables to
include secondary diagnostics)
For each secondary diagnostic do
{
Choose the most 10 frequent principal
diagnostics
For each principal diagnostic do
{
query the positive and negative examples
Process continues variables to discrete
ones (age-duration-frequency - medical
procedures count-ICR-MS-ME)
Build the decision tree using CART algori-
thm
Export the tree
Cumulate the measurement of ’goodness of
split’ for each variable in a table.
}
Export the important variables table
}
End.
HEALTHINF 2016 - 9th International Conference on Health Informatics
492
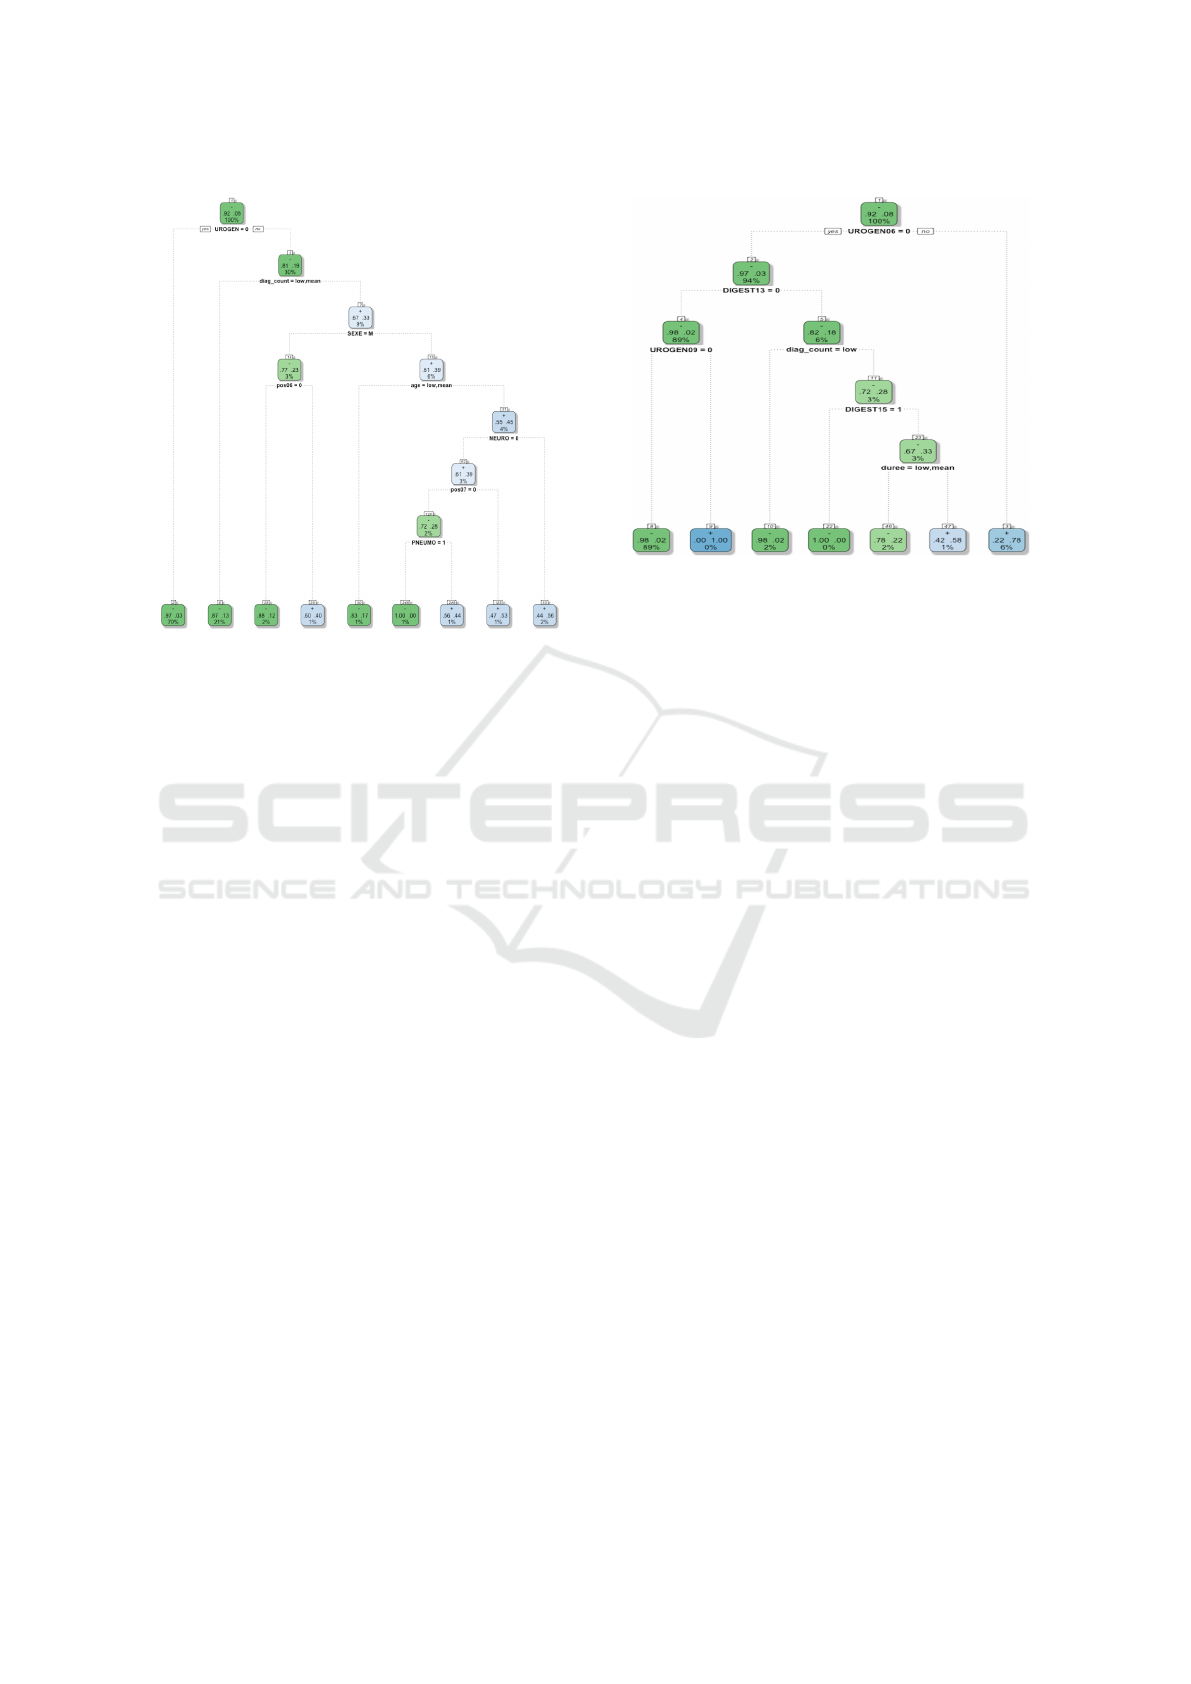
Figure 1: Decision tree of B96 ”Other specified bacte-
rial agents” with R10 ”Acute abdomen” with error rate of
5.91% blue nodes represent positive nodes and green nodes
represents negative nodes; each node has three numbers top
left is the percentage of the negative examples, the num-
ber top right is the percentage of the positive examples; the
number at bottom is the percentage of overall examples.
4 RESULTS
Since we have two levels of granularity of diagnostic
grouping we run the program two times. the first run
with 56 variables in total by including the first level
of diagnostic grouping. For the second run we used
163 variables in total by including the second level
of diagnostic groupings. In the following, we show
the results of the two runs of B96 which is ”Other
specified bacterial agents” as secondary diagnostic.
4.1 Decision Tree
We built a decision tree for each secondary diagnostic
mention in table 2 with the ten principal diagnostics.
For example figure 1 is showing the decision tree of
the first run of B96 ”Other specified bacterial agents”
as secondary diagnostic with R10 ”Acute abdomen”
as principal diagnostic, the error rate is 5.91% using
10 fold validation. We notice for instance that if the
inpatient stay has urogenital diseases, the diagnostic
count is over average and the patient is over aged male
and has neurological diseases then probably the inpa-
tient stay has B96 ”Other specified bacterial agents”
as secondary diagnostic.
In the second run Figure 2 we had more details
about the medical procedure used in the inpatient stay
Figure 2: Decision tree of B96 ”Other specified bacte-
rial agents” with R10 ”Acute abdomen” with error rate of
3.21% blue nodes represent positive nodes and green nodes
represents negative nodes; each node has three numbers top
left is the percentage of the negative examples, the num-
ber top right is the percentage of the positive examples; the
number at bottom is the percentage of overall examples.
such as UROGEN06 ”Urinary tract infection” instead
of UROGEN ”Pelvic pain, urogenital diseases”. In
addition to less error rate 3.21
4.2 Variable Selection
To select the important variables for each studied sec-
ondary diagnostic we compared the important vari-
ables list from the first and the second run of our pro-
gram and then select the important variables with the
highest scores for each diagnostic, that help us to dis-
tinguish the interesting variables to verify while cod-
ing. For instance, in the first run figure 3 represents
the important variables of B96 ”Other specified bac-
terial agents” as secondary diagnostic studied over
the most ten frequent principal diagnostic, the vari-
ables are in order (Pelvic pain, urogenital diseases -
diagnostic count- 8th chapter of medical procedure -
duration - emergency - sex - 4th chapter of medical
procedure - age...) In the second run figure 4 rep-
resents the important variables of B96 ”Other speci-
fied bacterial agents” as secondary diagnostic with the
most ten frequent principal diagnostic, the variables
are in order (UROGEN06- UROGEN09 - emergency
- 4th chapter of medical procedure- diagnostic count-
duration- 8th chapter of medical procedure ...)
5 CONCLUSIONS
In this paper we presented our approach to help the
Increasing Alertness while Coding Secondary Diagnostics in the Medical Record
493
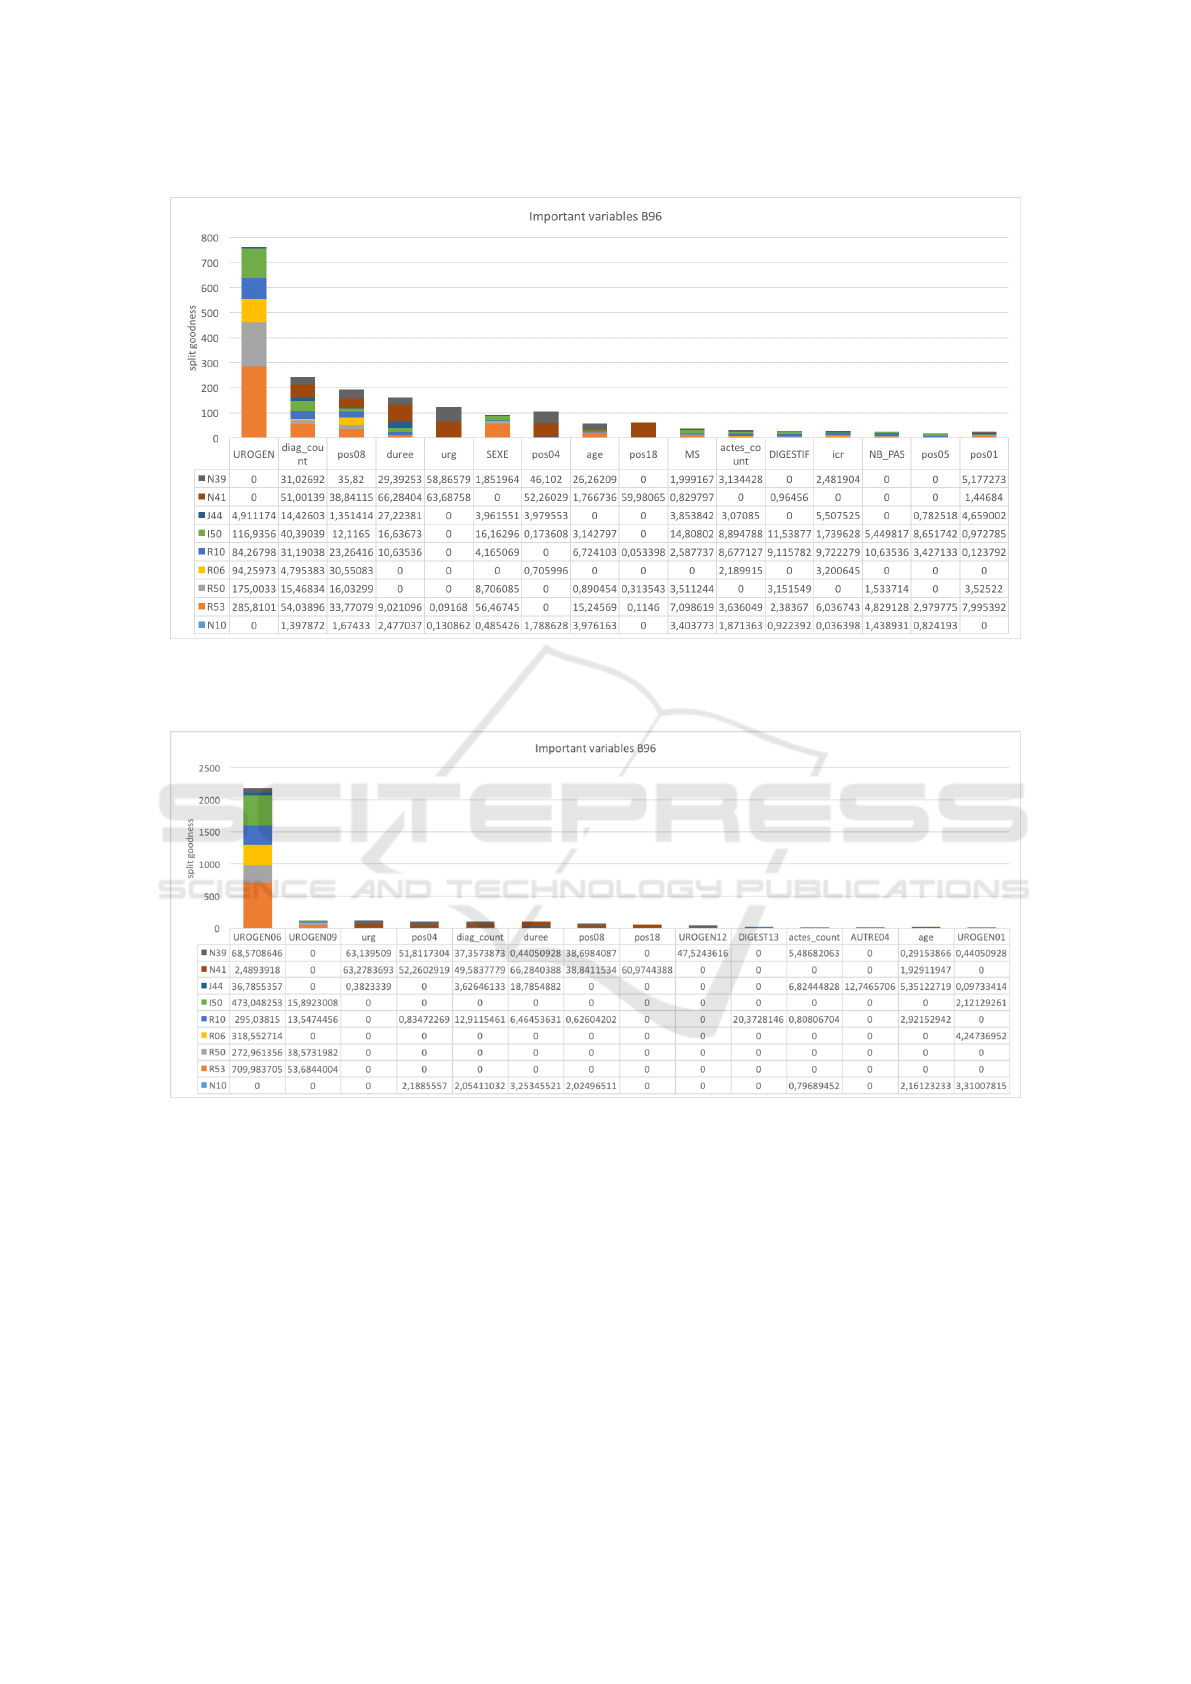
Figure 3: First run important variables chart for the B96 ”Other specified bacterial agents” as secondary diagnostic: the table
at the bottom of the figure represents the important variable table ordered descending each line represents the values obtained
with the appropriate principal diagnostic.
Figure 4: Second run important variables chart for the B96 ”Other specified bacterial agents” as secondary diagnostic: the
table at the bottom of the figure represents the important variable table ordered descending each line represents the values
obtained with the appropriate principal diagnostic.
coders encoding secondary diagnostics that are often
neglected when coding, because related information
are often spread into different information type. For
this reason, we used the inpatient stay information
available in PMSI database to build a decision tree
that detects the missing secondary diagnostics. We
studied a group of secondary diagnostic suggested by
the responsible doctor of PMSI database. As a result,
we built a model to detect the missing secondary di-
agnostics in addition to identification of the important
variables used to determine them. The work is still
preliminary we hope to validate the results on unseen
data and generalize the result to include more sec-
ondary diagnostics and finally to validate the results
by using national PMSI database.
ACKNOWLEDGEMENTS
We thank the Midi-Pyr
´
en
´
ees region, the metropole
Castres-Mazamet, INU Champollion and Paul
Sabatier University for funding the research.
HEALTHINF 2016 - 9th International Conference on Health Informatics
494

REFERENCES
Djennaoui, M., Ficheur, G., Beuscart, R., and Chazard,
E. (2014). Improvement of the quality of medical
databases: data-mining-based prediction of diagnostic
codes from previous patient codes. Studies in health
technology and informatics, 210:419–423.
Dubois-Lefr
`
ere, J. and Coca, E. (1992). Ma
ˆ
ıtriser l
´
evolution
des d
´
epenses hospitali
`
eres: le PMSI.
Erraguntla, M., Gopal, B., Ramachandran, S., and Mayer,
R. (2012). Inference of missing ICD 9 codes using
text mining and nearest neighbor techniques. In Sys-
tem Science (HICSS), 2012 45th Hawaii International
Conference on, pages 1060–1069. IEEE.
Fetter, R. B. (1991). Diagnosis Related Groups: Under-
standing Hospital Performance. Interfaces, 21(1):6–
26.
GUIDE (2006). Guide Mthodologique De Production Des
Rsums De Sjour Du Pmsi En Mdecine, Chirurgie Et
Obsttrique.
Lecornu, L., Thillay, G., Le Guillou, C., Garreau, P., Saliou,
P., Jantzem, H., Puentes, J., and Cauvin, J. (2009).
REFEROCOD: a probabilistic method to medical cod-
ing support. In Engineering in Medicine and Biol-
ogy Society, 2009. EMBC 2009. Annual International
Conference of the IEEE, pages 3421–3424. IEEE.
Pereira, S., N
´
ev
´
eol, A., Massari, P., Joubert, M., and Dar-
moni, S. (2006). Construction of a semi-automated
ICD-10 coding help system to optimize medical and
economic coding. In MIE, pages 845–850.
Pinaire, J., Rabatel, J., Az
´
e, J., Bringay, S., and Landais, P.
(2015). Recherche et visualisation de trajectoires dans
les parcours de soins des patients ayant eu un infarc-
tus du myocarde. In 3
`
eme Symposium Ing
´
enierie de
lInformation M
´
edicale (SIIM 2015), Rennes, France.
Potignon, C., Musat, A., Hillon, P., Rat, P., Osmak, L.,
Rigaud, D., Verg
`
es, B., and Others (2010). P146-
Impact financier pour les
´
etablissements hospitaliers
du mauvais codage PMSI de la d
´
enutrition et de
lob
´
esit
´
e.
´
Etude au sein du p
ˆ
ole des pathologies diges-
tives, endocriniennes et m
´
etaboliques du CHU de Di-
jon.
Therneau, T. M. and Atkinson, E. J. (2015). An Introduction
to Recursive Partitioning Using the RPART Routines.
Tuff
´
ery, S. (2010). Data mining et statistique d
´
ecisionnelle:
l’intelligence des donn
´
ees. Editions Technip.
WHO. International Classification of Diseases (ICD)-10.
Increasing Alertness while Coding Secondary Diagnostics in the Medical Record
495
