
Sloppy/Stiff Parameters Rankings in Sensitivity Analysis of Signaling
Pathways
Malgorzata Kardynska
1
, Jaroslaw Smieja
1
, Anna Naumowicz
1
, Patryk Janus
1,2
, Piotr Widlak
2
and Marek Kimmel
1,3
1
Institute of Automatic Control, Silesian University of Technology, Akademicka 16, 44-100 Gliwice, Poland
2
Maria Sklodowska-Curie Memorial Cancer Center and Institute of Oncology, 44–100 Gliwice, Poland
3
Department of Statistics, Rice University, Houston, TX 77005, U.S.A.
Keywords: Sensitivity Analysis, Sloppy Parameters, Signalling Pathways, NF-кB, HSF, HSP.
Abstract: Sensitivity analysis methods have been developed for over half a century. However, their application to
systems biology is a relatively new concept and has not been fully investigated. In this paperwe focus on
creating parameter rankings based on sloppy/stiff parameter sensitivity analysis, that can be used to find the
most important parameters and processes (that have the greatest impact on the system output) and
subsequently can be used to reduce the number of experiments needed to precisely estimate parameters
values or to indicate molecular targets for new drugs. In order to test the proposed procedure we performed
sensitivity analysis of the HSF/NF-кB pathway model - a model combining two signaling pathways
essential for cell survival.
1 INTRODUCTION
A biomathematical model is a description of a
biological system using mathematical language.
Such models are created to describe processes taking
place at different levels: from a single cell to the
entire population. In addition to many tiers of
biological system, there are also many methods that
can be used to describe them with mathematical
language. In this paper we focused on deterministic
models of so called signaling pathways, described
by ordinary differential equations. Such models are
powerful tools that allow us to develop and test
several hypotheses about complex biological
systems (Locke et al., 2005, Voit et al., 2006). In the
literature there is a growing number of high
dimensional models with a large number of
parameters. As an example, we used a model
combining two signaling pathways: HSF and NF-
кB. However, methods for measuring biochemical
parameters are limited and may introduces
substantial inaccuracies (Maerkl and Quake, 2007).
Therefore, each model should be checked with
respect to its sensitivity to parameter changes.
The sensitivity analysis is an important tool used
to determine how the change of parameters influence
the system behavior. It provides information about
the most important parameters that have the greatest
impact on the system output (and as a consequence
should be determined with the highest accuracy).
Moreover it gives us information about robustness of
the systems (Rand, 2008), which helps us validate
the model. Most of the pathways should be robust
with respect to changes in parameters in a relatively
wide range which may represent the differences
between individual cells, e.g. in the rate of
biochemical reactions (characterized by different
parameter values). Sensitivity analysis provides also
a valuable insight into the importance of particular
processes.
Sensitivity analysis methods are used to test
mathematical models for over half a century.
However, the methods used e.g. in automatic control
cannot always be directly used in systems biology,
and may lead to false conclusions. For this reason it
is necessary to develop methods which take into
account the specificity of biological systems and
experimental data. In this paper we propose a new
measure of parameter sensitivity. We use one of the
most common methods used currently in sensitivity
analysis of signaling pathways, known as
sloppy/stiff parameter sensitivity analysis
(Gutenkunst et al., 2007), however our work is
278
Kardynska, M., Smieja, J., Naumowicz, A., Janus, P., Widlak, P. and Kimmel, M.
Sloppy/Stiff Parameters Rankings in Sensitivity Analysis of Signaling Pathways.
DOI: 10.5220/0005820002780283
In Proceedings of the 9th International Joint Conference on Biomedical Engineering Systems and Technologies (BIOSTEC 2016) - Volume 3: BIOINFORMATICS, pages 278-283
ISBN: 978-989-758-170-0
Copyright
c
2016 by SCITEPRESS – Science and Technology Publications, Lda. All rights reserved

focused on creating parameter rankings, that can be
subsequently used either to reduce the model
complexity (Kim et al., 2011) or indicate
prospective molecular targets for new drugs (Marin-
Sanguino et al., 2011). We compared our method of
creating parameter rankings with the ranking based
on the areas under curve of sensitivity function.
2 SLOPPY/STIFF PARAMETER
SENSITIVITY ANALYSIS
Let the model be described by the state equation:
,
=
,
,,,
(1)
where y
s,c
denoting number or concentration of
molecules of species s in condition c, u is an input
variable and θ are model parameters.
The change in model behavior as parameters θ
varied from their nominal values θ
*
can be quantified
by the average squared change in molecular species
time course (Gutenkunst et al., 2007):
=
1
2
1
,
∙
∙
,
,
,
∗
,
,
(2)
where N
s
and N
c
are the total number of species and
conditions, respectively, T
c
is the sampling time and
σ
s
is the maximum value of species s across the
conditions considered.
To analyze model sensitivity to parameter
variation we considered the Hessian matrix
corresponding to cost function C(θ). Since
biochemical parameters very often have different
units and widely varying scale to eliminate the
impact of relative changes in parameter values the
derivatives with respect to logθ are taken:
,
=
, (3)
where j and k denotes j−th and k-th parameter,
respectively. The Hessian describes the quadratic
behavior of the cost function C near the point θ
*
. H
C
can be calculated as (Gutenkunst et al., 2007):
,
=
1
1
,
∙
∙
,
∗
,
,
∗
,
.
(4)
Based on Eq. (4) the sensitivity of the entire
model (for all species s across all considered
conditions c) to parameter variation can be
calculated. However, the sensitivity of individual
species or sensitivity of the model in specific
condition could be also examined by taking into
account only one species or condition.
The Hessian matrix is positive, definite and
symmetric, so it has real eigenvalues λ and
eigenvectors v. Analyzing H
C
corresponds to
approximating the surfaces illustrating deviations
from nominal system response. The surface is N
p
-
dimensional ellipsoids, where N
p
is the number of
parameters in the model. The principal axes of the
ellipsoids are the eigenvectors of H
C
, and the width
d
i
of the ellipsoids along each principal axis is
proportional to one over the square root of the
corresponding eigenvalue λ
i
(Gutenkunst et al.,
2007):
=
1
.
(5)
Figure 1: An example of ellipse illustrating deviations
from nominal system response for a simple model with
two parameters θ
1
and θ
2
. d
1
and d
2
denotes the width
of
the ellipse along each principal axis, corresponding to
eigenvalues λ
1
and λ
2
respectively, while v
1
and v
2
denotes
the eigenvectors defining the position of the ellipse.
The narrowest axes are called “stiff”, and the
broadest axes “sloppy”. The meaning of eigenvalues
and eigenvectors of H
C
is illustrated on a simple
example, where Hessian describes an ellipse in the
θ
1
/θ
2
parameter space (Figure 1).
The relative widths d
1
and d
2
, shown in the
Figure 1, allow us to identify “sloppy” and “stiff”
principal axis of the ellipse. However, the degree to
which the principal axes of the ellipsoids are aligned
to the bare parameter axes is also important. It can
be estimated by comparing the ellipsoids
Sloppy/Stiff Parameters Rankings in Sensitivity Analysis of Signaling Pathways
279

intersections I
i
with each bare parameter axis i,
calculated as:
=
1
,
, (6)
and projections P
i
onto each bare parameter axis i,
calculated as:
=
,
.
(7)
If I
i
/ P
i
= 1, then one of the principal axes of the
ellipsoids lies along bare parameter direction i,
however in biological systems this occurs very
rarely. More often the ellipses are skewed from
single parameter directions (Gutenkunst et al.,
2007).
Although I
i
/ P
i
ratio provides some useful
information, it does not link the skewing rate with
the width of particular principal axes of the
ellipsoids, which is also very important because it
would help us to identify the most significant
parameters in the model. To relate these width
(corresponding to “sloppy” and “stiff” principal
axes) with specified parameter changes we propose
another index, which is used to create the parameters
ranking. The index is defined for the j-th parameter
as:
=
,
(8)
where the sum is calculated over all principal axes,
d
i
is the width of the ellipsoid along i-th principal
axis, and v
j,i
is the element of the i-th eigenvector
corresponding to the j-th parameter.
3 SENSITIVITY ANALYSIS OF
THE HSF/NF-КB PATHWAYS
MODEL
In order to test the applicability of the procedure
described above we performed sensitivity analysis of
the HSF/NF-кB pathway model, which described in
(Smieja et al., 2015). The model combines two
signaling pathways essential for cell survival.
NF-κB is a family of transcription factors that
regulate the transcription of hundreds of genes,
including genes that determine cell fate. It has been
proved that NF-κB can play an antiapoptotic role in
cancer cells, e.g. via activation of anti-apoptotic
genes (Cataldi et al., 2003). Upregulation of the NF-
κB pathway is frequently observed in cancer cells,
which contributes to their resistance to the
anticancer treatment (Hayden and Ghosh, 2012;
Perkins, 2012). Therefore inhibition of NF-κB
pathway may constitute one of the goals in
anticancer therapies. Experimental results show that
heat shock induces such inhibition in cancer cells
(Janus et al., 2011). However, the precise
mechanisms of interactions between HSF and NF-
κB pathways are not fully understood yet.
Development of a combined mathematical model of
these pathways and its subsequent computational
analysis should help to develop the most efficient
anticancer therapy protocols.
Figure 2: The eigenvalues (a) and I/P (b) spectrum of the
HSF/NF-кB pathways model.
So far, numerous models of NF-κB pathway
have been developed, whereas much fewer models
of HSF pathway have been published. The model
proposed in our work was based on the previously
published ones, which described either NF-кB
(Lipniacki et al., 2004) or HSF (Szymanska and
Zylicz, 2009) pathways separately. In order to
incorporate crosstalk between HSF and NF-κB
pathways, they had to be modified: nuclear and
cytoplasmic levels of proteins and complexes had to
be separated and constitutive and inducible HSPs
were described by separate variables. The
interactions between the HSF and NF-κB pathways
take into account creation HSP:IKK complexes,
temperature-dependent inactivation of proteins
located upstream of IKK activation and inhibition of
NF-κB import to the nucleus under heat shock
condition. The reactions taken into account are
summarized in the Table 1.
We checked the sensitivity of the system
BIOINFORMATICS 2016 - 7th International Conference on Bioinformatics Models, Methods and Algorithms
280

following the procedure described in the previous
chapter. We have chosen nuclear NF-кB as one of
the state variables to illustrate applicability of the
method. The eigenvalues and I/P spectrum is plotted
on Figure 2, while parameter ranking based on index
r
j
(Eq. (8)) is shown on Figure 3. To compare the
results with other commonly used procedure, a
parameter ranking based on area under curve of
sensitivity functions is show on Figure 4. Due to
high number of parameters the horizontal axes
contains only numbers corresponding to the
parameters listed in Table 2.
In both presented rankings the position of most
parameters is comparable. However there are some
significant differences, e.g. in parameters 37 and 45,
corresponding to the ratio of cytoplasmic to nuclear
volume (k
v
) and IkBa mRNA degradation rate (c
3a
),
respectively. The parameter k
v
is indicated as the
most important by the sloppy/stiff method, while in
the ranking based on sensitivity function parameter
c
3a
seems to be more important. To check which of
these two parameters has greater influence on the
system response, we performed three simulations: 1)
for nominal parameter values, 2) for parameter k
v
increased by 30% and 3) for parameter c
3a
increased
by 30%. The results of these three simulations are
shown in Figure 5. By comparing these three time
courses, we can see that parameter k
v
significantly
increases the maximum concentration of free nuclear
NF-κB and in this term the ranking based on
sloppy/stiff method seems to be more reliable.
However, changing the parameter c
3a
results in phase
shift in system response, what in biological systems
can also be very important.
Table 1: Reaction list for the HSF/NF-кB pathways model (Smieja et al., 2015).
NF-кB subsystem HSF subsystem
IKKn
⎯⎯→⎯
deg
k
Ø
IKKn
⎯⎯⎯⎯→⎯
1
nTRAF2,TNF,
IKKa
IKKa
⎯⎯⎯⎯→⎯
2
nTNF,A20,
IKKi
IKKa
⎯→⎯
3
n
IKKi
IKKa
⎯⎯→⎯
deg
k
Ø
IKKi
⎯⎯→⎯
deg
k
Ø
NF-κB
nuc
⎯→⎯
1
c
NF-κB
nuc
+ A20
t
A20
t
⎯→⎯
4c
A20
t
+ A20
A20
⎯→⎯
5
c
Ø
A20
t
⎯→⎯
3c
Ø
IKKa + IκBα
⎯→⎯
2
a
IKKa:IκBα
IKKa:IκBα
⎯→⎯
d3
k
IKKa
IκBα
⎯→⎯
5a
c
Ø
IκBα
t
⎯→⎯
3a
c
Ø
NF-κB + IκBα
⎯→⎯
1
a
NF-κB:IκBα
NF-κB:IκBα
⎯→⎯
6a
c
Ø
IKKa + NF-κB:IκBα
⎯→⎯
3a
IKKa:NF-κB:IκBα
IKKa:NF-κB:IκBα
⎯→⎯
d4
k
IKKa + NF-κB
NF-κB
⎯⎯→⎯
1v
,k i
NF-κB
nuc
NF-κB
nuc
+ IκBα
nuc
⎯→⎯
1
a
NF-κB
nuc
:IκBα
nuc
NF-κB
nuc
:IκBα
nuc
⎯→⎯
2a
e
NF-κB:IκBα
NF-κB
nuc
⎯→⎯
1a
c
NF-κB
nuc
+ IκBα
t
IκBα
t
⎯→⎯
4a
c
IκBα
t
+ IκBα
IκBα
⎯⎯→⎯
1v
,k i
IκBα
nuc
IκBα
nuc
⎯→⎯
1a
e
IκBα
Prot
⎯⎯→⎯
5
k T,
mfProt
mfProt + HSP
cons
⎯→⎯
1
k
HSP
cons
:mfProt
mfProt + HSP
ind
⎯→⎯
1
k
HSP
ind
:mfProt
HSP
cons
:mfProt
⎯⎯→⎯
−1
k a,
HSP
cons
+ Prot
HSP
ind
:mfProt
⎯⎯→⎯
−1
k a,
HSP
ind
+ Prot
HSP
cons
+ HSF
⎯→⎯
3
k
HSP
cons
:HSF
HSP
ind
+ HSF
⎯→⎯
2
k
HSP
ind
:HSF
HSP
ind
:HSF
⎯→⎯
-2
k
HSP
ind
+ HSF
HSP
cons
:HSF + mfProt
⎯→⎯
-3
k
HSP
cons
:mfProt + HSF
3HSF
⎯→⎯
4
k
HSF
3
HSF3 + HSP
ind
⎯→⎯
-4
k
HSP
ind
:HSF + 2 HSF
HSP
ind
⎯→⎯
d2
k
Ø
HSPmRNA
⎯→⎯
d1
k
Ø
HSF
3
⎯→⎯
tr
k
HSF
3
+ mRNA
HSPmRNA
⎯→⎯
tl
k
HSPmRNA + HSP
ind
HSF
cons
+ IKKa
⎯→⎯
6
k
HSP
cons
:IKK
HSF
ind
+ IKKa
⎯→⎯
6
k
HSP
ind
:IKK
HSP
cons
:IKK
⎯→⎯
-6
k
HSP
cons
+ IKKn
HSP
ind
:IKK
⎯→⎯
-6
k
HSP
ind
+ IKKn
TRAF
⎯⎯⎯→⎯
TRAF5
k T,
mf TRAF
mf TRAF2 + HSP
cons
⎯⎯→⎯
TRAF1
k
HSP
cons
:mf TRAF2
mf TRAF2 + HSP
ind
⎯⎯→⎯
TRAF1
k
HSP
ind
:mf TRAF2
HSP
cons
:mf TRAF2
⎯⎯⎯→⎯
− TRAF1
k a,
HSP
cons
+ TRAF2
HSP
ind
:mf TRAF2
⎯⎯⎯→⎯
− TRAF1
k a,
HSP
ind
+ TRAF2
HSF
3 cyt
⎯⎯→⎯
1iv
t,k
HSF
3 nuc
HSF
3 nuc
⎯→⎯
1e
t
HSF
3 cyt
HSP
cons,cyt
⎯⎯→⎯
2iv
t,k
HSP
cons,nuc
HSP
cons,nuc
⎯→⎯
2e
t
HSP
cons,cyt
HSP
ind,cyt
⎯⎯→⎯
3iv
t,k
HSP
ind,nuc
HSP
ind,nuc
⎯→⎯
3e
t
HSP
ind,cyt
Sloppy/Stiff Parameters Rankings in Sensitivity Analysis of Signaling Pathways
281
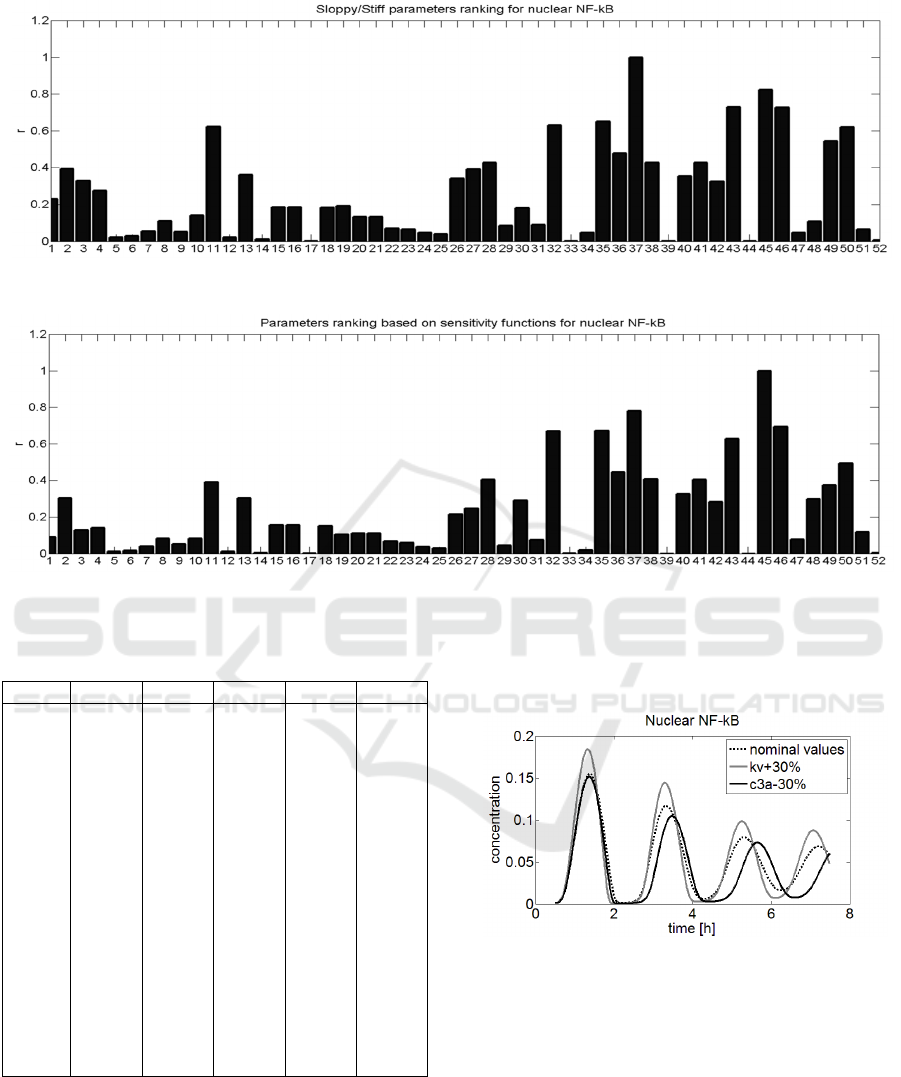
Figure 3: Parameter ranking based on sloppy/stiff method.
Figure 4: Parameter ranking based on sensitivity functions.
Table 2: List of parameters in the HSF/NF-кB pathways
model (Smieja et al., 2015).
No. Name No. Name No. Name
1
2
3
4
5
6
7
8
9
10
11
12
13
14
15
16
17
18
k
1
k
-1
k
1TRAF
k
-1TRAF
k
2
k
-2
k
3
k
-3
k
4
k
-4
k
5
k
5TRAF
k
6
k
-6
k
tr
k
tl
a
k
d1
19
20
21
22
23
24
25
26
27
28
29
30
31
32
33
34
35
k
d2
t
1i
t
1e
t
2i
t
2e
t
3i
t
3e
t
4
n
1
n
2
n
3
a
1
a
2
a
3
k
d3
k
d4
k
prod
36
37
38
39
40
41
42
43
44
45
46
47
48
49
50
51
52
k
deg
k
v
c
1
c
2
c
3
c
4
c
5
c
1a
c
2a
c
3a
c
4a
c
5a
c
6a
i
1
i
1a
e
1a
e
2a
It should be noted that contrary to standard
rankings based on sensitivity function, the proposed
ranking reflects the influence of parameter changes
on the system output, not only in the case when a
single parameter is varied but also when it changes
together with other ones. However, computational
complexity is the same as for calculating sensitivity
functions. The variance-based approaches (e.g.
Sobol, 2001), would require much more
computational power.
Figure 5: The comparison of three simulation runs:1) for
nominal parameter values (dotted line), 2) for parameter k
v
increased by 30% (gray line) and 3) for parameter c
3a
increased by 30% (black line).
4 CONCLUSIONS
Parameters rankings are a useful tool that allows us
to indicate parameters that are most important for
the dynamics of a given pathway. In this paper we
presented a new method for creating the parameters
ranking based on the popular sloppy/stiff parameter
BIOINFORMATICS 2016 - 7th International Conference on Bioinformatics Models, Methods and Algorithms
282

sensitivity analysis. Taking into account the example
presented in this work we showed that the method
can provide valuable information about the most
important parameters that have the greatest impact
on the system output.
Moreover, the work shows that the parameters
rankings for the same model may vary depending on
the applied methodologies. Various parameters
rankings may be sensitive to various changes in
response (e.g. quantitative or qualitative changes).
For this reason the choice of sensitivity analysis
method must be adapted to the purpose of research
and the type of model we investigate. Furthermore it
is a good practice to examine the sensitivity of the
system using various methods and compare the
results.
ACKNOWLEDGEMENTS
The work has been supported by the NCN grants
DEC-2013/11/B/ST7/01713 (MKardynska, JS) and
DEC-2012/05/B/NZ2/01618 (AN, PJ, PW,
MKimmel).
REFERENCES
Locke J.C.W., Southern M.M., Kozma-Bognar L.,
Hibberd V., Brown P.E., Turner M.S., and Millar A.J.,
(2005) Extension of a genetic network model by
iterative experimentation and mathematical analysis,
MolSystBiol 1, 0013.
Voit E., Neves A.R., and Santos H. (2006) The intricate
side of systems biology, PNAS 103, 9452–9457.
Maerkl S.J. and Quake S.R., (2007) A systems approach to
measuring the binding energy landscapes of
transcription factors, Science 315, 233–237.
Rand D.A., (2008) Mapping the global sensitivity of
cellular network dynamics, J. Royal Society Interface
5, 59–69.
Gutenkunst R.N., Watefall J.J., Casey F.P., Brown K.S.,
Myers C.R., and Sethna J.P., (2007) Universally
sloppy parameter sensitivities in systems biology
models, PLoS Computational Biology 3, 1871–1878.
Kim K.A., Spencer S.L., Albeck J.G., Burke J.M., Sorger
P.K., Gaudet S., and Kim H., (2010) Systematic
calibration of a cell signaling network model, BMC
Bioinformatics 11, 202.
Marin-Sanguino A., Gupta S.K., Voit E.O., and Vera J.,
(2011) Biochemical pathway modeling tools for drug
target detection in cancer and other complex diseases,
Methods in Enzymology 487, 319–369.
Smieja J., Kardynska M., Naumowicz A., Janus P.,
Widlak P., Kimmel M., (2015) In Silico Analysis of
Interactions Between NFkB and HSF Pathways,
Proceedings of the International Conference on
Bioinformatics Models, Methods and Algorithms,
Oscar Pastor, Christine Sinoquet, Ana Fred, Hugo
Gamboa and Dirk Elias (eds.), Lisbon, Portugal, 201-
206.
Cataldi A., Rapino M., Centurione L., Sabatini N., Grifone
G., Garaci F., Rana R., (2003) NF-κB activation plays
an antiapoptotic role in human leukemic K562 cells
exposed to ionizing radiation, Journal of Cellular
Biochemistry 89, 956–963.
Hayden, M.S., and Ghosh, S. (2012) NF-κB, the first
quarter-century: remarkable progress and outstanding
questions. Genes Dev. 26, 203–234.
Perkins, N.D. (2012) The diverse and complex roles of
NF-κB subunits in cancer. Nat. Rev. Cancer 12, 121–
132.
Janus P., Pakula-Cis M., Kalinowska-Herok M., Kashchak
N., Szołtysek K., Pigłowski W., Widlak W., Kimmel
M., Widlak P., (2011) NF-kB signalling pathway is
inhibited by heat shock independently of active
transcription factor HSF1 and increased levels of
inducible heat shock proteins, Genes to Cells 16,
1168–1175.
Lipniacki T., Paszek P., Brasier A.R., Luxon B., Kimmel
M., (2004) Mathematical model of NF-κB regulatory
module, J TheorBiol 228, 195–215.
Szymańska Z., Zylicz M., (2009) Mathematical modelling
of heat shock protein synthesis in response to
temperature change, J TheorBiol 259, 562–569.
Sobol I., (2001) Global sensitivity indices for nonlinear
mathematical models and their Monte Carlo estimates,
MathComp Sim, 55, 271-280.
Sloppy/Stiff Parameters Rankings in Sensitivity Analysis of Signaling Pathways
283
