
Internet Streaming and Network Neutrality:
Comparing the Performance of Video Hosting Services
Alessio Botta
1,2
, Aniello Avallone
1
, Mauro Garofalo
1
and Giorgio Ventre
1
1
University of Napoli Federico II, Napoli, Italy
2
NM2 srl, Napoli, Italy
Keywords:
Network Neutrality, Internet Video Streaming, Network Performance.
Abstract:
Network neutrality is a hot topic since a few years and involves different aspects of interest (e.g. economic,
regulatory and privacy) for a wide range of stakeholders, including policy makers, researchers, economists,
and service providers. When referring to video streaming, a killer web service of the Internet, much has been
discussed regarding if and how video providers violate or may violate neutrality principles, in order to give
users a “better” service compared to other services or to other providers. In this paper we provide a contribution
to this discussion analyzing the performance of three main video hosting providers (i.e. YouTube, Vimeo, and
Dailymotion) from an user viewpoint. We measure the throughput and RTT experienced by users watching
real videos of different popularity, at different day hours and at several locations from around the world. We
uncover the performance differences of these providers as a function of the different variables under control
and move a step forward to understand what causes such differences. Our results allow to understand what are
the real performance users currently get from these providers and if the performance differences observed can
be due or to considered as a violation of network neutrality principles, providing a ground for people interested
in legal and regulatory issues of web applications and services.
1 INTRODUCTION
There is a long ongoing debate on network neutral-
ity, for which several definitions exist which share
the common idea that data on the Internet should be
treated in the same way despite several its character-
istics such as technology, device, application, service,
user, provider, and country they come from or go to.
A first debate about network neutrality in terms of In-
ternet traffic management policies appeared in 2003
(Wu, 2003), but concerns about possible threats to the
end-to-end nature of the Internet raised already in the
late 1990s (Lemley and Lessig, 2000). Nowadays the
debate has gained momentum also because of recent
events such as the one involving the provider Com-
cast, which was slowing uploads from peer-to-peer
file sharing applications (Svensson, 2007). The dis-
cussion on whether the Internet should be fully neu-
tral, or rather the providers should be allowed to use
techniques to differentiate the traffic don’t concerns
just economic but increasingly both legal and regula-
tory aspects. A work regarding law aspects was pre-
sented in (Koops and Sluijs). In this paper we do
not want to take a position pro or against network
neutrality. We rather aim at providing a contribu-
tion to understand the current situation from a user
viewpoint, which is of interest for people concerned
with legal and regulatory issues of web applications
and services. Our work focuses on three Video Host-
ing Services, YouTube, Vimeo and Dailymotion, for
which we studied the performance achievable by end
users depending on video popularity and user loca-
tion (i.e. country). The highlights of our work could
be summarized as follow:
• We introduce a methodology that, regardless of
the providers considered in this work, allows ac-
quiring and analyzing performance statistics.
• We measure, analyze, and compare statistics pro-
vided by YouTube, Vimeo, and Dailymotion,
from several locations all around the world.
• We provide insights on geographical location of
the infrastructures and routing policies used by the
video hosting services to deliver their content.
The reminder of the paper is structured as follows.
Related Work is reviewed in the next section, which
also highlights the novel aspects of this work. Knowl-
edge on infrastructure of video hosting services is
514
Botta, A., Avallone, A., Garofalo, M. and ventre, G.
Internet Streaming and Network Neutrality: Comparing the Performance of Video Hosting Services.
DOI: 10.5220/0005798705140521
In Proceedings of the 2nd International Conference on Information Systems Security and Privacy (ICISSP 2016), pages 514-521
ISBN: 978-989-758-167-0
Copyright
c
2016 by SCITEPRESS – Science and Technology Publications, Lda. All rights reserved

given in Section 3. In Section 4, we present our
methodology, and how we collected the dataset. Sec-
tion 5 describes in detail the results and it is followed
by a discussing about geographical location in Section
6. We conclude the paper in Section 7.
2 RELATED WORK
Several interesting works on analysis of video host-
ing services are focused on YouTube only, since it
generates a large share of Internet traffic. The first
extensive data-driven analysis about video popular-
ity and users behavior of YouTube was presented in
2007, (Cha et al., 2007). Data collection involves a
very long time period (tens of years) and furthermore
compares YouTube with classic on demand video
providers such as Netflix and Yahoo! Movies. A tool
to measure QoS and QoE of YouTube is designed in
2012, (Plissonneau et al., 2012). Metrics collected by
a hundred of volunteers, have been analyzed by au-
thors to infer the main delivery policies of YouTube
videos, to understand the impact of the ISP on these
policies, and finally YouTube policies are compared
in the US and Europe. One of the earliest analysis
of HTTP video streaming with a comparison between
YouTube and one of its competitors Dailymotion was
presented in 2012, (Plissonneau and Biersack, 2012).
They use packet traces from a residential ISP network
to infer for each streaming flow the video character-
istics, such as duration and encoding rate, as well as
TCP flow characteristics, such as RTT and packet loss
rate. More focused on geographical location of in-
frastructure, (Padmanabhan and Subramanian, 2001)
has built a service to translate the IP addresses of In-
ternet hosts into their geographical location. They
have proposed three techniques to infer the location
of target host. GeoTrack, based on information pro-
vided by DNS. GeoPing, using delay measurements
between target host and geographically known loca-
tion, and GeoCluster, that combines partial host-to-
location mapping information and BGP prefix. A re-
cent work, (Calder et al., 2013), try to clustering all
servers of Google infrastructure in serving-site and
then localize them using a technique called Client-
Centric Geolocation or CCG. The CCG is based on
the hypothesis that clients that are directed to the
server are likely to be topologically, and probably ge-
ographically, close to the server.
Summarizing, studies more relevant to our work in-
vestigated either the CDN infrastructure and perfor-
mance measures, or the geographic location of such
infrastructure. Our work moves a step forward with
respect to existing literature. To the best of our knowl-
edge, we are the first to provide a comparative anal-
ysis of the three most popular video hosting services,
YouTube, Vimeo, and Dailymotion. We uncover the
different performance they provide to real users from
around the world and investigate on the causes of such
differences, providing insights on the infrastructure
each of them uses for video delivery. Unlike works
based on residential ISPs measurements, that involve
a large number of volunteers, we perform active mea-
surements using a globally distributed research infras-
tructure (i.e. (Chun et al., 2003)). Performance indi-
cators collected may be different from the ones of res-
idential users. However, our main aim of comparing
the different services (to understand if and how they
violate or may violate network neutrality principles)
is not affected by this choice.
3 INFRASTRUCTURES OF
PROVIDERS
The following section describes the infrastructure of
the video hosting services analyzed. Although there
are several studies focused on YouTube (Google) in-
frastructure (e.g. (Calder et al., 2013)), that try to
identify the number, structure, and location of caches
and servers, less information is available on the other
providers. Usually, the information about these in-
frastructures is not publicly disclosed. We crossed
several sources of information for obtaining the views
on the infrastructures that follow. Then we verify and
confirm the accuracy of such views with the experi-
ments in Section 6.
3.1 Dailymotion
Dailymotion was launched in France in 2005. Orig-
inally it consist of one homemade Linux cluster and
limited connectivity via a classical Internet connec-
tion able to serve only a few thousand users (Pelaprat,
2007), (EMC2, 2010). Afterwards it moved to a
more scalable architecture for storage and simultane-
ously read/write on a network file system where In-
put/Output bandwidth, caching and latency are shared
throughout the system and performance scales lin-
early with the numbers of nodes. Dailymotion has
not entered into agreements with any third party CDN
but, starting 2014, it has chosen Orange as partner for
the optimization of worldwide distribution of video
content, as part of its launch of premium live stream-
ing “channels” (Orange, 2014). A solution, called
“Media Delivery”, that uses an extensive network of
servers to accelerate the distribution of video content
over the Internet, was implemented by Orange and
Internet Streaming and Network Neutrality: Comparing the Performance of Video Hosting Services
515

Akamai Technologies(Akamai, 2014a). At present
Dailymotion provides an “only for premium services
platform” while standard users are connected to the
origin data center, with a data discrimination based
on content.
3.2 Vimeo
Vimeo, founded in 2004, to distribute its content uses
the Akamai CDN (Vimeo, 2013). Akamai had a
broadly deployed network of edge servers, with 20
to over 100 times more Points of Presence (POPs)
than other global CDN providers (Akamai, 2014c).
Its edge servers are located deep within thousands
of ISPs networks, as close as possible to the users,
through the partnerships with the leading Internet ser-
vice providers. They claim to providing lowest la-
tency, high throughput and low risk of network con-
gestion. Akamai provide a CDN dedicated to the
streaming media content deployment, named Adap-
tive Media Delivery (Akamai, 2014a). It allows the
transmission of video streams with Adaptive Bit Rate
and back up it in Akamai NetStorage, for later view-
ing (Akamai, 2014b). Akamai has also developed a
modified version of TCP/IP to optimize the transmis-
sion speed. This protocol called Fast TCP uses the
delay as a measure to control network congestion and
improve the throughput. The beneficial use of this
protocol are exploited by the CDN in the accelera-
tion of both video distribution and download (Aka-
mai, 2012).
3.3 YouTube
YouTube born in 2005, was bought by Google in
2006. It is the most popular service on which users
can share and watch video content. The infrastructure
can be organized in the following components:
• Data Center: a set of high-efficiency Backend
servers used for computation and storage.
• Edge Points of Presence (POPs): cache servers
distributed worldwide,(Google, 2015). PoPs rep-
resent the terminal nodes of Google network
and are connected via peering with ISPs to
deliver Google services traffic to users. The
caches are identified by Google in four logi-
cal namespace and PoPs are classified based
on a three level hierarchy. Primary cache
cluster: a
c.v[1-24].lscache[1-8].c.youtube.com,
where “a c” matches the IATA airport code
(IATA, 2010). Secondary cache cluster: tc.v[1-
24].cache[1-8].c.youtube.com. Tertiary cache
cluster few number of cluster named as cache or
altcache.
• Backbone: a global fiber network to interconnect
data centers and deliver traffic to Edge PoPs.
• Google’s edge caching the whole cache infras-
tructure including nodes inside the ISPs. These
nodes (PoP) are calling Google Global Cache
(GGC) (Calder et al., 2013) and allow ISPs to de-
liver Google contents to the users, increasing per-
formance and reducing transportation costs being
more close to each other.
4 METHODOLOGY AND TOOLS
Scope of our work is to evaluate the performance of
video hosting services to understand whether such
performance differences could impact on network
neutrality and users privacy. We evaluate the perfor-
mance of video hosting service provider for different
kinds of content and different geographical location
to discover if: the providers have their own infrastruc-
ture in the country; there are cache-servers deployed
inside ISP infrastructures; special routing policies ex-
ist and how/when they are applied. The web service
under test are YouTube, Vimeo, and Dailymotion. We
analyze the traffic related to video downloads because
streaming video accounts the majority (about 60%) of
Internet traffic (Cisco, 2015). We have defined four
categories of videos depending on popularity: less
than 500 views, between 10k and 120k views, be-
tween 120k and 1M views, and over a million views.
We have chosen one video with a 720p resolution
for each category. Every experimental campaign is
performed over a period of one day (24 hours) and
downloads are carried out at intervals of two hours.
The data acquisition phase of our analysis lasted 15 of
weeks in a period of time that covers several months.
Data reported in the following section refers to one
of these campaigns. Results of the other campaigns
showed similar results. As set of geographically well
know clients we used a distributed network of 200
PlanetLab nodes, deployed on a total of 36 countries.
PlanetLab uses high speed networks inside Research
Centers and Universities therefore the analysis cannot
strictly describe behavior of residential users. How-
ever, our aim is to compare the performance of dif-
ferent providers and we use PlanetLab as a reference.
More in depth, for each PlanetLab node we perform
the following batch operations to acquire the data:
• Running netstat in background. This command
is used to detect the IPv4 address of server that
physically contain the video to which the client
has been addressed by DNS.
• Using youtube-dl to download the video. This
ICISSP 2016 - 2nd International Conference on Information Systems Security and Privacy
516

command is used to estimates the throughput.
• Given the IPv4 address of server that physically
contains the video, running a ping to evaluate RTT
and TTL.
• Using traceroute tool to discover the path from
client to server and mapping the name of routers
in the path.
We assume that the measures of RTT and TTL,
as well as the path shown by traceroute, could be
in a good approximation representative of the net-
work status during the video downloads. Video
providers can adopt various approaches to cope the
fragmentation of terminals and network connection
issues. Adaptive bitrate streaming (ABS) is one of
the widespread technique that adapt the bitrate in re-
sponse to changing bandwidth conditions. Among
the providers under test, only Vimeo does not uses
a web player that supports ABS for video delivery.
So, even if youtube-dl support DASH (Lederer et al.,
2012) and HLS (Pantos and May, 2015), two spread
ABS standard implementation, we have performed
video download without taking advantage of these
new techniques in order to compare the providers at
conditions that are as similar as possible to each other.
5 EVALUATION
In the following section we analyze three video host-
ing services, Dailymotion, Vimeo, and YouTube,
evaluating performance indicators (i.e. throughput,
RTT, and distance in hops) related to users download-
ing videos of different popularity from several loca-
tions all around the world.
0
5000
10000
15000
20000
25000
30000
35000
40000
dm-1M
dm-120K
dm-10K
dm-500
vi-1M
vi-120K
vi-10K
vi-500
yt-1M
yt-120K
yt-10K
yt-500
KiB/s
Stat
Median
Mean
Figure 1: Throughput - Comparison among Dailymotion,
Vimeo and YouTube.
-200
-100
0
100
200
300
400
500
600
dm-1M
dm-120K
dm-10K
dm-500
KiB/s
Stat
Median
Mean
Figure 2: Throughput - Dailymotion Zoom.
Table 1: Throughput (KiB/s) - Statistical Indicators.
Provider-Class Min I Quart. Median Average III Quart. Max
dm-1M 21.36 353.8 415.1 487.1 502.4 11570
dm-120K 21.18 351.9 401.9 467.4 475.0 12690
dm-10K 24.10 344.1 378.5 421.8 419.9 8354
dm-500 6.752 354.6 402.7 474.2 471.6 9368
vi-1M 24.44 1788 5367 6944 9802 35010
vi-120K 18.63 1770 4992 6619 9000 34790
vi-10K 17.45 1976 6110 7806 10310 39000
vi-500 29.05 2144 6226 7894 10300 38830
yt-1M 11.79 1228 4408 5698 8235 23300
yt-120K 33.83 1153 4156 5930 8465 34690
yt-10K 32.3 1124 4014 5801 8617 34900
yt-500 14.06 1565 5025 6793 9034 31760
5.0.1 Throughput
Figure 1 depicts the values of throughput recorded
by clients for each provider and each video cate-
gory. Dailymotion (dm-*) has the lowest values
while Vimeo (vi-*) and YouTube (yt-*) have similar
throughput. The statistical indicators of throughput
(i.e. minimum, first quartile, median, average, third
quartile, and maximum) refer to all providers are are
shown in detail in Table 1. Dailymotion has a median
value around 400 KiB/s while most of clients do not
exceed 500 KiB/s. Spikes affect the throughput av-
erage and these values are related to “anomaly” that
we will show more in depth in the following. Vimeo
and YouTube have similar trends although Vimeo has
higher throughputfor each video category as shownin
table 1. Also in these cases, the averages are affected
by spikes which significantly differ from the median.
Regarding Vimeo, throughput of 320 Mbps and RTT
of 0.140 ms are shown. These spikes are related to
PlanetLab nodes who are only one “hop” away from
Vimeo servers. A brief discussion about these values
will be provided in the following.
5.0.2 Round Trip Time
The performance of providers concerning the delay
Internet Streaming and Network Neutrality: Comparing the Performance of Video Hosting Services
517

0
200
400
600
800
1000
1200
1400
1600
dm-1M
dm-120K
dm-10K
dm-500
vi-1M
vi-120K
vi-10K
vi-500
yt-1M
yt-120K
yt-10K
yt-500
ms
Stat
Median
Mean
Figure 3: RTT.
(i.e. RTT) are shown in Figure 3. RTT values regard-
ing Dailymotion varying from 40 ms to 150 ms with
a median value of 100 ms. These values are always
higher in comparison to its competitors. This could
be related to the centralized nature of Dailymotion
infrastructure, Section 3.1. Regarding Vimeo, there
is a small range of variation, from 2 ms to 18 ms,
and the minimum values are very low independently
of video categories. An extremely low RTT value,
about 0.14 ms, has been recorded by PlanetLab node
planetlab1.arizona-gigapop.net,located in the United
States. A distributed infrastructure, like Akamai CDN
Section 3, allows to obtain better performance both in
terms of Throughput and RTT, regardless the country
from which the client requests the content. YouTube
have an analogue behavior, whose servers show RTT
values similar to those of Vimeo although on a wider
range (from 2 ms to 30 ms).
Table 2: RTT(ms) - Statistical Indicators.
Provider-Class Min I Quart. Median Average III Quart. Max
dm-1M 3.375 44.29 103.1 117.4 152.4 1013.0
dm-120K 3.568 44.95 103.7 116.2 149.8 1547.0
dm-10K 3.516 43.12 102.4 114.6 150.8 697.5
dm-500 3.42 45.35 102.1 116.0 150.9 473.4
vi-1M 0.135 2.378 6.738 16.91 16.72 421.1
vi-120K 0.141 2.500 7.183 17.45 18.33 405.1
vi-10K 0.139 1.887 5.698 14.28 15.21 473.7
vi-500 0.142 1.914 5.839 14.54 15.00 358.9
yt-1M 0.223 2.550 7.312 31.17 23.53 510.8
yt-120K 0.208 2.869 7.623 32.08 27.90 492.3
yt-10K 0.241 3.214 7.751 32.09 29.59 420.9
yt-500 0.205 2.405 6.935 28.92 19.58 488.5
5.1 Temporal Behaviour
In the following sections, we will point out how per-
formance evolve in time. This kind of analysis is
aimed at identifying differences of performance or
treatment for the different hours of day.
Figure 4 shows a whole day comparison between
the throughput of providers, related to the video cat-
egories. Regarding Dailymotion, Figure 4(a), there
are no particular treatments related to the different
video categories. Moreover the average of throughput
evolves in a nearly constant way. Standard deviation
value highlights spikes at 8h and 12h. They refer to
servers deployed in Korea and Singapore. They let
us suppose the presence of servers in these countries,
contrary to the assumptions made in the in Section
3. A further investigation to understand the perfor-
mance of PlanetLab nodes in these countries is left as
future work. The overlapping of the temporal evolu-
tion of the mean values and the standard deviations
of throughput is shown in Figure 4(b) for Vimeo and
in Figure 4(c) for YouTube. The median values are
constantly above 5000 KB/s, an order of magnitude
higher than Dailymotion. Moreover, all providers
have better performance for videos with lower num-
ber of views.
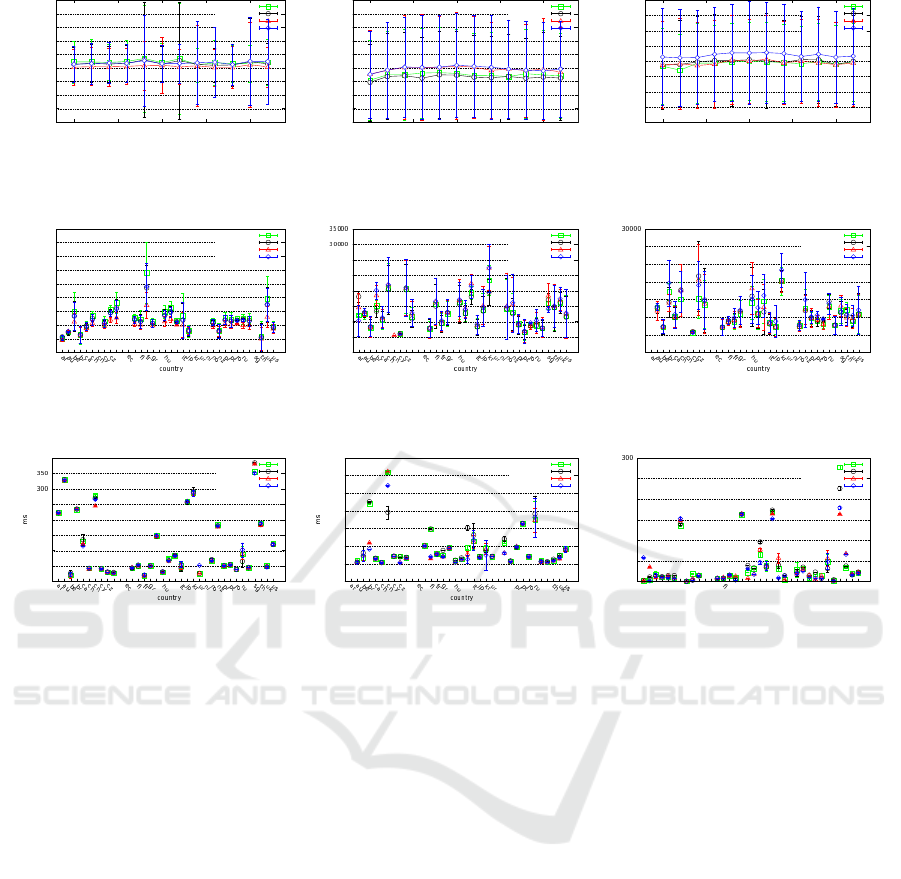
5.2 Performance by Country
This section will be shown the values of the perfor-
mance parameters according to the country of the
client. Data acquisition is performed over a period of
one day (24 hours) with tests carried out at intervals
of two hours.
Figure 5(a) shows the average throughput of each
video category in each country for Dailymotion.
The Figure depicts facts that support our hypothesis
about the centralized location of the all Dailymotion
servers: the performance is better in France than in
other countries; all European countries have higher
performance than non-European ones. We excluded
the values of Singapore and Korea (for Singapore the
maximum throughput is about 12000 KiB/s) other-
wise they would have made the graph unreadable. For
Vimeo, as we can see in Figure 5(b), the through-
put is variable in each country. Unlike Dailymotion,
these differences are not related to the distance be-
tween client and server, but to the quality of the net-
work in each country. Regarding the analysis of dif-
ferent video category, there is an overlap of the val-
ues of the average throughputin almost every country,
with higher values for the video below the 500 views,
denoting the presence of different treatments accord-
ing to the video category. Finally, Figure 5(c) shown
mean values and standard deviations of the through-
put of YouTube servers. Whereas the Google distri-
bution network is based on the concept of peering,
see Section 3, performance is strongly influenced by
the network infrastructure of the certain country. The
management through peering has led the CDN to de-
fine supply agreements with third-party companies, in
order to obtain the widest possible capillarity. The
ICISSP 2016 - 2nd International Conference on Information Systems Security and Privacy
518
-400
-200
0
200
400
600
800
1000
1200
1400
0 5 10 15 20
KiB/s
h
Video 1M
Video 120K
Video 10K
Video 500
(a) Dailymotion
0
2000
4000
6000
8000
10000
12000
14000
16000
18000
0 5 10 15 20
KiB/s
h
Video 1M
Video 120K
Video 10K
Video 500
(b) Vimeo
-2000
0
2000
4000
6000
8000
10000
12000
14000
0 5 10 15 20
KiB/s
h
Video 1M
Video 120K
Video 10K
Video 500
(c) YouTube
Figure 4: Average Throughput over 24h.
0
200
400
600
800
1000
1200
1400
1600
1800
de
dk
es
hk
ie
il
se
KiB/s
Video 1M
Video 120K
Video 10K
Video 500
(a) Dailymotion
-5000
0
5000
10000
15000
20000
25000
de
dk
es
hk
ie
il
se
KiB/s
Video 1M
Video 120K
Video 10K
Video 500
(b) Vimeo
-5000
0
5000
10000
15000
20000
25000
de
dk
es
hk
ie
il
se
KiB/s
Video 1M
Video 120K
Video 10K
Video 500
(c) YouTube
Figure 5: Average throughput in each country.
0
50
100
150
200
250
400
de
dk
es
hk
ie
il
se
Video 1M
Video 120K
Video 10K
Video 500
(a) Dailymotion
-20
0
20
40
60
80
100
120
de
dk
es
hk
ie
il
nl
no
nz
se
sg
Video 1M
Video 120K
Video 10K
Video 500
(b) Vimeo
0
50
100
150
200
250
ar
au
be
br
ca
ch
cn
cy
cz
de
dk
ec
es
fr
gr
hk
hu
ie
il
it
jp
kr
ur
nl
no
nz
pl
pt
ro
ru
se
sg
th
uk
us
ms
country
Video 1M
Video 120K
Video 10K
Video 500
(c) YouTube
Figure 6: Average RTT in each country.
comparison of mean values denotes variability related
to the country where surveys are carried out. As with
other providers, video with fewer views have perfor-
mance slightly better than others categories.
5.2.1 Round Trip Time
The average values and standard deviations of RTT,
regarding Dailymotion, are shown in Figure 6(a).The
overlap of the average values of RTT means that no
treatments to different category of video is applied.
The European countries have lower RTT than others
countries; in particular the average value is in most
cases below 50 ms while extra-European countries
have values always higher than 100 ms. Specifically,
Korea and Singapore RTTs are respectively 300 ms
and 350 ms. Using traceroute, we made an analysis
of the paths taken by packets traveling from the client
in Korea towards the provider’s server. First, pack-
ets pass by internal hops inside the network of the
Kookmin University (where are deployed the Planet-
Lab node), then they travel towards Lever 3 US and
Level 3 Paris and finally to the Dailymotion server.
The same analysis was repeated for the client in Sin-
gapore and results would confirm for Dailymotion the
hypothesis of a centralized infrastructure, Section 3.
Concerning the RTT value of Vimeo, shown in Fig-
ure 6(b), in almost all countries the values are similar
for each video category of video. We can therefore
assume that every client is routed to the same servers
that contains all videos. The RTT for the majority of
countries is smaller than 20 ms, which indicates that
the infrastructure of Akamai is effectively distributed.
Observing the average values of RTT shown in Figure
6(c), we can assert that YouTube, thanks to the CDN
created by Google, is globally distributed, bringing
the contents as close as possible to the client. How-
ever it can be noticed a high value of RTT for Asian
countries. Concerning China, the result can probably
be related to the censorship operations implemented
by the Government.
6 DISCUSSION
6.1 Geolocation IPv4 Servers
We apply the techniques described in Section 2 to ge-
ographically locate the servers of video hosting ser-
Internet Streaming and Network Neutrality: Comparing the Performance of Video Hosting Services
519

vices. We have compared the results obtained using
two different techniques: Geoping, based on the val-
ues of RTT measured in every country at each video
download, and Geotrack, which uses traceroute, that
provides the names and IPv4 addresses of the routers
through which the data flow travels from client to
server. Notice that traceroute does not always pro-
vide all the hops for the entire path. The whole op-
eration is affected by issues well known in literature,
for example: load balancing (Augustin et al., 2011),
anonymous routers (Gunes and Sarac, 2008), hidden
routers (Marchetta and Pescape, 2013), misleading in-
termediate delay (Marchetta et al., 2014), and third-
party addresses (Marchetta et al., 2013). For space
constraints we cannot provide all the results obtained.
However, it is possible to summarize the following
results for each providers:
• Dailymotion deploys its entire infrastructure in
France (i.e Paris), no other caches are distributed
elsewhere in the world. However, there are ab-
normal activities by some nodes as we already de-
scribe in the previous section.
• Vimeo has distributed cache-servers, uses the
Akamai infrastructure, and every time a video is
requested, the user is redirected to the “closer”
server. This is highlighted by the lower values
of the RTT and by the names of the servers con-
taining the video (owned by Akamai). The clients
are always re-directed to the same server, without
considering the day time or the network overload,
and only in case the content is not present in the
cache-server, the client is re-directed to the back-
end server.
• YouTube presents its own cache-servers in al-
most all the countries in which there are Plan-
etLab nodes used for testing. The infrastructure
fell within the Internet Exchange Point, in which
they connect to networks via peering to local
ISPs. Unlike Akamai, there is delivery strategy
that assesses both the “distance” between client
and server, and the “overload” of the network.
6.2 IPv4 Identification and Name-server
of the Providers
We used the reverse DNS in order to determine the
name-servers associated to the IPv4 of all the servers
contacted. From the list of name-servers conse-
quently obtained, we can say that:
• For Dailymotion, there are only 8 servers from
which clients, from all over the world, download
videos.
• For Vimeo, the servers from which the downloads
are predominantly made, are part of the network
of Akamai
1
.
• For YouTube, the servers are globally distributed,
but not always they belong to Google.
Sometimes name-server clearly identified server
as part of telecommunication or hosting companies,
such as Tiscali, Asianet Web, or Oneandone. Refer-
ring to the discussions on the Network Neutrality and
to the study of IPv4 and name-servers, there are evi-
dences of preferential treatments related to the video
categories. The different performance observed are
due to different infrastructures used by providers. An
interesting case is the Russia where nor CDN or third
party servers are present and all videos coming from
Sweden.
7 CONCLUSION
The aim of our study was to compare the performance
indicators of video hosting services, to understand
whether the performance differences could impact
network neutrality and users privacy. It is worth not-
ing that we do not want to determine whether neutral-
ity is good or not, but we want to evaluate the effect
of the performance differences from the user point of
view, which is of interest for people concerned with
legal and regulatory issues of web applications and
services. We proposed a methodology that, regard-
less the type of provider, allows to acquire and ana-
lyze performance data and qualitative considerations
about the infrastructure of the providers. To vali-
date the methodology, a comparison of the three video
hosting services (Dailymotion, Vimeo and YouTube)
was performed on basis of: performance indicators
(i.e. throughput, RTT and TTL), geography location
of the infrastructures, and routing policies used by the
video hosting services. Results show that Dailymo-
tion seems to have a centralized infrastructure. More-
over, its performance decays with the client’s distance
from infrastructure location. Vimeo and YouTube use
CDNs to deliver their contents, where the first showed
the best performance indicators compared to its com-
petitors. Both infrastructures are connected to the
PlanetLab nodes, used as client, often by only two
intermediate hops. We clearly showed that providers
that using distributed infrastructure are actually able
to reach better performance. Regarding network neu-
trality, no evidences of special treatment based on
video category have been collected. The highlighted
performance differences can be regarded as lack of
1
Server not part of Akamai were also noticed.
ICISSP 2016 - 2nd International Conference on Information Systems Security and Privacy
520

neutrality because all providers should be able to
benefit from the same conditions of distribution and
spread of their contents. However, such differences
are not due to different treatments of traffic, but rather
to different technology infrastructure. Deciding on
whether this is or not a neutrality violation is out of
the scope of this paper. We rather aimed at providing
the regulator with information about the current situ-
ation and performance of video hosting services over
the Internet.
ACKNOWLEDGEMENTS
This work is partially funded by the MIUR project art.
11 DM 593/2000 for NM2 srl.
REFERENCES
Akamai (2012). Improving online video quality and accel-
erating downloads. Accessed: 2015-11-09.
Akamai (2014a). Adaptive media delivery. Accessed:
2015-11-09.
Akamai (2014b). Download delivery. Accessed: 2015-11-
09.
Akamai (2014c). Video streaming services. Accessed:
2015-11-09.
Augustin, B., Friedman, T., and Teixeira, R. (2011). Mea-
suring multipath routing in the internet. Networking,
IEEE/ACM Transactions on, 19(3):830–840.
Calder, M., Fan, X., Hu, Z., Katz-Bassett, E., Heidemann,
J., and Govindan, R. (2013). Mapping the expansion
of google’s serving infrastructure. In Proceedings of
the 2013 Conference on Internet Measurement Con-
ference, IMC ’13, pages 313–326, New York, NY,
USA. ACM.
Cha, M., Kwak, H., Rodriguez, P., Ahn, Y.-y., and Moon,
S. (2007). I tube, you tube, everybody tubes: analyz-
ing the world’s largest user generated content video
system. Proc ACM Internet Measurement Conference
IMC San Diego CA October 2007, New York:1–14.
Chun, B.and Culler, D., Roscoe, T., Bavier, A., Peterson,
L., Wawrzoniak, M., and Bowman, M. (2003). Plan-
etlab: An overlay testbed for broad-coverage services.
SIGCOMM Comput. Commun. Rev., 33(3):3–12.
Cisco (2015). Cisco visual networking index: Forecast and
methodology, 20112016. Accessed: 2015-11-08.
EMC2 (2010). A breakthrough in web-based video content
sharing. Accessed: 2015-11-09.
Google (2015). Google peering & content delivery - content
delivery ecosystem. Accessed: 2015-11-08.
Gunes, M. and Sarac, K. (2008). Resolving anonymous
routers in internet topology measurement studies. In
INFOCOM 2008. The 27th Conference on Computer
Communications. IEEE.
IATA (2010). Iata airport code. Accessed: 2015-11-09.
Lederer, S., M¨uller, C., and Timmerer, C. (2012). Dynamic
adaptive streaming over http dataset. In Proceedings
of the 3rd Multimedia Systems Conference on - MM-
Sys ’12, number ISBN: 978-1-4503-0518-1, page 89,
New York, New York, USA. ACM Press.
Lemley, M. A. and Lessig, L. (2000). The end of end-to-
end: Preserving the architecture of the internet in the
broadband era. UCLA Law Review, 48.
Marchetta, P., Botta, A., Katz-Bassett, E., and Pescap, A.
(2014). Dissecting round trip time on the slow path
with a single packet. In Faloutsos, M. and Kuz-
manovic, A., editors, Passive and Active Measure-
ment, volume 8362 of Lecture Notes in Computer Sci-
ence, pages 88–97. Springer International Publishing.
Marchetta, P., de Donato, W., and Pescap, A. (2013). De-
tecting third-party addresses in traceroute traces with
ip timestamp option. In Roughan, M. and Chang,
R., editors, Passive and Active Measurement, volume
7799 of Lecture Notes in Computer Science, pages
21–30. Springer Berlin Heidelberg.
Marchetta, P. and Pescape, A. (2013). Drago: Detecting,
quantifying and locating hidden routers in traceroute
ip paths. In INFOCOM, 2013 Proceedings IEEE,
pages 3237–3242.
Orange (2014). Orange business services helps dailymo-
tion optimize live streaming for its partners. Accessed:
2015-11-09.
Padmanabhan, V. N. and Subramanian, L. (2001). An
investigation of geographic mapping techniques for
internet hosts. SIGCOMM Comput. Commun. Rev.,
31(4):173–185.
Pantos, R. and May, W. (2015). Http live streaming. Ac-
cessed: 2015-11-09.
Pelaprat, P. (2007). Dailymotion construit son infrastructure
sur un cluster. Accessed: 2015-11-09.
Plissonneau, L. and Biersack, E. (2012). A longitudinal
view of http video streaming performance. In Pro-
ceedings of the 3rd Multimedia Systems Conference,
MMSys ’12, pages 203–214, New York, NY, USA.
ACM.
Plissonneau, L., Biersack, E., and Juluri, P. (2012). Ana-
lyzing the impact of youtube delivery policies on user
experience. In Proceedings of the 24th International
Teletraffic Congress, ITC ’12, pages 28:1–28:8. Inter-
national Teletraffic Congress.
Svensson (2007). Comcast blocks some subscriber internet
traffic, ap testing shows. Accessed: 2015-11-05.
Vimeo (2013). Cdn usage. Accessed: 2015-11-09.
Wu, T. (2003). Network neutrality, broadband discrimina-
tion. Journal of Telecommunications and High Tech-
nology Law, 2:141.
Internet Streaming and Network Neutrality: Comparing the Performance of Video Hosting Services
521
