Resolution-aware Slicing of CAD Data for 3D
Isidore Onyeako and Won-sook Lee
School of Electrical Engineering and Computer Science, University of Ottawa, Ontario, Canada
Keywords: Additive Manufacturing (AM), Layered Manufacturing (LM), 3D Printing, Computer Aided Design, Fused
Filament Fabrication (FFF), Fused Deposition Modelling (FDM), Electron Beam Freeform Fabrication
(EBFF), Electron Beam Melting (EBM), Magnetic Resonance Imaging (MRI), Computer Tomography
(CT), Rapid Prototyping (RP), Stereolithography (SLA).
Abstract: Low resolution printing results in fused joints when the joint clearance is intended to be very small. Various
3D printers are capable of print resolutions of up to 600dpi (dots per inch) as quoted in their datasheets. It is
imperative to include the ability of a 3D slicing application, to validate 3D models, based on the ability of
the printer to properly produce the features with the smallest detail in a model. A way to perform this
validation would be the physical measurement of printed parts and comparison to expected results. Our
method uses ray casting to detect features in the 3D models whose sizes are below the minimum allowed by
the printer resolution. Our model was tested using few simple and complex 3D models. Areas in the slices
with thickness less than the specified resolution were detected. Our model serves two purposes: (a) to assist
CAD model designers in developing models whose printability is assured- by warning or preventing shape
operations that will lead to regions/features with sizes lower than that of the printer resolution; (b) to
validate slicing outputs to identify regions/features with sizes lower than the printer resolution. This makes
our model very powerful in the quality assurance of 3D printing and a huge cost/time saver when planning
for 3D printing.
1 INTRODUCTION
When 3D printing equipment manufacturers quote
their printer resolutions, this information can serve
as an input into a model to validate that the
applicable printer will be able to produce critical
features in the model of interest. The potential cost
and time savings, gained by ensuring that CAD
designers avoid features smaller than the printer
resolutions, is quite significant.
1.1 Basic 3D Printing Process
3D printing (3DP) or rapid prototyping (RP) is an
additive manufacturing process that involves the
production of physical objects by adding thin
successive layers of materials without using moulds
(Munir, 2013). The models being printed can be
obtained via image acquisition from mobile scanners
(Stamos, I., Allen, P., 2000), Magnetic Resonance
Imaging (MRI), Computed Tomography (CT),
positron emission tomography, direct 3D CAD
models. This enhances the rapid prototyping process
as the technology is capable of producing a near-net-
shaped and multi-coloured part. 3D printing is also
referred to as Layered Manufacturing (LM) (Munir,
2013)
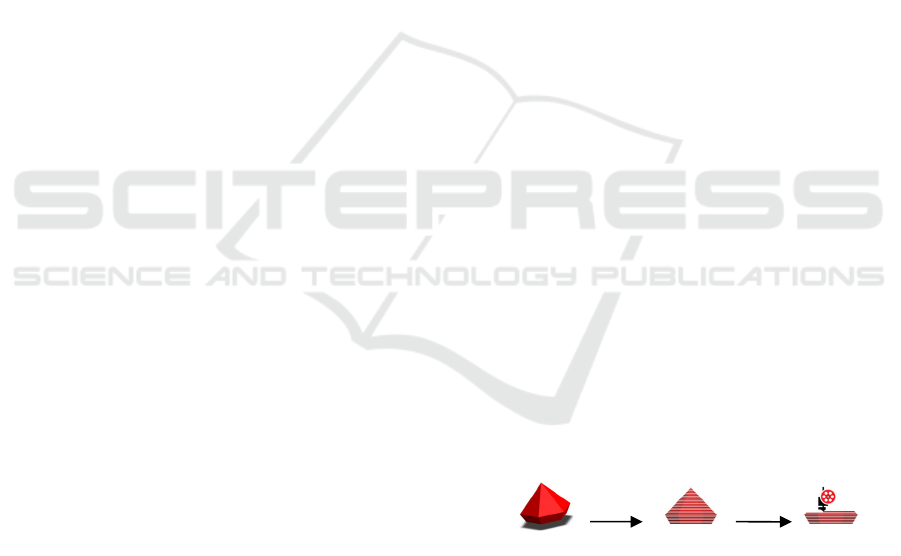
The 3D printing process (Figure 1) starts with a
CAD data model generation. The data is “sliced”
into successive layers. A slice is a collection of
contours to be filled during printing.
Create CAD Slice CAD Print model
Figure 1: 3D Basic Printing Workflow (Topcu, O.,
Tascioglu, Y., Unver, H. O. 2011).
1.2 Slicing and 3D Printing Quality
Assurance
The process planning of additive manufacturing, as
shown in Figure 1, begins with the creation of the
CAD model. This can be done with any of the
popular 3D applications. It can also be obtained
from 3D medical imaging data.
124
Onyeako, I. and Lee, W-s.
Resolution-aware Slicing of CAD Data for 3D.
DOI: 10.5220/0005784701220127
In Proceedings of the 11th Joint Conference on Computer Vision, Imaging and Computer Graphics Theory and Applications (VISIGRAPP 2016) - Volume 1: GRAPP, pages 124-129
ISBN: 978-989-758-175-5
Copyright
c
2016 by SCITEPRESS – Science and Technology Publications, Lda. All rights reserved

Figure 2: Standard Tessellation Language (STL) File and
CAD model.
The next step in the 3D printing workflow is the
creation of the slicing output. O. Topcu, Y.
Tascioglu and H.O Unver (Topcu, O., Tascioglu, Y.,
Unver, H. O. 2011) presented a method for slicing
CAD Models for the purpose of developing G-
Codes. This involves the cutting of the triangulation
surfaces (facets) into shapes with heights equal to
that of the slice thickness. These lines are then
joined to form contours which are used for tool path
data generation (G-Codes). There is presently no
industrial or formal specification for slice data.
Figure 3: (a) Tessellated cube with 12 facets (b) a sliced
cube (Topcu, O., Tascioglu, Y., Unver, H. O. 2011).
An algorithm for slicing 3D models, developed
by Topcu et al, uses STL file as input. In Figure
3(a), the cube is tessellated into 12 triangles in the
STL. The cube is cut into slices in Figure 3(b). The
goal of the slicing algorithm is to produce contours
for generation of G-Code. If the slicing thickness (t)
is larger, the likelihood of facets falling in between
the slices increases. This will make those facets not
to be sliced. To avoid this, the thickness of the slices
is reduced. This gap between adjacent slices defines
the layer thickness. The layer thickness is a variable
in the slicing algorithm.
(Baumann F. Et al, 2015) proposed a framework
for achieving a comparable quality assessment of
both slicing tools for FDM printers and FDM
printers themselves. The framework chose few
popular slicing tools based on their reliability
(ability to handle all test models), G-Code
compatibility and application configurability. The
properties being configured included: print
temperature, print bed temperature, layer thickness,
fill density, print speed and minimum layer print
time.
Baumann’s (Baumann F. Et al, 2015) work
focused on evaluation of 3D slicing applications.
This work did not consider the effects of printer
resolution. Practically all 3D printers, just like
cameras, quote resolutions but in 3D space (x-y-z).
A consideration of this resolution in determining the
ability of a printer to accurately print a model should
be an integral component of a slicing application.
When vendors quote printer resolutions, evaluation
of printers for their suitability for a given model can
make use of a resolution aware slicing process to
select the best printer.
2 RESOLUTION-AWARE
SLICING
In 3D printing terms, resolution is the number of
individual voxels that can be deposited in a given
unit volume. It is usually expressed as layer
thickness (z) and x-y resolution in dots per inch (dpi)
or micrometers (µm). The layer thickness varies by
printer and/or printing technology.
Figure 4: Comparison of Minimum Feature (Baumann F.
Et al, 2015).
Figure 5: Comparison of Minimum Layer Thickness
(Baumann F. Et al, 2015).
Data for five 3D printing technologies were
compared based on their capabilities as it relates to
factors that affect print resolution. The factors
include minimum feature size), minimum layer
thickness and tolerance.
0
0,002
0,004
0,006
DMLS EBM SLS FDM SLA
Minimum feature size (in)
0
0,002
0,004
0,006
DMLS EBM SLS FDM SLA
Minimum Layer Thickness (in)
Resolution-aware Slicing of CAD Data for 3D
125
In Figure 4, direct metal laser sintering (DMLS),
electron beam melting (EBM), selective laser
sintering (SLS) and Fused deposition model all
averaged a minimum feature size of approximately
0.005in. If the minimum feature size is less than the
print resolution, it will not be possible to print the
part. While this is not too common with the current
application of 3D printing, it is imperative to take
into consideration the fact that 3D printing is
growing in application as newer uses of 3D
technology is being investigated. Stereolithography
(SLA) offered the best opportunity in terms of
minimum feature size as it is capable of 0.004in
feature size.
The layer thickness has negative effect on the
quality of the print work. As the layer gets thicker it
becomes increasingly difficult for the printer to
accurately target and print intricate shapes. In Figure
5 DMLS and SLA offered the best opportunities as
they are capable of layer thickness of 0.001in. SLS
is next with a minimum layer thickness of 0.004in
while EBM and FDM offered the least performance
with both capable of minimum layer thickness of
0.005in.
The factors that influence printing resolution
include:
• Print accuracy along the x, y and z axes. The
precision of the print head is determines the x
and y axis resolution. The z axis, where the
layers are applied, determines how fine they
will be.
• The viscosity of the binding agent
• The accuracy of color application
• Treatment of the 3D printed object after it
comes out of the machine.
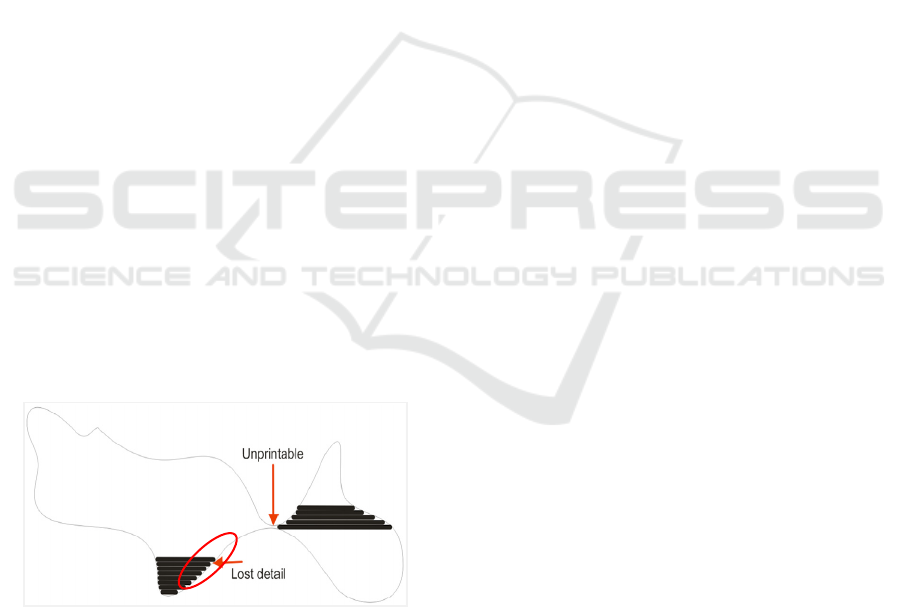
Figure 6: Effect of resolution on printability of features.
In Figure 6, it can be shown that as
feature/region sizes get smaller than the resolution of
the printer the feature/region becomes unprintable
by that printer. Also, the staircase effect common
with 3D printing is also shown. A review of methods
for slicing 3D data to handle staircase effect
(Baumann F. Et al, 2015) identified a few methods
including:
• Cusp height concept (Dolenc, A. and Makela,
I. 1994)
• Stepwise uniform refinement (Sabourin, E.,
Houser, S.A. and Bohn, J.H., 1996)
• Local adaptive slicing (Tyberg, J. and Bohn,
J.H. 1998)
• Accurate exterior and fast interior (Sabourin,
E., Houser, S.A. and Bohn, J.H. 1997)
• Efficient slicing method (Tata, K., Fadel, G.,
Bagchi, A. and Aziz, N. 1998)
• Non Uniform cusp heights (Cormier, D.,
Unnanon, K. and Sanni, E. 2000)
• Consideration of parabolic build (Pandey,
P.M., Reddy, N.V. and Dhande, S.G. 2003)
3 OUR METHODOLOGY
3.1 Objectives
The objective of our research is to improve the
quality of 3D printed objects, by detecting upfront,
potential defects as regions or features that will be
unprintable due to printer resolution. Ray casting
algorithm mentioned in section 3.2 will be applied to
slicing output for the applicable printer. Each slice
will contain a set of contours. Ray casting will be
used to determine the regions of the contours that are
actual solids. The length of the line between one
edge of the solid portion of the contour and the other
will be compared with the printer resolution in that
direction. Regions having lines lower than the
printer resolution in a particular direction will be
flagged as having potential defects on printing.
3.2 Ray Casting of 3D Slice Data
Upon parsing of the 3D slice data for the applicable
printer, ray casting is performed on each slice using
the resolution in one of x or y direction as the
frequency. The algorithm accepts the xyz resolutions
quoted by the printer as inputs. The z resolution is
taken as the slicing thickness. Arbitrarily y or x is
chosen as the direction to begin slicing.
For each slice, a line is drawn from one edge of
the slice to the other at the y axis. The pitch of this
line is equal to the y resolution. All the points where
this line intersects with the edge of the contours in
the slide is identified and labelled 0 or 1 in
alternating order. Lines labelled 1 are for solid
regions. Lines labelled 0 are outside the solid
GRAPP 2016 - International Conference on Computer Graphics Theory and Applications
126
regions in the slide; hence they will not be used in
further computations.
Our code checks for intersection of two lines. If
an intersection is found, the code also checks if the
point of intersection actually occurs on the
applicable lines. If the point does not occur on both
lines, the algorithm discards the point.
Figure 7: Schematic of Ray casting to detect solid features
for size comparison.
Our application traverses the entire slicing data
set (Figure 7) to identify defective regions. If the
algorithm in SlicingResValidator is applied to
slicing outputs, it will detect defective regions as
those having sizes/length less than the resolution of
the applicable printers. Other uses of the algorithm
in SlicingResValidator will be when the check is
introduced during model design to enforce the
requirement to ensure that features/regions do not
fall below the printer resolution.
4 RESULTS AND DISCUSSION
Our application, SlicingResValidator accepts a CAD
model, its SVG slicing dataset, x resolution and y
resolution as inputs. A few 3D CAD models were
tested and SlicignResValidator was able to detect the
potential defects on the slicing sets. These defects
are presented as points on both sides of the edges
making up the ray solid region of interest. The
defect can also be viewed as a line joining these
points to show their length as evidence that they are
shorter than the printer resolution in that direction.
The following metrics were generated from our
model:
• Slicing Number: This is the index on the slice
in the total SVG slicing dataset.
• Total Number of Contours: This is the total
number of contours found in the selected slice.
• Total number of Slice Regions with Errors:
When defects are detected, algorithm provides a
count of the defects and presents it to the user.
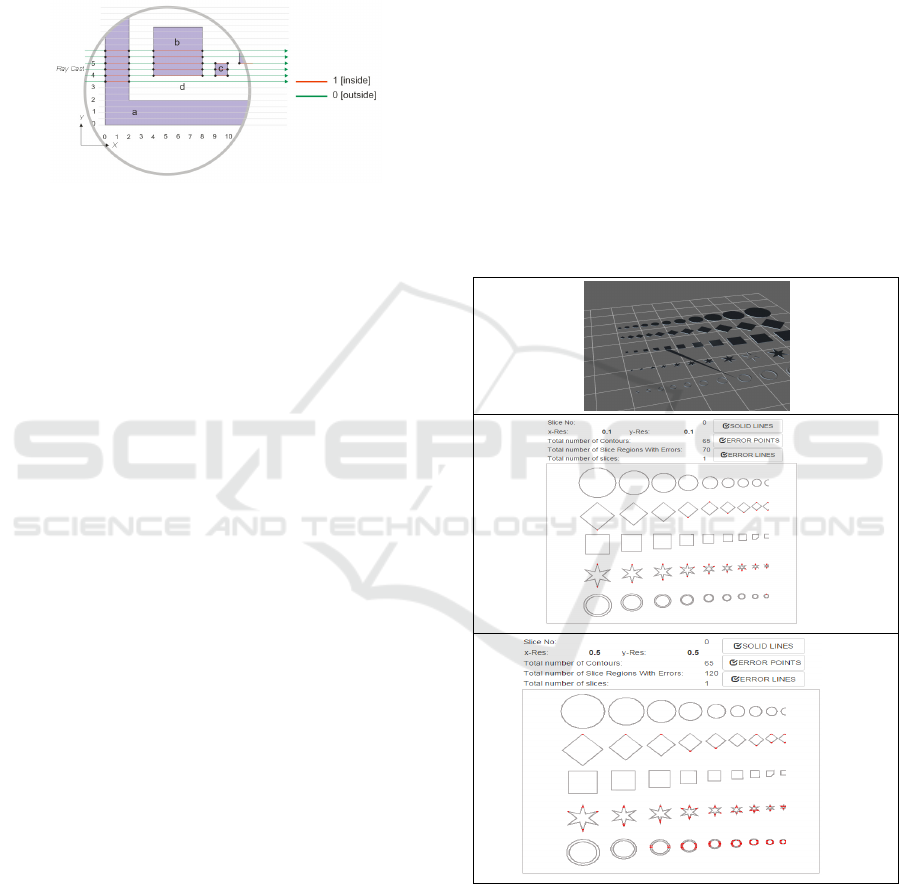
The first model contained a flat 3D model of regular
geometrical shapes in different sizes. The goal was
to evaluate the ability of SlicingResValidator to
detect regions of sizes lower than that of the
applicable printer resolution. In Figure 8(a), a slice
of the 3D model on the left was validated with a
resolution of x=0.1 and y=0.1 in the applicable unit
of measurement and regions. The number of errors
detected in one slice was 70. This means that this
slice contains 70 regions whose sizes/lengths are
smaller than the x resolution of the printer. When the
resolution was set to x=0.5 and y=0.5 (lower
resolution, see Figure 8 (b)) 120 defective regions
were detected. With a resolution of x=1 and y=0.5,
222 defective regions were detected. This shows that
our model is able to detect more defects as the
resolution is reduced. In effect, a lower resolution
means that the printer will deposit more materials at
a single point than with higher resolutions.
Therefore, a larger number of smaller features will
not be printed.
(a)
(b)
Figure 8: Regular Shapes Created in 3D StudioMax and
Sliced with Slic3r into one SVG slice set and errors
detected with printer resolutions x=0.1, y=0.1 (a); x=0.5,
y=0.5(b) and x=1, y=0.5(c).
In Figure 9, a model of perforated sphere obtained
from Thingivers.com was cut into 242 slices. On
validating the 12
th
slice with a printer resolution of
Resolution-aware Slicing of CAD Data for 3D
127

x=0.1 and y=0.1, our model detected only 3
defective regions. This demonstrates that as
resolution is decreased, our model is able to detect
more defective regions. However, when this model
was validated with a resolution of x=1, y=1, the
number of contours with errors reduced to 4. This
shows that when the resolution is reduced, our
model may detect fewer errors since some small
features will not be scanned due to frequency in the
particular direction. In effect, features, smaller than
1, are more likely to be missed if the resolution is 1
than when the resolution is 0.5. Our model will not
propose a correction of 3D model. We assume that
correcting the 3D model is outside the scope of
quality inspection. As an inspection tool, its main
focus is to detect and report defects. Also, it is not
always practicable to modify 3D models as they may
be required to be exact replicas of the physical
model. In this case, the utility of our model is in
informing the user that the model will have defects
when printed by a particular printer with a quoted
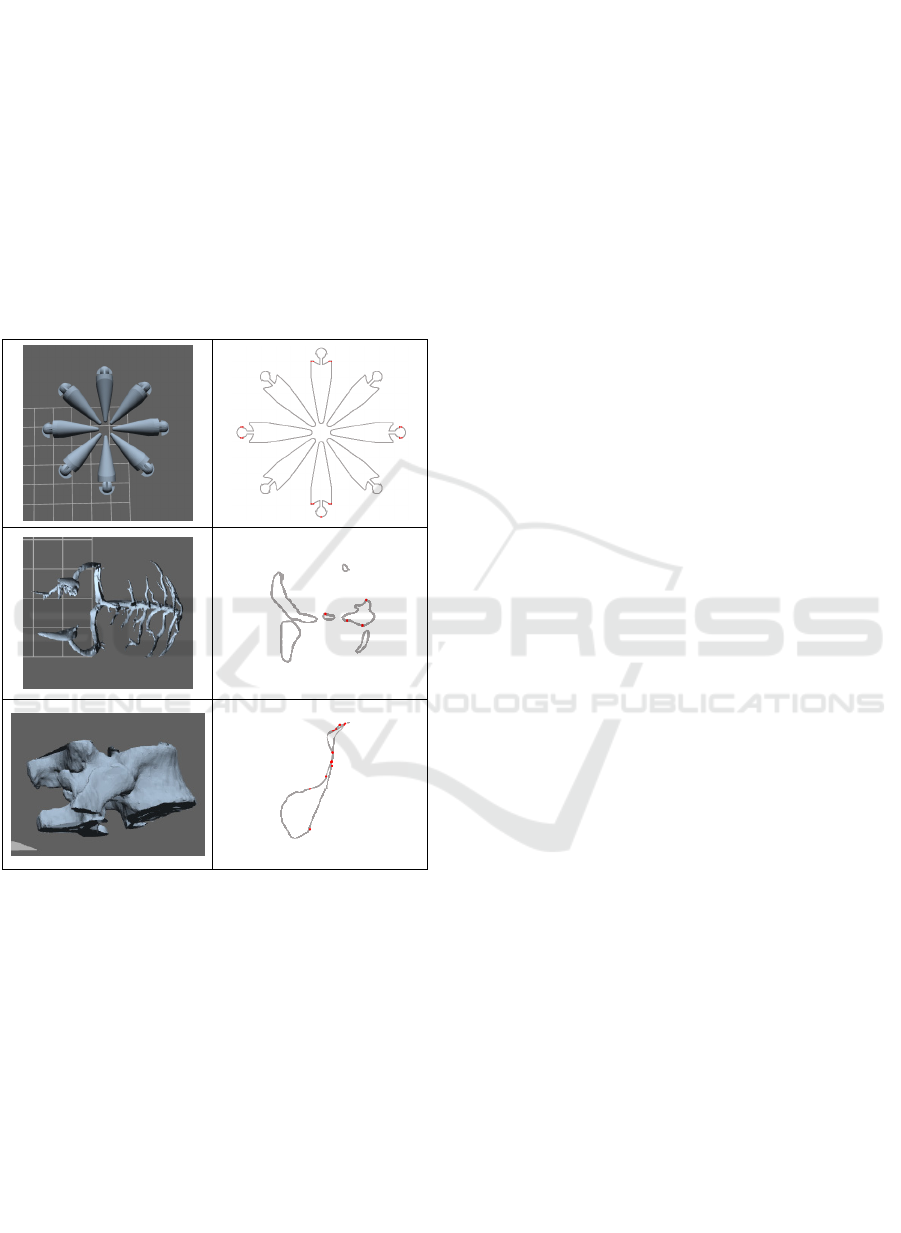
resolution. Other models used for testing our
application are shown below.
Figure 9: Perforated Sphere (Thingivers.com) and Sliced
with Slic3r into 242 SVG slice sets and errors detected on
different slices at different resolutions.
4.1 Discussion
We have suggested a novel system for validating the
printability of 3D CAD models by a given printer
based on the printer resolutions. It provides
significant benefits to the quality assurance of 3D
printed parts. We showed how our model can utilize
the slicing output of 3D CAD data from any slicer
application outputting SVG <g> sets and polygons.
We demonstrated that it is possible to visualize, in a
slice, regions that will be unprintable in a CAD
model, when they fail resolution validations.
The model proposed by (Baumann F. Et al,
2015) supports our work. It established a framework
for testing the quality of slicing outputs of 3D
models produced in FDM printers. In their model a
few slicing applications were tested and measures
were established to evaluate the slicing applications.
The resolution of the printer was not included in the
framework. We suggested that the validation based
on resolution be added to the framework. We
proposed a system which can locate the positions
where the quality will fail in the actual printing.
An enhancement to our work can be in the area
of applying this concept in the 3D model design
process. The 3D models come from imaging data
that is segmented and consequently stitched up to
form a full model. However, other means of
generating models include direct design. During
modelling, shape operations are very common. They
include scaling, stretching or shrinking a model or
its features. If the resolution of the printer is added
as a constraint, a CAD design application can check
if a shape operation is going to result in defective
features and warn the user.
Our system did not attempt to propose a
correction of CAD models. As an inspection tool, its
main focus is to detect and report defects. Also, it is
not always practicable to modify 3D models as they
may be required to be exact replicas of the physical
model. In this case, the utility of our model is in
informing the user that the model will have defects
when printed by a particular printer with a quoted
resolution.
We also acknowledge that, as a study in 3D
domain, it would be beneficial to visualize our
results in 3D space. We focused on visualizing our
results in 2D space since the actual computations
(ray casting) are done in 2D space based on slices.
Our system also considered performance in terms
of optimal use of computing resources. Depending
on the size of the 3D file as well as the complexity
of the CAD data, the time it takes our model to scan
through a slice and compare/detect regions having
defects depends largely on the resolution applied in
both directions (x and y). The higher the resolution,
the longer it will take to validate the CAD model.
Our model did not consider curved shapes, as is the
case with STL. It means that each curve will be
represented by discrete lines. Therefore, the number
of lines in the polygon, defining each contour in the
GRAPP 2016 - International Conference on Computer Graphics Theory and Applications
128
slides, will influence how long it will take to
validate each model or slice. In our model, it took
less than one second to process a slice having 195
lines with a resolution of x=0.1 and y=0.1 in the
dimensions of the CAD model on a Windows(r) 7
PC with Intel(r) Core i5-4310U CPU @ 2.00GHz
2.60GHz processor running on 8.00 GB ram. It also
took less than one second to process this file when
the resolution was set at x=0.01 and y=0.01.
However, it took approximately 5 seconds to process
this same data when the resolution is set to x=0.001
and y=0.001.
Other 3D CAD models evaluated by our system
include:
Figure 10: More 3D Models analyzed by
SplicingResValidator.
REFERENCES
Munir, E., 2013. Slicing 3D CAD Model in STL Format
and Laser Path Generation. International Journal of
Innovation, Management and Technology, Vol. 4, No.
4, Aug 2013,410-413.
Stamos, I., Allen, P., 3-D Model Construction Using
Range and Image Data. In Proceedings of the
Conference on Computer Vision and Pattern
Recognition (CVPR ’00), USA, June 2000.
ISO 10303-21:2002 Industrial automation systems and
integration -- Product data representation and
exchange -- Part 21: Implementation methods: Clear
text encoding of the exchange structure.
Grimm, T., 2004. User's Guide to Rapid
Prototyping, Society of Manufacturing Engineers,
p. 55, ISBN 0-87263-697-6.
Topcu, O., Tascioglu, Y., & Unver, H. O. 2011. A Method
for Slicing CAD Models in Binary STL Format. 6
th
International Advanced Technologies Symposium
(IATS’11),May 2011, 163, 141-145.
Baumann, F., Buddayci, H., Grunert, J., Keller, F., Roller
D., 2015. Influence of slicing tools on quality of 3D
printed parts, Computer-Aided Design and
Applications, August 2015.
Freedman, David, H. 2013. Layer By Layer. Technology
Review 115.1: 50–53. Academic Search Premier.
Web. 26 July 2013.
Dolenc, A. and Makela, I. 1994. Slicing procedure for
layered manufacturing techniques, Computer Aided
Design, Vol. 1 No. 2, pp. 4-12.
Sabourin, E., Houser, S.A. and Bohn, J.H. 1996. Adaptive
slicing using stepwise uniform refinement, Rapid
Prototyping Journal, Vol. 2 No. 4, pp. 20-6.
Tyberg, J. and Bohn, J.H. 1998. Local adaptive slicing,
Rapid Prototyping Journal, Vol. 4 No. 3, pp. 118-27.
Sabourin, E., Houser, S.A. and Bohn, J.H. 1997. Accurate
exterior, fast interior layered manufacturing, Rapid
Prototyping Journal, Vol. 3 No. 2, pp. 44-52.
Tata, K., Fadel, G., Bagchi, A. and Aziz, N. 1998.
Efficient slicing for layered manufacturing, Rapid
Prototyping Journal, Vol. 4 No. 4, pp. 151-67.
Cormier, D., Unnanon, K. and Sanni, E. 2000. Specifying
non-uniform cusp heights as a potential for adaptive
slicing, Rapid Prototyping Journal, Vol. 6 No. 3, pp.
204-11.
Pandey, P.M., Reddy, N.V. and Dhande, S.G. 2003.
Improvement of surface
finish by staircase
machining in fused deposition modelling, Journal of
Material Processing Technology, Vol. 132 No. 1, pp.
323-31.
Pulak M. P, Venkata N. R, Sanjay G. D. Slicing
Procedures in Layered Manufacturing: a review, Rapid
Protoyping Journal, Vol. 9 No.5, June 2003, pp.274-
288.
Resolution-aware Slicing of CAD Data for 3D
129
