
On the Impact of Granularity in Extracting Knowledge from
Bioinformatics Data
Sean West and Hesham Ali
College of Information Science and Technology, University of Nebraska at Omaha, Omaha, U.S.A.
Keywords: Data Integration, Knowledge Extraction, Gene Expression Data, Protein-protein Interaction, Co-regulation,
Correlation Networks, and Clusters.
Abstract: With the rapidly increasing amount of various types of biological data currently available to researchers, the
focus of the biomedical research community has been shifting from pure data generation towards the
development of new methodologies for data analytics. Although many researchers continue to focus on
approaches developed for analyzing single types of biological data, recent attempts have been made to utilize
the availability of heterogeneous data sets that contain various types of data and try to establish tools for data
integration and analysis in many bioinformatics applications. Such attempts are expected to increase
significantly in this coming decade. While this can be viewed as a positive step towards advancing big data
analytics in bioinformatics, it is critical that these integration methodologies are meticulously studied to
ensure high quality of the knowledge extracted from the integrated data. In this work, we employ data
integration methods to analyze biological data obtained from protein interaction networks and gene expression
data. We conduct a study to show that potential problems can arise from integrating or fusing data obtained
at different granularity levels and highlight the importance of developing advanced data fusing techniques to
integrate various types of biological data for analytical purposes. Further, we explore the impact of granularity
from a more formulized approach and the granularity levels significantly impact the quality of knowledge
extracted from the integrated data.
1 INTRODUCTION
The bioinformatics perspective of data integration is
the uncovering of biological data and the extraction
of useful biological information (Rhee et al., 2008).
With the subsequent push towards data aggregation
and integration (Chatr-aryamontri et al., 2013;
Salwinski et al., 2004), comes a series of challenges,
highlighted by rapidly changing bioinformatics data
standards (Prasad et al., 2009; Kerrien et al. 2011).
Many of these bioinformatics data standards are
suitable for aggregation by targeting data reporting
and storage, such as the Minimum Information about
a high-throughput SEQuencing Experiment for
microarrays (Ceol et al. 2009), standards of data-use
are influenced by research outcomes and must be
more flexible to handle the swift evolution of
community ordained workflows. Particularly,
standards must handle the sensitivities of data sources
within these evolving workflows.
Data fusion is a special case of data integration
where two or more pieces of data are combined to
create a new parameter with its own novel meaning.
Although the term data fusion is relatively new to
bioinformatics, long associated with a military
connotation, its utilization is becoming increasingly
popular, with 21 PubMed publications in 2005 using
the term “data fusion”, and 95 publications in 2015.
Data fusion is a multi-step process, cascading
from the primary step of data source selection
(Taneera et al., 2012; Hanisch et al. 2002). The high
complexity of bioinformatics data sources creates a
special challenge (Bossi and Lehner, 2009). Not only
does this complexity enhance the central
characteristics of big data, such as variety and
veracity, but it accentuates the problem of
granularity.
Granularity refers to the shifts in scale where
membership is defined through mereology (Bittner
and Smith, 2003) or indiscernibility (Hobbs, 1995).
These two granularity dimensions were originally
specified as abstraction, shifts in specificity, and
aggregation, shifts in part-whole relations (McCalla
et al. 1992). Later the aggregation dimension was
adapted to into granularity parthood, molecules in a
cell, and determinate parthood, functioning members
92
West, S. and Ali, H.
On the Impact of Granularity in Extracting Knowledge from Bioinformatics Data.
DOI: 10.5220/0005778700920103
In Proceedings of the 9th International Joint Conference on Biomedical Engineering Systems and Technologies (BIOSTEC 2016) - Volume 3: BIOINFORMATICS, pages 92-103
ISBN: 978-989-758-170-0
Copyright
c
2016 by SCITEPRESS – Science and Technology Publications, Lda. All rights reserved

of the cell (Bittner et al., 2004). These scales have not
seen a lot of change in recent publications, and the
term granularity usually attributed to specificity.
However, increased differentiation of granularity
scales have been specified for ontology purposes
(Rector et al., 2006; Vogt et al., 2012). In the
biomedical domain, data sources contain members
from a population of available data-producing
sensors, we refer to the determinate parthood scale in
this study. Further, we use the terms abstraction and
aggregation in reference to their associated
dimensions of granularity, instead of their traditional
data processing definitions.
When examining biomedical data sources within
the abstraction dimension, two overarching
categories arise, isolated and integrated data sources.
Isolated data sources are typically specific,
representing results from single experiments.
Integrated data sources, if single-modal, may exist at
a similar abstraction level as isolated data sources.
However, if multi-modal, due to multiple
technologies being implemented, the data will exist at
a higher abstraction and consequently lower
granularity level.
We use microarray data as an example of low
abstraction, high granularity data, since each series
usually represents just a few experimental conditions
across a limited number of tissues. The variability of
cellular function within these tissues necessitates that
microarray data is not the epitome of high granularity
data, rather it exists at a granularity level where
differences between cellular conditions can be
extracted. To combat high false-positive and false-
negative rates, microarray is often enriched through
low-granular domain knowledge. A key component
to microarray data analysis is to differentiate between
cellular conditions. One data fusion methodology is
to put these differences in the context of domain
knowledge as a component of network creation
(Agarwal et al., 2008), through enrichment (Xu et al.,
2011), or examining expression differences within
the protein-protein interaction (PPI) network
(Medintz et al., 2007).
Protein-protein interaction databases may contain
high abstraction, low granularity data. Some recent
PPI databases are cell-specific or even molecule
specific (Veres et al., 2014; Liu et al., 2011).
Additionally, many integrated PPI databases, such as
the Search Tool for the Retrieval of INteracting
Genes/Protein (STRING), compile a list of potential
relationships, not taking unique cellular conditions
into account. STRING scores the interaction between
proteins across a set of data sources in a union-like
fashion (Bindea et al. 2009). Here, we use PPI data
sources that are non-integrated and not condition
specific, in order to bias the data towards a low
granularity. These non-integrated PPI databases use
manual curation methods to extract PPI information
from scientific literature. So, even non-integrated PPI
data sources are examples of multi-modal systems.
Yet, since the manual curation methodologies
employed to create PPI databases may innately
increase the granularity of the data, the diversity in
the curation methods may lead to the lower-
abstraction levels. In this work, we examine the
structural and biological attributes of several popular
PPI databases in order to characterize their unique
contributions towards data integration. We further
examine their pathway enrichment of each database
to determine any specificity or unique bias towards
similar groupings of biological functionality, which
would indicate increased levels of granularity.
Although the differences may be explicit between
cellular conditions from the expression data and since
PPI data comes from high abstraction data sources,
integrating microarray data with PPI data that is not
tissue or cellular condition specific does not model
the true protein-protein interaction network within the
experimental cellular condition. Therefore, the
consequences of alternate expression and PPI
network structure changes may not depict true
biological reality. If the variability in granularity
levels between PPI databases and microarray data
biases the data away from high-granularity,
potentially questionable biological information will
be extracted after the data fusion implementation. To
test this critical point, we can fuse the PPI and the
microarray data and compare the information
extraction between the original experimental
microarray data and the fused datasets. In this study,
we test to see the effect of fusing low abstraction,
microarray data with high abstraction, PPI data on
extraction of Type II Diabetes specific pathways.
Granularity along the aggregation dimension
requires a more formulized definition, which is
specified within the methods section. This
formulization includes three suggestions for
aggregation definition. First, using a rough set theory
definition of granularity, data fusion of specific data
sources lies on an abstraction granularity level
dependent on a set of attributes governing the
differentiation between data sources. Alternate
abstraction levels along scales defined by a set of
relevant attributes, impact the results of biological
information extraction by biasing the fusion towards
those chosen attributes. Second, when separating
these data sources according to attributes we create a
set of fusion networks for each attribute set used. The
On the Impact of Granularity in Extracting Knowledge from Bioinformatics Data
93
segmentation of the original data sources can also be
used to define level of aggregation. Finally, the
number of original data sources can be used to define
aggregation within each fused network separately.
We use these three definitions of aggregation to
test the relationship between information extraction
and aggregation. So, in summary, we have three
hypothesis:
H1: The different curation methods of non-
integrated PPI databases do not offer unique
bias towards specific biological functionality.
H2: Fusion of low-abstraction and high-
abstraction data will decrease experimental-
specific information extraction.
H3: There exists a definition of aggregation such
that a relationship between granularity and
information extraction can be seen.
Section 2 describes the methods for this study,
including the formulizations for the definition of
granularity in the aggregation dimension. Section 3
depicts the results. Section 4 discusses the outcome of
the study and its impact on the hypotheses. The paper
concludes with section 5.
2 METHODS
Throughout the study, protein-protein interaction data
and microarray data are modeled as networks, where
the nodes represent the biological elements and the
edges connect elements that are related by interaction
or high correlation. In the first part, we attempt to find
unique biological themes or functionalities associated
with the PPI databases queried in order to answer
hypothesis H1. We use structural similarity between
the PPI networks and the quality of the clusters
obtained from the networks using standard pathway,
disease, and ontology enrichments. In this manner,
we identify the biological functionality associated
with each protein-protein interaction network and
enriched clusters are mapped to human pathway
hierarchies to search for significant patterns.
In the second part, we address hypothesis H2. To
test the hypothesized relationship between
abstraction and data extraction, we use a case study
with a Type II Diabetes microarray series. We create
the integrated network using PPI and microarray data.
We then enrich obtained network clusters to identify
network-specific biological functions. We choose a
list of 24 diabetes associated pathways or diseases
curated from Reactome, the Online Mendelian
Inheritance in Man (OMIM), and the Kyoto
Encyclopedia of Genes and Genomes (KEGG). We
assess the enrichments of these pathways across the
original and fused networks, and discuss the potential
information loss that may occur due to the lack of
consistent granularity levels.
To validate the relationship between aggregation
granularity and knowledge extraction, hypothesis H3,
we formulize granularity using three different
approaches and add additional sources to expand on
the number of discrete granularity levels that can be
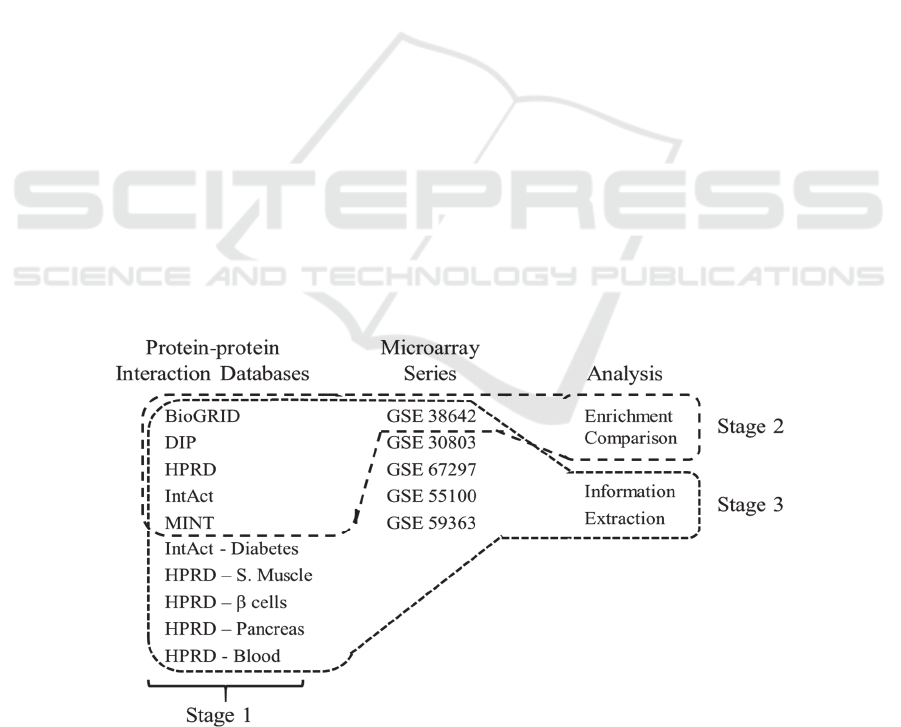
Figure 1: Data sources of this study. Stage one corresponds to hypothesis 1 and uses only the PPI databases. Stage 2 uses a
selection from the PPI databases and conducts an enrichment comparison. Stage 3 uses all the data sources in an information
extraction test to understand its interplay with aggregation.
BIOINFORMATICS 2016 - 7th International Conference on Bioinformatics Models, Methods and Algorithms
94

formed. Extraction scores based on enrichment
results are assigned to each network and correlation
is measured.
2.1 Protein-protein Interaction
Databases
The following protein-protein interaction databases
were selected for this study since they reflect
variability associated with experiments used to obtain
them, they do not have a high-degree of integration
among each other, and they were initially, seemingly
sources of low granularity. The databases used were
Database of Interacting Proteins (DIP) (Thorne and
Stumpf, 2007), BioGRID (Zhang and Horvath, 2005),
Human Protein Reference Database (HPRD)
(Obayashi and Kinoshita, 2009), IntAct (Ingram et
al., 2006), and Molecular INTeraction database
(MINT) (Kashani et al., 2009).
DIP focuses on extracting experimental
knowledge from publications and stores binary
interactions between proteins, clarifying source and
evidence. BioGRID is a database of protein and
genetic interactions that are extracted from manually
annotated publications, by a team of PhD curators.
Text mining is used to rank relevant publications
where interactions are manually extracted and added
to BioGRID. HPRD uses laboratory submitted data
through a tool called BioBuilder which helps
researchers interact with the database and submit
experimental information. In this way, HPRD has
protein-protein interactions that are post-translational
modification, disease, and tissue specific. It also has
an overarching binary PPI source. IntAct takes an
open-source approach, with all data and repository
code available to the public. The stored interactions
are publicly curated from literature but also have a
design to allow for direct researcher annotation. Rules
on curation are specified on the EBI website and
interactions are reviewed by a second curator. MINT
is highly similar to IntAct, using the same
infrastructure and curation rules. The difference is the
set of MINT curators.
For the third (aggregation) component of the
study, we expand on those PPI databases with
curation conducive to tissue or disease specificity.
We add a diabetes sub-network for IntAct. HPRD has
many tissue specific curations, but we use only the
HPRD subnetworks with attribute overlap for the
microarray series used in the third part. So, we
include skeletal muscle, β-cell, pancreas, and blood
HPRD PPI networks.
2.2 Network Creation
Although the protein-protein interaction databases
contained evidence codes which may affect edge
weights through confidence variance, the granting of
specific edge weights was not implemented. This
alleviated the necessity of consolidating the PPI edge
weights with the microarray edge weights. Instead,
edges exist where evidence supports an edge. Further,
all types of experiments, including high-throughput
evidences, were included if they were present in the
original PPI data source. This may introduce a
technology bias beyond what is incorporated into the
research bias. However, correction of a technology
bias may introduce unknown sensitivities. So,
networks created were binary and non-directional.
Protein-protein interaction networks were derived
from the overarching sets of database information,
such that tissue specific information was included
without its specificity. Only complete proteins which
correspond to at least one Ensembl gene Id were
utilized. We attempt to highlight the issues of
removing granularity from domain knowledge
sources. Yet for validating the concept of the
interaction between aggregation and information
extraction, we use PPI networks with higher levels of
granularity as mentioned above.
Microarray data was initially downloaded from
the Gene Expression Omnibus series, GSE 38642
(Halevy et al., 2006). This series was chosen since it
is human, has a large set of biological replicates,
demonstrates a disease with a long list of well-
characterized pathways, Type II Diabetes, and
obtains expression through a relevant and specific
tissue, pancreatic islets. Additionally for the third part
of the study, we included series GSE 30803, a
treatment based study on healthy β-cells, GSE 67297,
a study on cold acclimation effects of diabetic adipose
tissue, GSE 55100, a blood tissue study of diabetes,
and GSE 59363, which uses skeletal muscle tissue in
healthy and diabetic samples with exercise stages.
These additional microarray series were chosen as
they have at least a moderate number of biological
replicates, and overlapping values across “tissue”,
“disease state”, “treatment”, and “technology”
attributes.
The raw expression files were downloaded, and
robust multi-array (RMA) normalized. Pearson
correlation was implemented to find expression
relationships. The microarray networks then took two
different paths, those filtered through false-discovery
rate p-value correction and those with hard thresholds
at 0.8 power and a 0.05 p-value. Base mapping of
probes to Ensembl gene Ids was completed through
On the Impact of Granularity in Extracting Knowledge from Bioinformatics Data
95

the Biomart API. Ensembl gene Ids which correspond
to multiple probes were assigned edge weights which
matched the highest correlation scoring probe for
each individual interaction. The strong influence of
some protein domains (e.g. probes which correspond
to multiple transcripts) reduce the accuracy of the
correlations which use the probe’s expression values.
The conjugated expression values are representative
of multiple transcripts. Depending on the abundance
distribution of these transcripts either correlations
may be assigned to the wrong protein, or more likely,
the correlations will favor random correlation values,
which are more likely to be insignificant and
negligible. These multi-transcript probes are
considered negligible in this study as they make up
only a small percentage of the total probes.
With the lack of PPI exact interaction strength
values, the integrated networks created were the
union of the PPI matrices and the microarray
matrices. Union is a surprisingly common kernel
function when integrating and fusing biological data
sources. We use it here as an example of an
integration-based data fusion approach.
2.3 Identification of Unique
Contributions from Protein-protein
Interaction Data and Type II
Diabetes Case Study
PPI networks were clustered with the Speed and
Performance In Clustering (SPICi) algorithm, a fast
and biologically driven clustering approach (Jiang
and Singh, 2010). The standard parameters produced
ideally sized clusters for enrichment. An in-house
tool for enrichment which downloads source groups
and group information for Reactome, OMIM, and
KEGG datasets. It uses the multivariate
hypergeometric function to find overly expressed
source groups within network clusters. Then, it uses
the Benjamini-Hochberg-Yekutieli false discovery
rate p-value correction to address multiple hypothesis
testing and dealing with the lack of independence for
enrichment terms on a single cluster.
Unique contributions were determined by finding
those enrichments for a PPI source that were not
identified in any other PPI source. For visualization,
unique Reactome enrichments were mapped to the
Reactome pathway hierarchy and grouped by
pathway similarity. Further, structural differences
between PPI networks were uncovered at the node,
edge, and cluster levels.
The microarray networks were fused with the PPI
networks in a union fashion so that there were control
microarray, diabetes microarray, PPI, control fused,
and diabetes fused networks. These networks were
filtered as to only include only those biological
elements present in the microarray sets. Then they
were clustered and enriched using SPICi and the in-
house enrichment tool. Diabetes pathways were
manually determined for Reactome, GO, OMIM, and
KEGG. Enrichments of these pathways were
examined across the networks to identify biological
differences between control and diabetes networks.
2.4 Validation of Relationship between
Aggregation and Information
Extraction
A more formulized definition of granularity is
required to characterize the relationship between
granularity and information extraction. So far, we use
the dimension of abstraction. This allows only for
direct comparisons between objects or networks
along the same scale. An extended discrete
comparison scale is needed along the dimension of
aggregation.
Shortly after the initial introduction of rough sets
into uncertainty theory (Pawlak, 1982), Hobbs began
to distinguish granularity as a significantly
contributing factor towards uncertainty (Hobbs,
1985). This received formulization (Greer and
McCalla, 1989) and then developed into concepts of
discrete granularity scales (Hobbs, 1995). We use
Hobbs scales of granularity with the concept of
minimum rough sets to define levels of granularity
from our universe of objects (i.e. our set of original
data sources). Granularity over multiple universes in
rough sets is currently used in decision support and
management science (Słowiński et al., 2014; Sun and
Ma, 2015). We use it here as a formulized approach
to measuring granularity.
Given a universe, U, consisting of a set P of
predicates over a number of objects in O. R is the
relevant subset of predicates from P. So, we can
define objects x and y as indistinguishable if they
meet:
∀
,
~ ≅
∀ ∈
≅
(1)
Two objects are indistinguishable if their values
for every relevant predicate are equal. Expanding on
this, given a set of predicates (or attributes), we can
separate the complete list of objects into sets of
indistinguishable elements or equivalence sets. In the
first definition of aggregation, we define granularity
by the number of attributes used to create the
equivalence sets. In the second definition, each of
these equivalence sets have membership at a discrete
granularity level defined by the number of these
BIOINFORMATICS 2016 - 7th International Conference on Bioinformatics Models, Methods and Algorithms
96
indistinguishable sets. So, given a set of attributes we
can determine the granularity level as well as group
data sources for network fusion. In the third definition
of aggregation, we can define granularity by the
number of data sources in the equivalence set and
separate these sets according to granularity.
We created three universes of objects as our
complete set of data sources, using “source”, “tissue”,
“disease state”, “treatment”, “technology”,
“aggregation method”, and “species” as attributes.
The first universe, the overarching universe,
contained all data sources. The second two, diabetes
and control universes, representatively used diabetic
or non-diabetic data sources. In doing so we can see
the effect of experimental condition on information
extraction. We used each combination of every length
of these attributes, defining a set of fused networks
and a defined granularity level. We can use the
enrichment and granularity level to characterize the
relationship between the two, given our defined
universe.
To score information extraction, we use a similar
method as above, measuring the enrichment of
diabetes related terms from Reactome, KEGG, and
OMIM. We define the information extraction score in
two ways. First, we use the proportion of relevant
enrichment terms found over the total number of
relevant enrichment terms. To standardize
enrichment term impact on the score, we also use an
information extraction score which weights the
contribution of an enriched term by the probability of
finding the term, as defined by the calculated
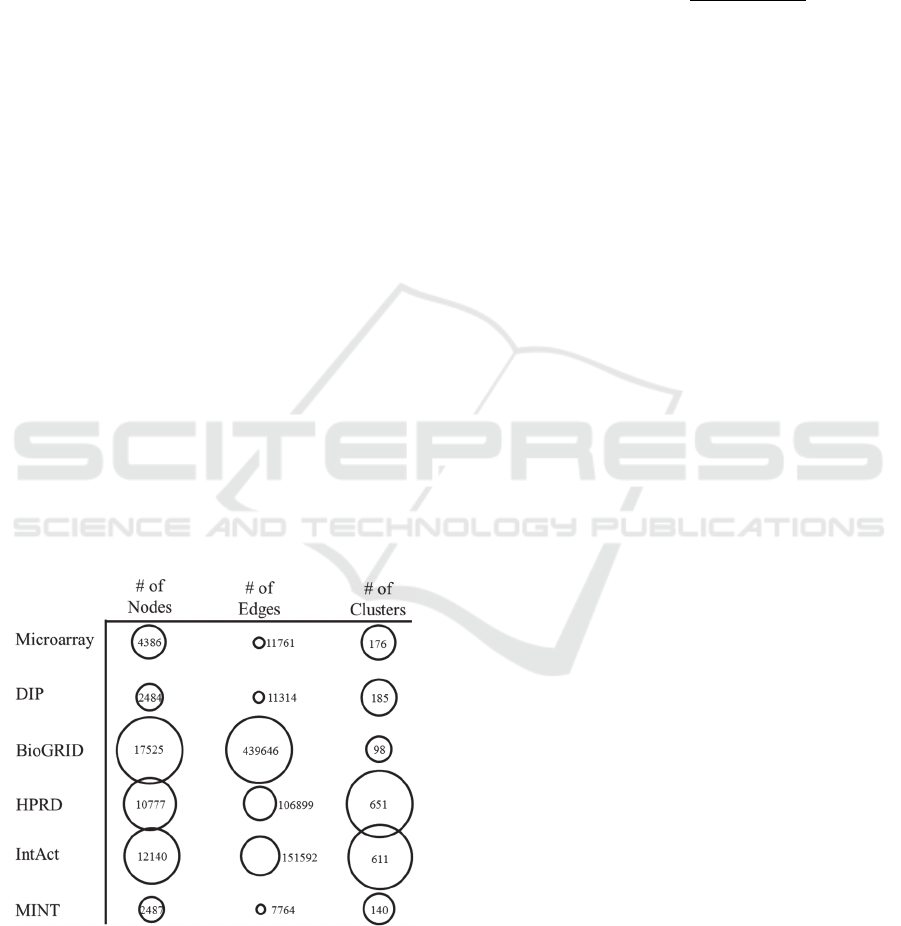
Figure 2: Data Source Sizes – The relative sizes for the data
sources as the number of nodes, number of edges, and
number of clusters are displayed as numbers and
represented as the area of their corresponding circles in
order to show relative size.
probability of finding the term across all used
networks produced by the universe. In this equation,
N is the set of enrichment terms in a given network,
T is the complete set of diabetic enrichment terms,
and P(t) is the probability of finding term t in any
network.
∑
1
∈
∑
1
∈
(2)
Then we find the correlation between discrete
levels of granularity and information extraction
scores, utilizing equivalent set derived fused
networks as each point. In total, we obtain six
correlation and p-value pairs for each aggregation
definition from the three universes and the two
scoring techniques. These correlations are applied to
each of the definitions for aggregation granularity:
number of attributes, number of equivalence sets, and
number of contributing data sources.
3 RESULTS
3.1 Protein-protein Interaction
Databases Show Low Structural
Similarity
Structural differences between networks were
examined at the node, edge, and cluster levels. Figure
2 shows the number of biological elements found in
each database, i.e. proteins for the PPI databases, and
transcripts for the microarray series. The overlap
percent of these node sets were calculated by dividing
the intersection of the two sets by their union. As
would be expected the larger databases have low
overlap percent with the smaller databases since their
potential overlap is small. Table 1 shows this overlap
between the PPI networks and the 0.8 power
threshold control microarray network. The larger,
more inclusive networks tend to have higher
similarity, but DIP and MINT, even with a close
number of nodes, had a low overlap.
More so than the overlap between biological
elements, the interactions derived from each data
source showed almost no overlap. The number of
edges in each network seemingly enhanced the
distance in size between data sources. Figure 2 shows
the number of interactions in each network; Table 2
shows the overlap, calculated by taking the
intersection over the union of two interaction sets.
The overlap of clusters from each network was
determined. Only clusters of size five or higher were
used and two clusters needed a 70% member overlap
On the Impact of Granularity in Extracting Knowledge from Bioinformatics Data
97
as determined by the smallest cluster to be determined
the same. Figure 4 shows the number of clusters in
each network; Table 3 shows the overlap between
these clusters. The BioGRID network had a high
density and clustered into small, yet huge clusters.
Once again, the structural overlap of these networks
is negligible.
Table 1: Node Overlap.
MicroArray DIP Biogrid HPRD IntAct
MINT 0.08 0.22 0.14 0.20 0.20
IntAct 0.18 0.21 0.65 0.50
HPRD 0.16 0.23 0.56
Biogrid 0.19 0.16
DIP 0.09
Table 2: Edge Overlap.
MicroArray DIP Biogrid HPRD IntAct
MINT
0.00 0.02 0.00 0.02 0.04
IntAct
0.00 0.03 0.02 0.06
HPRD
0.00 0.04 0.03
Biogrid
0.00 0.02
DIP
0.00
Table 3: Cluster Overlap.
MicroArray DIP Biogrid HPRD IntAct
MINT
0.00 0.01 0.01 0.01 0.02
IntAct
0.00 0.01 0.08 0.06
HPRD
0.00 0.02 0.06
Biogrid
0.00 0.01
DIP
0.00
Table 4: Potential Enrichment Overlap.
MicroArray DIP Biogrid HPRD IntAct
MINT
0.30 0.52 0.60 0.56 0.57
IntAct
0.74 0.43 0.40 0.40
HPRD
0.71 0.49 0.46
Biogrid
0.72 0.49
DIP
0.54
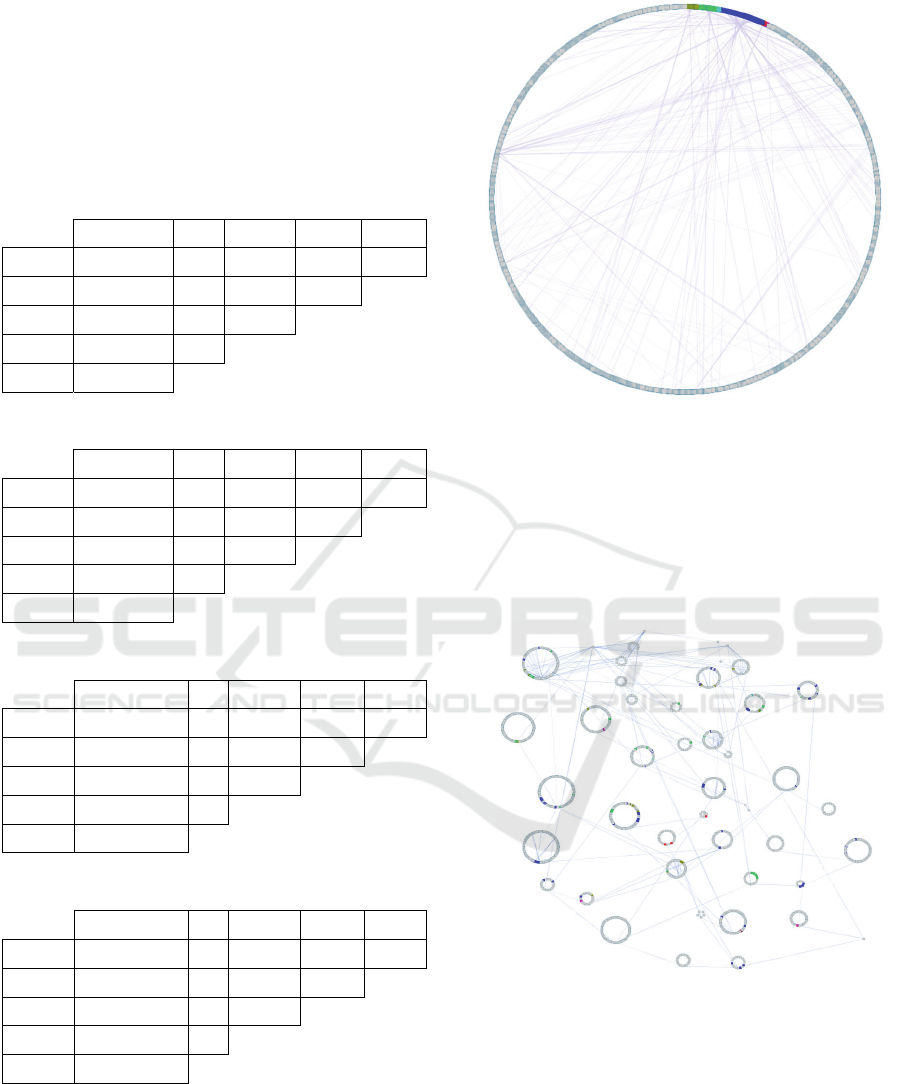
Figure 3: Full hierarchy of Reactome human pathways. The
entire list of human Reactome pathways and their hierarchy
was graphed so that nodes represent pathways and edges
represent the child-parent relationships in the Reactome
hierarchy. The unique Reactome enrichments for each PPI
network are highlighted in color: HPRD (green), IntAct
(gold), BioGRID (blue), DIP (pink), and MINT (red). These
unique enrichments represent a small proportion of the total
human pathway hierarchy.
Figure 4: Organized hierarchy of Reactome human
pathways - Fig. 3 is restructured to group pathways from
the same branches of the Reactome hierarchy together. The
unique pathway enrichments show low grouping tendency,
and the PPI sources do not demonstrate biological
specificity. Enrichments for each PPI network are
highlighted in color: HPRD (green), IntAct (gold),
BioGRID (blue), DIP (pink), and MINT (red).
BIOINFORMATICS 2016 - 7th International Conference on Bioinformatics Models, Methods and Algorithms
98
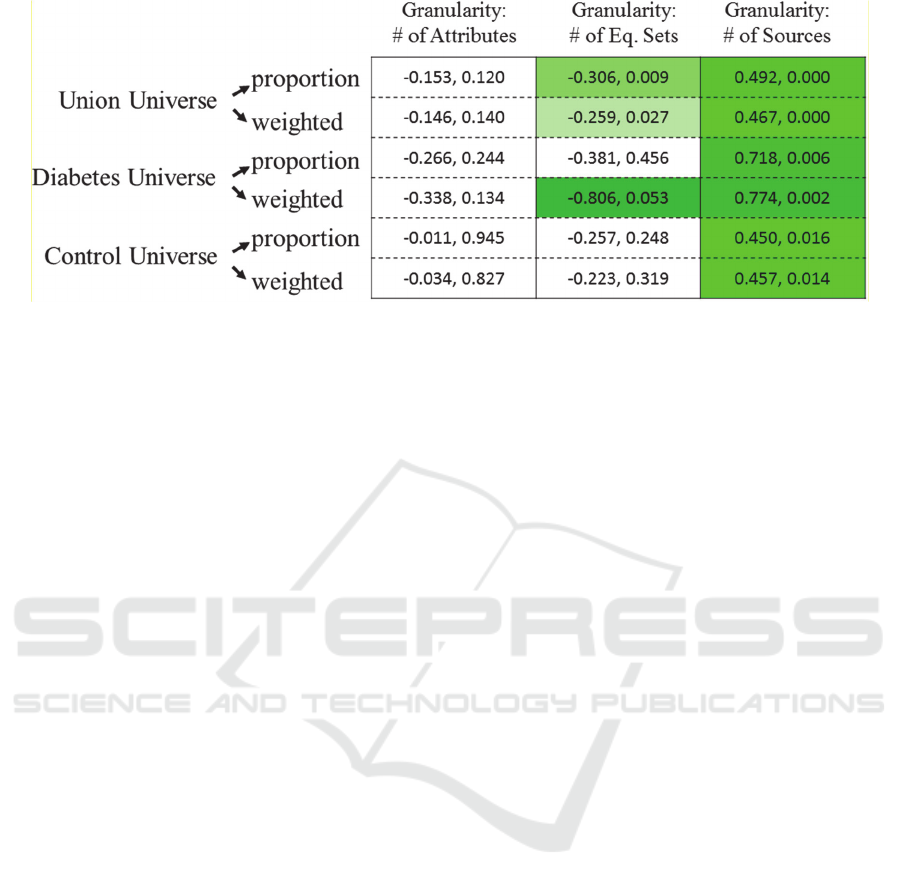
Figure 5: Relationship between Granularity (Aggregation) Definitions and Information Extraction Scores – For each universe
and each information extraction score type, the correlation and p-value between score type and granularity is shown
(correlation, pvalue). Only significant scores are highlighted and the darker the coloring, the higher the correlation value.
3.2 Reactome Enrichment: Overlap
and Unique Contributions
Although the structural aspects of the networks had
low similarity, the biological properties as
determined through Reactome enrichments had
comparatively high overlap. Table 4 shows the
potential enrichment overlap between data sources.
Here, the intersection is divided by the size of the
smaller enrichment size to highlight the low
availability for unique contributions by the smaller
datasets.
For visualization, we examine only the Reactome
enrichments of each PPI network. The unique
enrichments for individual networks would delineate
any source as specific towards an individual
biological domain. Figure 3 shows the unique
Reactome pathway enrichments for each individual
PPI source in the setting of the entire set of human
Reactome pathways. Although the structural
differences between networks are small, unique
pathway enrichments only make up a small
proportion of the total potential pathway space.
Initially, this indicates that any bias that does exist
towards a specific biological condition or theme, is
weak. However, the impact of these biases can only
be examined by segmenting the Reactome hierarchy
into biologically relevant clusters.
The manual grouping of these pathways into
groups of similar function, as shown in Figure 4, does
not distinguish confident unique themes of biological
extraction. Yet a few sets of unique contributions
show significant grouping within the pathway
hierarchy. HPRD highlights gamma carboxylation;
IntAct highlights GAG protein metabolism; and
BioGRID highlights ER to Golgi transport and
single-nucleotide replacement. However, these
tendencies are insufficient to specify particular
granularity for individual PPI data sources. Rather,
they each demonstrate generic pathway enrichment
across the human pathway hierarchy.
3.3 Data Fusion with PPI Sources
Drowns Microarray Conditional
Differences
We compare the differences between control and
diabetic conditions for the microarray networks, the
PPI networks, and the fusion networks. For the
microarray networks, the false-discovery rate
adjustment diminished the interactions and
enrichment so that there are only three differences
between the control and diabetic conditions. The
power and p-value threshold networks showed ten
pathway differences between the control and diabetic
conditions out of 24 total diabetes related pathways.
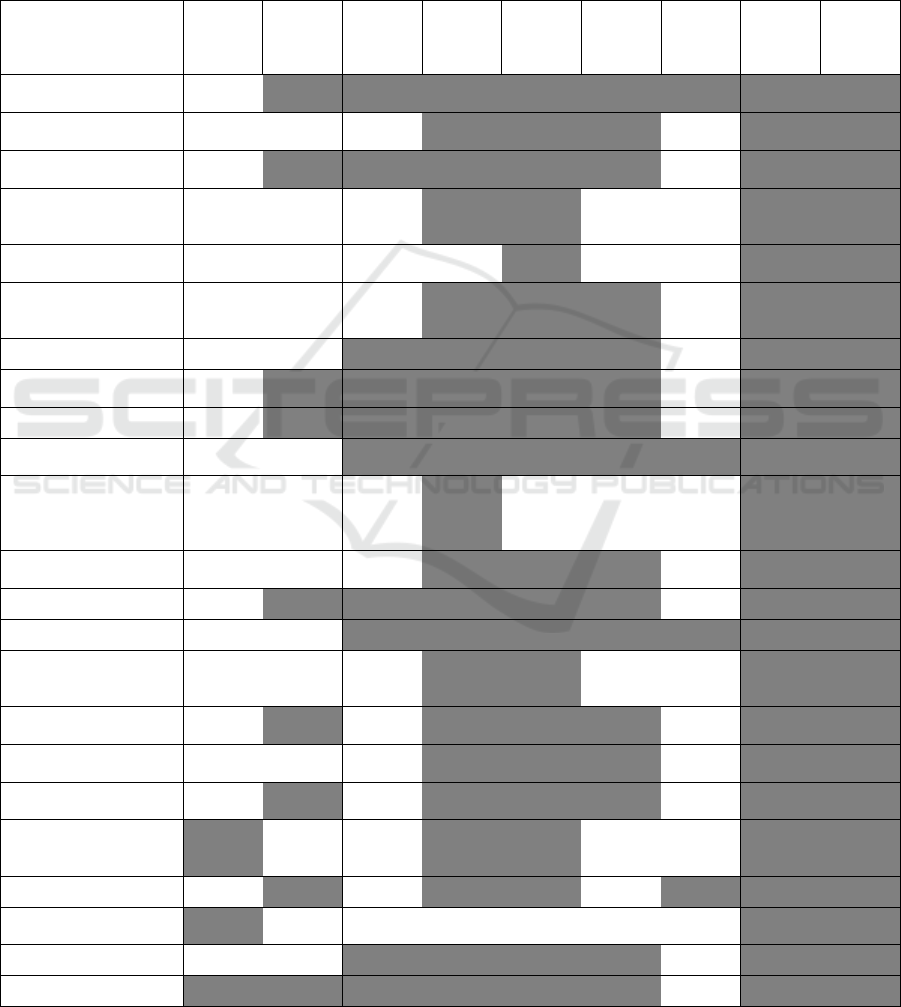
After fusion, the network structure for the FDR
adjusted and the thresholded networks were enriched
for nearly every single available pathway. Table 5
shows these enrichments, only showing 0.05 p-value
adjustment. The ten differences from the microarray
networks are not seen in the fusion networks.
3.4 A Significant Interaction between
Granularity and Information
Extraction Exists
The currently defined universes of predicates and
objects has seven relevant attributes; however, we
remove the “source” attribute as it does not produce
equivalence sets greater than one, leaving 60 total sets
of attributes. A total of 57 equivalence sets were
determined across 7 discrete granularity levels for the
On the Impact of Granularity in Extracting Knowledge from Bioinformatics Data
99
first definition of aggregation granularity, 24 discrete
granularity levels for the second, and 24 for the third.
We found the correlations between the information
extraction scores based on enrichment. Of these, we
found no significant correlations between granularity
and information extraction when using the number of
attributes determining equivalence sets. When using
the number of equivalence sets, half of the correlations
were significant. Finally, when considering the
number of sources as the scale of granularity, each of
the correlations was significant.
Table 5: Pathway Enrichment Network Spectrum.
Micro
Array
Control
0.05 p
Micro
Array
T2D
0.05 p
DIP Bio
GRID
HPRD IntAct MINT Fusion
Control
0.05p
Fusion
T2D
0.05p
Metabolism of lipids
and lipoproteins
PERK regulates gene
expression
Protein processing in
endoplasmic reticulum
Adrenaline,
noradrenaline inhibits
insulin secretion
Calcitonin-like ligand
receptors
Glucagon-like Peptide-
1 (GLP1) regulates
insulin secretion
Signaling by Leptin
Notch signaling
pathway
Wnt signaling pathway
TGF-beta signaling
pathway
Hormone-sensitive
lipase (HSL)-mediated
triacylglycerol
hydrolysis
PPAR signaling
pathway
Cell cycle
p53 signaling pathway
Advanced glycosylation
end-product receptor
signaling
Regulation of insulin
secretion
Unfolded Protein
Response (UPR)
Type II diabetes
mellitus
Diabetes Mellitus,
noninsulin-dependent;
NIDDM
Pancreatic secretion
Maturity onset diabetes
of the young
mTOR signaling
Insulin secretion
BIOINFORMATICS 2016 - 7th International Conference on Bioinformatics Models, Methods and Algorithms
100

4 DISCUSSION
The cascading importance of high confidence
necessary in medical and biological data puts an
emphasis on reproducibility, stability, and sensitivity
of analytical workflows. Due to the complexity of
biological data analysis, results have a high sensitivity
to small changes in parameters, producing results that
are unstable and difficult to reproduce. This concept is
accentuated and expanded in data fusion, granularity
being just a single potential for sensitivity. The data
fusion approach presented here demonstrates the
sensitivity of these biological data towards the various
levels of granularity along two different dimensions.
4.1 Protein-protein Interaction
Database Differences and
Sensitivity
The structural differences between the protein-
protein interaction networks are byproduct of slight
differences in curation methods. Although each PPI
database retrieves their information from the same
population of publications, the knowledge presented
in the databases is different. These curation
differences which lead to vast node and edge network
differences, also lead to different structural or
clustering differences.
Conversely, although the structure of the
networks is sensitive to the curation methods, the
biological enrichment of the networks is not. The
biological enrichment had a relatively large overlap
between databases. Had the creation of the PPI
databases led to significant biological differences, as
a total, they would have represented a higher
granularity. However, as it stands, the small unique
pathway enrichments are not representative of highly
granular data. To address our hypothesis, H1, the
unique biological extractions of the PPI networks do
not represent any apparent biological themes or
conditions.
4.2 Flooding of High Granular Data
through Data Fusion
The promise of data fusion is a more accurate
depiction of biological reality through the
combination of data sources to compensate for
individual source inadequacies. Yet a key component
to data fusion is within its own definition: the
combination of two or more data elements to create a
novel and meaningful data element. “Meaningful” is
vitally important. A good data fusion result captures
a biologically relevant meaning and treats the data
accordingly.
Hypothesis 2 states that the fusion of low and high
granular data sources will remove experimentally
derived information. The union function utilized here,
innately, favors a low granularity. The PPI databases,
created through the union function, result in
“potential” networks. These networks illustrate the
potential of protein interaction partners and structure,
but may not be specific enough to differentiate
specific biological conditions or pathways, and
ultimately as seen in Table 5 the larger PPI databases
capture the majority of this selection of Type 2
Diabetes enrichments. So, the union between high
granularity data, and low granular data initially
created through the union function, results in a low
granularity data set. As with the PPI networks
covering the potential of interaction partners, this
fusion creates a potential of pathways list, making it
impossible to differentiate between experimental
conditions. I.e. the fusion networks do not show
enrichment dissimilarity. In this case, the
experimental specific differences are those which
differentiate the control tissue from the diabetic
tissue. These differences are flooded and unable to be
extracted after fusion.
4.3 Information Extraction Sensitivity
towards Granularity
The third hypothesis, a granularity scale exists in
which aggregation is associated with information
extraction, was not supported by each of the defined
scales of aggregation. The first scale of aggregation,
number of attributes, did not demonstrate any
relationship with information extraction. When
aggregation was defined as the number of
equivalence sets, half of the correlations were
significant. Explicitly, we find that the diabetes
universe and weighted score using this definition of
granularity had the highest correlation out of all the
tested conditions. The lack of significant correlation
in the control universe indicates that these diabetes
data sources are the reason that significant correlation
was found in the overarching universe. We note that,
biologically, diabetic data sources are likely to have
increased diabetic information extraction; however,
the relationship between granularity and information
extraction is not innately evident. Defining
aggregation by the number of equivalence sets is only
satisfactory under certain data source combinations
and a weighted information extraction score.
The final definition of granularity, as the number
of data sources used in the fused network, had a
On the Impact of Granularity in Extracting Knowledge from Bioinformatics Data
101

complete suite of significant correlations. Yet the
diabetic set of data sources carried a higher bias in
generating a strong relationship between granularity
and information extraction. This result defends the
proposition that more available information innately
present in a data fusion indicates a higher potential for
information extraction after the fusion has taken
place.
By supporting the third hypothesis, we suggest
that sensitivity to granularity contributes to the
confidence in the limits of a data fusion function. Yet
the field of data fusion is diverse and we are not
certain that granularity is important for all data fusion
functions, specifically those which may correct for
abstraction or aggregation among sensor
technologies. Further, granularity is a high-level
uncertainty term and can be defined in various ways
beyond the two dimensions suggested in this study.
An intelligent data fusion must consider the biology,
the technology, and the sensitivity of the function to
initial parameters, including granularity, in order to
obtain confidence in its results.
4.4 Generalizability across Biomedical
Data Sources
When conducting multivariate data analysis,
univariate normality does not guarantee multivariate
normality. In the same way, the sensitivities of
individual biomedical data sources, including the
sensitivity to granularity, must be examined in a
multi-modal perspective. We can only speculate to
the sensitivity of biomedical data sources not
included in this study, but we suggest that while
granularity may not be an issue in an individual data
source, data fusion approaches should check for
sensitivity to granularity.
5 CONCLUSIONS
As the technology associated with biomedical
research continues to advance, larger and more
diverse data sources are becoming available to
researchers. Each data source has its own attributes
that influence the way its data can be used or
integrated with other data. As a result, there is a
growing need for sophisticated ways to effectively
integrate different types of biological data and
improve the outcome of using data mining
algorithms. In this study, we proposed several tests
for characterizing granularity within the integration
of protein-protein interaction and gene expression
data using the network model. The results indicate
that using high aggregation of information provides a
context bias that alters the composition of various
substructures in the network and enhances the
significance of the signals obtained from the
integrated networks, under certain conditions. In
addition, abstraction with union data fusion favors
high abstraction information extraction, flooding
condition-specific results.
This study serves as a case study to highlight the
need to study data integration methods further in the
domain of biomedical informatics and explore
different ways to characterize the impact of
uncertainty variables throughout alternate data
integration methodologies. These characterizations
must also include topological information regarding
substructure changes in order to further classify the
relationships among elements in biological networks.
The underlying principle here is that each network
represents a form of an expert system, the more
relevant data incorporated in the network, the more
knowledgeable the network becomes. Yet the
dependency of the extraction of this knowledge is
dependent on data source variables (including
granularity) which impact the topology. In turn,
proper handling of these variables would allow the
researchers to extract more biologically relevant
signals while limiting the impact of noise that will
always be associated with raw biological data.
Ultimately, the attainment of the more useful
biological networks, dependent on the type and
environment of a network or biological replicate, is
contingent on the ability to successfully integrate data
types through characterization of their sensitivities.
REFERENCES
Agarwal, A. K., Xu, T., Jacob, M. R., Feng, Q., Lorenz, M.
C., Walker, L. A., & Clark, A. M. (2008). Role of heme
in the antifungal activity of the azaoxoaporphine
alkaloid sampangine. Eukaryotic cell, 7(2), 387-400.
Bindea, G., Mlecnik, B., Hackl, H., Charoentong, P.,
Tosolini, M., Kirilovsky, A., Fridman, W., Pages, F.,
Trajanoski, Z., & Galon, J. (2009). ClueGO: a
Cytoscape plug-in to decipher functionally grouped
gene ontology and pathway annotation networks.
Bioinformatics, 25(8), 1091-1093.
Bittner, T., & Smith, B. (2003). A theory of granular
partitions. Foundations of geographic information
science, 7, 124-125.
Bittner, T., Donnelly, M., & Smith, B. (2004, November).
Individuals, universals, collections: On the
foundational relations of ontology. In Proceedings of
the Third Conference on Formal Ontology in
Information Systems (pp. 37-48).
BIOINFORMATICS 2016 - 7th International Conference on Bioinformatics Models, Methods and Algorithms
102

Bossi, A., & Lehner, B. (2009). Tissue specificity and the
human protein interaction network. Molecular systems
biology, 5(1).
Ceol, A., Aryamontri, A. C., Licata, L., Peluso, D.,
Briganti, L., Perfetto, L., ... & Cesareni, G. (2009).
MINT, the molecular interaction database: 2009
update.Nucleic acids research, gkp983.
Chatr-aryamontri, A., Breitkreutz, B. J., Heinicke, S.,
Boucher, L., Winter, A., Stark, C., Nixon, J., Ramage,
L., … & Tyers, M. (2013). The BioGRID interaction
database: 2013 update. Nucleic acids research, 41(D1),
D816-D823.
Greer, J. E., & McCalla, G. I. (1989, August). A
Computational Framework for Granularity and its
Application to Educational Diagnosis. In IJCAI (pp.
477-482).
Halevy, A., Rajaraman, A., & Ordille, J. (2006, September).
Data integration: the teenage years. In Proceedings of
the 32nd international conference on Very large data
bases (pp. 9-16). VLDB Endowment. Bowman, M.,
Debray, S. K., and Peterson, L. L. 1993. Reasoning
about naming systems. ACM Trans. Program. Lang.
Syst. 15, 5 (Nov. 1993), 795-825.
Hanisch, D., Zien, A., Zimmer, R., & Lengauer, T. (2002).
Co-clustering of biological networks and gene
expression data. Bioinformatics, 18(suppl 1), S145-
S154.
Hobbs, J. R. (1985). Granularity. In In Proceedings of the
Ninth International Joint Conference on Artificial
Intelligence.
Hobbs, J. R. (1995). Sketch of an ontology underlying the
way we talk about the world. International journal of
human-computer studies, 43(5), 819-830.
Ingram, P. J., Stumpf, M. P., & Stark, J. (2006). Network
motifs: structure does not determine function. BMC
genomics, 7(1), 108.
Jiang, P., & Singh, M. (2010). SPICi: a fast clustering
algorithm for large biological networks. Bio
informatics, 26(8), 1105-1111.
Kashani, Z. R., Ahrabian, H., Elahi, E., Nowzari-Dalini, A.,
Ansari, E. S., Asadi, S., ... & Masoudi-Nejad, A.
(2009). Kavosh: a new algorithm for finding network
motifs. BMC bioinformatics, 10(1), 318.
Kerrien, S., Aranda, B., Breuza, L., Bridge, A., Broackes-
Carter, F., Chen, C., ... & Hermjakob, H. (2011). The
IntAct molecular interaction database in 2012.Nucleic
acids research, gkr1088.
Liu, Z., Cao, J., Gao, X., Zhou, Y., Wen, L., Yang, X.,
Xuebiao, Y., Ren, J., & Xue, Y. (2011). CPLA 1.0: an
integrated database of protein lysine
acetylation. Nucleic acids research, 39(suppl 1),
D1029-D1034.
McCalla, G., Greer, J., Barrie, B., & Pospisil, P. (1992).
Granularity hierarchies.Computers & Mathematics
with Applications, 23(2), 363-375.
Medintz, I. L., Vora, G. J., Rahbar, A. M., & Thach, D. C.
(2007). Transcript and proteomic analyses of wild-type
and gpa2 mutant Saccharomyces cerevisiae strains
suggest a role for glycolytic carbon source sensing in
pseudohyphal differentiation. Molecular BioSystems,
3(9), 623-634.
Obayashi, T., & Kinoshita, K. (2009). Rank of correlation
coefficient as a comparable measure for biological
significance of gene coexpression. DNA research,
16(5), 249-260.
Pawlak, Zdzisław (1982). "Rough sets". International
Journal of Parallel Programming 11 (5): 341–
356.doi:10.1007/BF01001956.
Prasad, T. K., Goel, R., Kandasamy, K., Keerthikumar, S.,
Kumar, S., Mathivanan, S., ... & Pandey, A. (2009).
Human protein reference database—2009
update. Nucleic acids research, 37(suppl 1), D767-
D772.
Rector, A., Rogers, J., & Bittner, T. (2006). Granularity,
scale and collectivity: when size does and does not
matter. Journal of biomedical informatics, 39(3), 333-
349.
Rhee, S. Y., Wood, V., Dolinski, K., & Draghici, S. (2008).
Use and misuse of the gene ontology
annotations. Nature Reviews Genetics, 9(7), 509-515.
Salwinski, L., Miller, C. S., Smith, A. J., Pettit, F. K.,
Bowie, J. U., & Eisenberg, D. (2004). The database of
interacting proteins: 2004 update.Nucleic acids
research, 32(suppl 1), D449-D451.
Słowiński, R., Greco, S., & Matarazzo, B. (2014). Rough-
set-based decision support. In Search
Methodologies (pp. 557-609). Springer US.
Sun, B., & Ma, W. (2015). Multigranulation rough set
theory over two universes. Journal of Intelligent &
Fuzzy Systems: Applications in Engineering and
Technology, 28(3), 1251-1269.
Taneera J, Lang S, Sharma A, Fadista J et al. A systems
genetics approach identifies genes and pathways for
type 2 diabetes in human islets. Cell Metab2012 Jul
3;16(1):122-34. PMID: 22768844.
Thorne, T., & Stumpf, M. P. (2007). Generating confidence
intervals on biological networks. BMC bioinfo, 8(1),
467.
Veres, D. V., Gyurkó, D. M., Thaler, B., Szalay, K. Z.,
Fazekas, D., Korcsmáros, T., & Csermely, P. (2014).
ComPPI: a cellular compartment-specific database for
protein–protein interaction network analysis. Nucleic
acids research, gku1007.
Vogt, L., Grobe, P., Quast, B., & Bartolomaeus, T. (2012).
Accommodating ontologies to biological reality–top-
level categories of cumulative-constitutively organized
material entities. PLoS One, 7(1), e30004.
Xu, T., Feng, Q., Jacob, M. R., Avula, B., Mask, M. M.,
Baerson, S. R., ... & Agarwal, A. K. (2011). The marine
sponge-derived polyketide endoperoxide plakortide F
acid mediates its antifungal activity by interfering with
calcium homeostasis. Antimicrobial agents and
chemotherapy, 55(4), 1611-1621.
Zhang, B., & Horvath, S. (2005). A general framework for
weighted gene co-expression network analysis.
Statistical applications in genetics and molecular
biology, 4(1), 1128.
On the Impact of Granularity in Extracting Knowledge from Bioinformatics Data
103
