
Processing Magnetic Resonance Image Features with One-class
Support Vector Machines
Investigation of the Autism Spectrum Disorder Heterogeneity
Ilaria Gori
1,2
, Alessia Giuliano
1,3
, Piernicola Oliva
2,4
, Michela Tosetti
5
, Filippo Muratori
5
,
Sara Calderoni
5
and Alessandra Retico
1
1
Istituto Nazionale di Fisica Nucleare, Sezione di Pisa, Pisa, Italy
2
Dipartimento di Chimica e Farmacia, Università di Sassari, Sassari, Italy
3
Dipartimento di Fisica, Università di Pisa, Pisa, Italy
4
Istituto Nazionale di Fisica Nucleare, Sezione di Cagliari, Monserrato, Italy
5
IRCCS Stella Maris, Pisa, Italy
Keywords: Image Processing, Feature Classification, One-class Support Vector Machine, Brain Magnetic Resonance
Imaging (MRI), Autism Spectrum Disorders.
Abstract: Support Vector Machine (SVM) classifiers are widely used to analyse features extracted from brain MRI
data to identify useful biomarkers of pathology in several disease conditions. They are trained to distinguish
patients from healthy control subjects by making a binary classification of image features extracted by
image processing algorithms. This task is particularly challenging when dealing with psychiatric disorders,
as the reported neuroanatomical alterations are often very small and quite un-replicated within different
studies. Subtle signs of pathology are difficult to catch especially in extremely heterogeneous conditions
such as Autism Spectrum Disorders (ASD). We propose the use of the One-Class Classification (OCC) or
Data Description method that, in contrast with two-class classification, is based on a description of one class
of objects only. Then, new examples are tested for their similarity to the examples of this target class, end
eventually considered as outliers. The application of the OCC to features extracted from brain MRI of
children affected by ASD and control subjects demonstrated that a common pattern of features characterize
the ASD population.
1 INTRODUCTION
Several post-processing methods to analyse brain
Magnetic Resonance Imaging (MRI) data have been
developed and implemented so far to obtain
diagnostic models of pathology and useful disease
biomarkers. Machine-learning techniques, e.g. those
based on support vector machines (SVMs) (Vapnik,
1995), have been shown to be valuable tools to make
predictive diagnoses in single subjects in a large
variety of diseases. They can be implemented for
diagnosis prediction, to assess the disease
progression and to evaluate the treatment
effectiveness (Orrù et al., 2012). Conventional
binary (also called two-class) classification
algorithms are applied in most cases. They aim to
classify an unknown object into one of two pre-
defined categories. In the present study we propose
the use of the One-Class Classification (OCC) or
Data Description method (Moya et al., 1993), which,
in contrast to two-class classification, makes a
description of one training class of objects (referred
to as the positive class or target class) and detects
which (new) objects resemble this target class, thus
distinguishing them from examples considered
outliers. Using OCC in standard binary classification
problems, where objects from both the two classes
are at disposal, could result in worse recognition
accuracy, as the complete knowledge encoded in the
available training set is not fully exploited. However,
OCC could provide more robustness in case of
difficulties embedded in the nature of data, since
they seek to describe properties of the target class
instead of minimizing the classification error.
Gori, I., Giuliano, A., Oliva, P., Tosetti, M., Muratori, F., Calderoni, S. and Retico, A.
Processing Magnetic Resonance Image Features with One-class Support Vector Machines - Investigation of the Autism Spectrum Disorder Heterogeneity.
DOI: 10.5220/0005776001110117
In Proceedings of the 9th International Joint Conference on Biomedical Engineering Systems and Technologies (BIOSTEC 2016) - Volume 2: BIOIMAGING, pages 111-117
ISBN: 978-989-758-170-0
Copyright
c
2016 by SCITEPRESS – Science and Technology Publications, Lda. All rights reserved
111
Table 1: Dataset composition and sample characteristics. Abbreviations: ASD, autism spectrum disorders; NVIQ, non-
verbal intelligence quotient; std, standard deviation.
Variable Subject group, mean ± std [range]
Age (months)
ASD (n=41) Controls (n=40)
49 ± 12 [28-70] 49 ± 14 [24-72]
NVIQ 73 ± 22 [34-113] 73 ± 22 [31-113]
Males (n=21) Females (n=20) Males (n=20) Females (n=20)
Age (months) 50 ± 10 [34-70] 48 ± 13 [28-69] 48 ± 13 [24-70] 50 ± 16 [22-72]
NVIQ 75 ± 22 [40-113] 70 ± 23 [34-113] 73 ± 23 [32-123] 71 ± 24 [31-106]
As a case study, we focused on the analysis of
brain features extracted from MRI data of children
affected by Autism Spectrum Disorders (ASD),
which are complex developmental neuropsychiatric
conditions affecting 1 in 68 children in USA (CDCP,
2014), and characterized by impairment in socio-
communicative abilities, as well as restricted and
stereotyped behaviours. Different approaches have
been proposed to date to explore the genetic, clinical
and neurobiological heterogeneity of ASD. Several
studies aimed to explore the predictive power of
MRI data, to find reliable ASD markers (Ecker et al.,
2010; Jiao et al., 2010; Ingalhalikar et al., 2011;
Calderoni et al., 2012; Zhou et al., 2014; Gori et al.,
2015; Retico et al., 2015).
We propose the implementation of OCC to
region-based characteristics extracted from
structural MRI brain data, in order to measure their
performance in the discrimination of patients with
ASD with respect to controls in the preschool age.
Moreover, we investigate the distribution of
“normal” patterns of brain structure to test its
homogeneity and its potential to enable the
definition of a robust boundary in relation to which
the patients with ASD are classified as outliers.
Should it not be the case, a consistent
neuroanatomical pattern among the ASD patients
would be investigated. Finally, the relative
contribution of the considered brain features to the
decision function is studied to identify the
neuroanatomical regions more involved in the OCC
boundary definition.
2 MATERIALS AND METHODS
2.1 Samples of Subjects and MRI Data
Acquisition
A group of 21 male and 20 female pre-schoolers
with ASD [mean age ± standard deviation = 49 ± 12
months; age range = 28 – 70 months] and a group of
40 control subjects matched by gender, age, non-
verbal IQ (NVIQ), and socioeconomic status were
selected for this case-control study (see Table 1).
Participants in the ASD group were recruited in the
ASD Unit of IRCCS Stella Maris Foundation (Pisa),
a tertiary hospital and research university in Italy.
The control group was composed of 20 pre-
schoolers with idiopathic intellectual disability (ID),
and 20 pre-schoolers without intellectual disability
(noID). Subjects with ID were included within the
control group in order to obtain a match for NVIQ
between patients and controls. T1-weighted MRI
data with voxel size of 1.1x1.1x1.1 mm
3
were
acquired using a GE 1.5 T Signa Neuro-optimized
System (General Electric Medical Systems).
2.2 Data Preprocessing and Feature
Extraction
The preprocessing of the entire data set included the
volumetric segmentation and cortical reconstruction
by the Freesurfer image analysis suite version 5.1.0,
(http://freesurfer.net/; Fischl et al., 2004). In the
cortical parcellation step, neuroanatomical labels
were assigned to each location on the cortical
surface according to the Desikan–Killiany–Tourville
(DKT) cortical atlas, which divides the cerebral
cortex into 62 structures (31 structures per
hemisphere) (Klein and Tourville, 2012). The
following 5 surface-based features for each structure
are computed: Area (white surface area in mm
2
);
Vo lu me (gray matter volume in mm
3
); Thickness
(average cortical thickness in mm); ThicknessStd
(standard deviation of cortical thickness in mm);
Mean-Curv (integrated rectified mean curvature in
mm
-1
). We remark that the Volume is computed
according to a surface-based method, as the average
of the white and pial surface areas, multiplied by the
cortical thickness. In addition we considered the
White Surface Total Area (in mm
2
) and the Mean
Thickness (in mm) of the cortex in the two
hemispheres, thus obtaining a vector of 314
characteristics for each subject.
BIOIMAGING 2016 - 3rd International Conference on Bioimaging
112

2.3 One-class Feature Classification
Among conventional binary classification
algorithms, Support Vector Machines (SVM) are
quite extensively applied tools (Vapnik, 1995). They
are a supervised binary classification method that
requires a training set of labeled input examples to
learn the differences between the two sample
classes, and a labeled test set to quantify the
classification performance.
In the context of classification of brain images,
each input example is a vector x of features
extracted by each input image. The label y
associated to each input example indicates its
membership, e.g. “1” for vectors belonging to the
patients class, “-1” for controls. Basically, during the
training phase an optimization problem is solved to
identify the largest-margin hyperplane allowing for
an optimal separation of the two classes. The input
vectors contributing to the definition of the
separating hyperplane are called support vectors.
Since data are generally not linearly separable a
regularization parameter C is introduced to control
the trade-off between the number of training errors
and the generalization ability of the classifier. It is
usually set using heuristics or tuned using cross-
validation procedures.
The SVM can then predict the classification of
an unlabeled input vector by checking on which side
of the separating hyperplane the example lies. The
SVM belong to the class of kernel methods, which
depend on data only through dot products. To
achieve good separation results even in case of non-
linearly separable classes, the dot product can be
replaced by a kernel function, which computes a dot
product in some (possibly) higher dimensional
feature space. This allows carrying out a linear
classification in this feature space, without explicitly
mapping in such a feature space the original
observations. The separating hyperplane found in the
feature space corresponds to a non-linear boundary
in the input space. In this case, the prediction of the
class membership of an unlabeled input vector is
performed by mapping it into the feature space, and
checking on which side of the separating hyperplane
the example lies. Among the non-linear kernel
functions the Radial Basis Function (RBF) Kernel is
the most popular. It depends on the Euclidean
distance between the examples and is defined as
(
,
)
= exp(−|| −
||
). The parameter γ
determines the smoothness of the boundary (in the
input space). Like the regularization parameter C,
also this parameter γ is usually set using heuristics or
tuned using cross-validation procedures.
Schölkopf et al., (2000) presented a new
formulation of two-class SVM, where the C
parameter was removed and replaced with a new
parameter ν with a more natural interpretation: it is
an upper bound to the fraction of misclassification
and margin errors and a lower bound on the fraction
of support vectors. For certain parameter settings,
the results of this new algorithm coincide with the
conventional one. Moreover, desirable properties of
previous SVM algorithms are retained. Schölkopf et
al., (2001) modified the previous approach to
address the OCC problem and called the new
algorithm single-class SVM. During the training
phase of a single-class SVM, a hyperplane is placed
such that it separates the target set from the origin
with maximal margin. Similarly to the standard two-
class SVM, when a more flexible data description is
required, an implicit mapping of the data into
another (possibly high dimensional) feature space is
defined, such that the dot product in this feature
space can be computed by evaluating a simple
kernel function. An ideal kernel function would map
the target examples onto a bounded, spherically
shaped area in the feature space and outlier objects
outside this area. The single-class SVM attributes a
new point x to the target or the outlier class by
evaluating which side of the hyperplane it falls on in
feature space. As in two-class algorithm, the
regularization parameter ν
∈
(0, 1] has to be set. It
can be interpreted as an upper bound on the fraction
of training points outside the estimated region, and a
lower bound on the fraction of support vectors.
In this work, we applied single-class SVM with
RBF kernel to the vector of 314 characteristics
extracted for each subject of our datasets. We
performed the single-class classification separately
on the male subset, on the female subset and on the
entire dataset (see Figure 1).
In the linear-kernel classifiers, the entries of the
vector w can be directly considered as the relative
weights of each characteristic for the decision
function (Gori et al., 2015). Conversely, in the non-
linear case (e.g. with the RBF kernel), the
interpretation of the vector w is non-intuitive, since
the separating hyperplane is obtained in the feature
space. We used the approach proposed by Schölkopf
et al., (1999) to approximate the preimages for the
single-class SVM with RBF kernel.
Additionally, to understand which features and
which neuroanatomical regions drive the SVM
boundary definition, we tailored the permutation
testing method (Gori et al., 2015; Gaonkar and
Davatzikos, 2013; Wanh et al., 2007; Mourão-
Miranda et al., 2005) to the case of OCC.
Processing Magnetic Resonance Image Features with One-class Support Vector Machines - Investigation of the Autism Spectrum Disorder
Heterogeneity
113
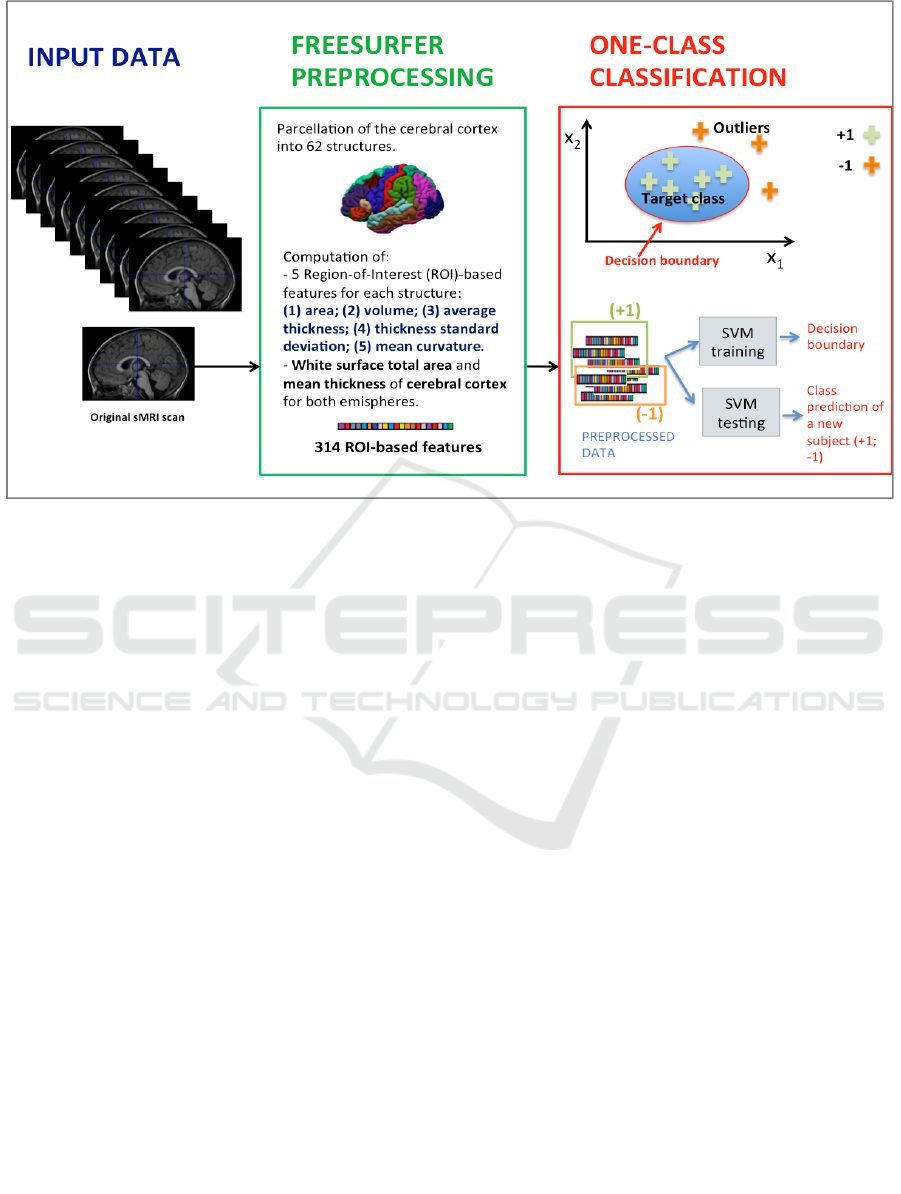
Figure 1: Schematic representation of analysis method. The regional features are extracted from brain sMRI scan of each
subject using Freesurfer software. Then, the collected sets of features are classified with one-class SVM applying the LPO-
CV procedure. Abbreviations: sMRI, structural Magnetic Resonance; ROI, Region Of Interest.
The performance of the SVM classifiers is evaluated
in terms of the sensitivity and the specificity,
computed by varying the classifier decisional
threshold. These values can be represented in a
curve known as Receiver Operating Characteristic
(ROC) curve (Metz, 2006). The area under the
ROC curve (AUC) is a global index to compare the
performance of different classifiers. To ensure an
unbiased estimate of the OCC SVM performance we
implemented a cross-validation (CV) procedure,
leaving one pair of subjects out at each iteration
(LPO-CV). The difference with respect to a CV
procedure to evaluate binary classification
performance lies only in the training step: we simply
trained the OCC on only one class (target class)
inside the CV, and tested it on the subset of both
classes left out for testing.
3 RESULTS
The Freesurfer pipeline was applied to preprocess
the MRI of each subject. Patients with ASD and
controls were matched on age and NVIQ. To train
and test OCC we used RapidMiner
(http://rapidminer.com/) advanced analytics platform
version 5.3, which includes the single-class SVM as
a part of the LibSVM operator.
We first performed single-class classification by
setting ν=0.1 and γ using heuristics (i.e. as the
inverse of the number of features). Then, we carried
out the optimization of the parameters ν and γ,
within nested LPO-CV loops.
The intuitive approach for transforming a binary
discrimination problem into a single-class task in the
context of highly heterogeneous conditions like
ASD is to use the control class as target class,
figuring that it could enable the definition of a robust
boundary, in relation to which the ASD patients
would be classified as outliers. Consequently, we
first trained a single-class SVM by considering only
control examples to form the decision boundary,
thus discarding information about the ASD class
during the training phase. This would be the optimal
approach if the control class had characteristics of
homogeneity, since the single-class SVM could
capture the control class structure, by adjusting itself
to its properties. This would allow recognizing ASD
examples as outliers, even in case the available ASD
sample is not representative of the real ASD
population, due to the extreme ASD heterogeneity.
However, the results obtained in this case in terms of
AUC were not above the chance level.
Therefore, we repeated the same procedure using
the ASD patient group as the target class to
investigate whether there was a consistent
BIOIMAGING 2016 - 3rd International Conference on Bioimaging
114
neuroanatomical pattern among the ASD patients in
relation to which the controls would be classified as
outliers. The performance achieved by optimizing
the parameters ν and γ was: AUC=0.74 for the male
subset, AUC= 0.68 for the female subset and
AUC=0.64 for the entire dataset.
These results show that the control class does not
have characteristics of homogeneity allowing
recognizing ASD examples as outliers.
Conversely, there is a common structure among
the ASD patients that the single-class SVM could
capture.
We also found a slight performance decrease
when estimating the OCC performance on the entire
dataset, which is not surprising and we ascribed it to
the introduction of the gender as an additional
heterogeneity factor.
In order to evaluate the potential of single-class
SVM with respect to the primary aim of this work,
that is the discrimination of ASD versus controls, we
carried out also the two-class SVM classification
with linear and RBF kernels. The results we
achieved were: AUC of 0.74 for males and 0.58 for
females by using the linear kernel classification, and
0.68 for male subset and 0.65 for females adopting
the RBF kernel.
To understand which of the 314 characteristics
(i.e. which brain regions and which of the 5
computed features) are the most relevant to the
single-class SVM boundary definition, we trained a
OCC SVM with RBF kernel using all the ASD
patient group as the target class (with ν=0.1 and
heuristic γ) and we applied the algorithm proposed
in Schölkopf et al., (1999) to generate the preimage
vector z. Then, we carried out a permutation testing
procedure in the training phase originally tailored to
the OCC with 10000 iterations and with ν=0.1 and
heuristic γ, separately for the male subset, the female
subset and the entire dataset.
We used the Matlab (The MathWorks, Inc.)
interface to the LIBSVM package
(http://www.csie.ntu.edu.tw/~cjlin/libsvm/) to train
the OCC in the permutation testing procedure and
the Statistical Pattern Recognition Toolbox
(http://cmp.felk.cvut.cz/cmp/software/stprtool/index.
html) for Matlab (STPRTool) to generate the
preimage.
We show in Figure 2 the brain regions most
contributing to the definition of the OCC boundary,
as resulting from the permutation test, for male and
female subsets, respectively. For the male
population the regions visible in Figure 2(a,c) are:
left (L) and right (R) medial orbito frontal cortices,
L pars triangularis, R pars opercularis, middle
temporal cortex and R insula. For the female
population the regions visible in Figure 2(b,d) are: L
and
R caudate anterior cingulate, pars opercularis,
posterior cingulated, cuneus; R pars triangularis
postcentral gyrus, superior temporal cortex and
superior parietal cortex. They are mostly among the
network of structural brain alterations widely
reported in the population with ASD, including
frontal and temporal areas.
Thus, despite the phenotypical heterogeneity in
ASD a common neuroanatomical profile that
underlies the core features could be detected with
the OCC SVM approach.
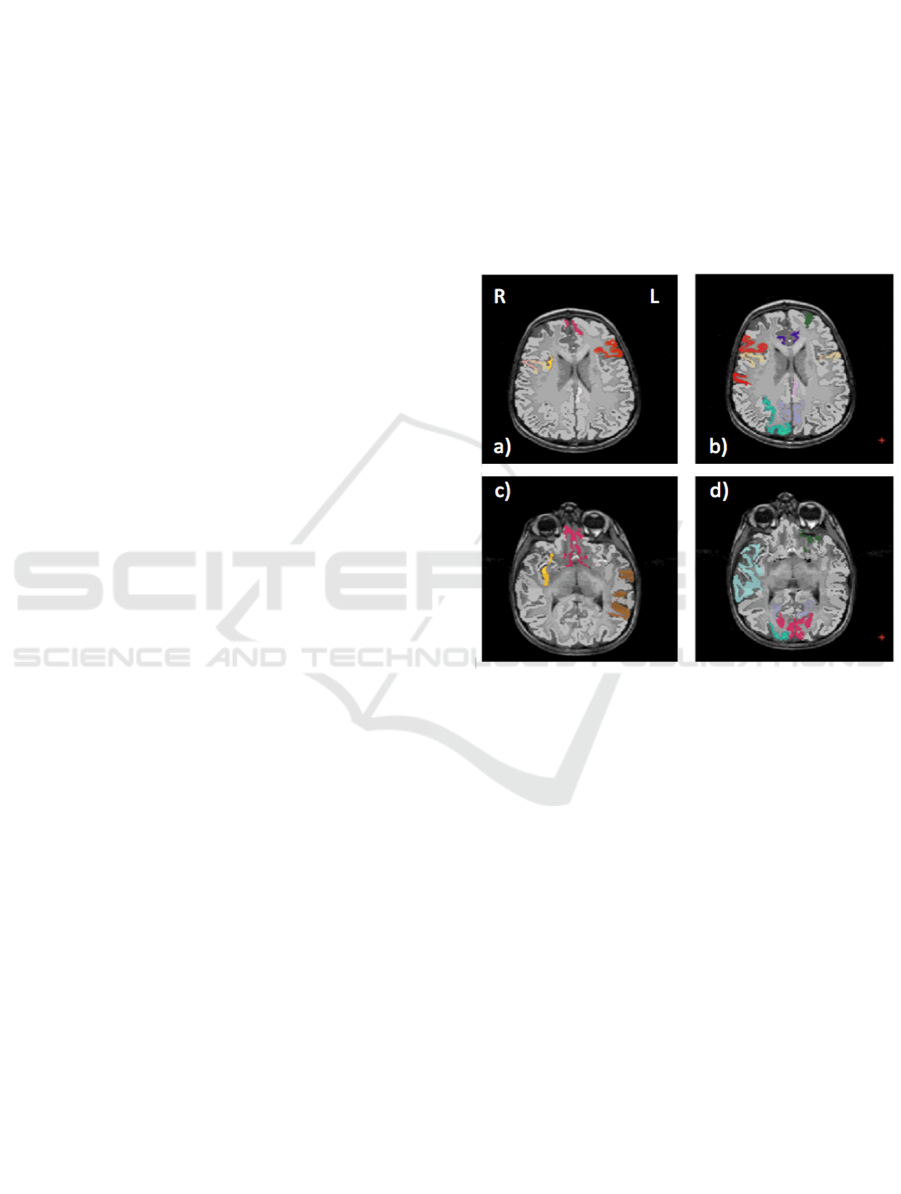
Figure 2. Brain region most contributing to the definition
of the OCC boundary. For the male population the regions
visible in a) and c) are: left (L) and right (R) medial orbito
frontal cortices (pink), L pars triangularis (red), R pars
opercularis (mustard), middle temporal cortex (brown) and
R insula (yellow). For the female population the regions
visible in b) and d) are: L and R caudate anterior cingulate
(violet), pars opercularis (mustard), posterior cingulate
(light violet), cuneus (magenta); R pars triangularis and
postcentral gyrus (red), superior temporal cortex (light
blue), superior parietal cortex (cyan).
4 CONCLUSIONS
The usefulness of OCC in the biomedical domain
was already proved in a number of applications,
including in the domain of psychiatric disorders
(Mourão-Miranda et al., 2011). However, to the best
of our knowledge, we propose the first application of
OCC to the analysis of MRI data of patients with
ASD.
The aim of this work was to apply OCC not only
Processing Magnetic Resonance Image Features with One-class Support Vector Machines - Investigation of the Autism Spectrum Disorder
Heterogeneity
115

to measure its performance in the discrimination of
ASD versus controls, but also to investigate whether
the distribution of “normal” patterns of brain
structure is enough homogeneous to enable the
definition of a robust boundary, in relation to which
the patients with ASD can be classified as outliers.
As an alternative, a consistent pattern among the
patients with ASD will provide a boundary in
relation to which the controls are classified as
outliers. The latter hypothesis was confirmed by our
results. We found out evidence that the control group
is more heterogeneous and therefore the hypersphere
or decision boundary enclosing most of the controls
contains data in the ASD range. Vice versa, the ASD
group shows a common structure that the SVM OCC
could capture.
The present work is a proof of concept that the
OCC framework can be applied to neuroimaging
data to investigate if consistent patterns of
alterations do exist even in heterogeneous
populations. Despite the results we found need to be
confirmed against a larger population, the approach
we present here is a preliminary step aiming to set
up a strategy to identify common altered features in
specific disorders.
ACKNOWLEDGEMENTS
This work has been partially founded by the Italian
Ministry of Health and the Tuscany Government
(GR2317873, PI: S. Calderoni) and by the National
Institute of Nuclear Physics (nextMR project).
REFERENCES
Calderoni, S., Retico, A., Biagi, L., Tancredi, R.,
Muratori, F., Tosetti, M., 2012. Female children with
autism spectrum disorder: an insight from mass-
univariate and pattern classification analyses.
Neuroimage, 59:1013-1022.
Centers for Disease Control and Prevention, CDCP, 2014.
Prevalence of ASD, MMWR, 63:1-22.
Ecker, C., Marquand, A., Mourão-Miranda, J., Johnston,
P., Daly, E. M., Brammer, M. J., Maltezos,
S., Murphy, C. M., Robertson, D., Williams, S.
C., Murphy, D. G., 2010. Describing the brain in
autism in five dimensions—magnetic resonance
imaging-assisted diagnosis of autism spectrum
disorder using a multiparameter classification
approach. J Neurosci ,30: 10612-10623.
Fischl, B., ,vanderKouwe, A., Destrieux, C., et al, 2004.
Automatically parcellating the human cerebral cortex.
Cereb Cortex, 14: 11-22.
Gaonkar, B., Davatzikos, C., 2013. Analytic estimation of
statistical significance maps for support vector
machine based multi-variate image analysis and
classification. Neuroimage, 78: 270–283.
Gori, I., Giuliano, A., Muratori, F., Saviozzi, I., Oliva, P.,
Tancredi, R., Cosenza, A., Tosetti, M., Calderoni, S.,
Retico, A., 2015. Gray Matter Alterations in Young
Children with Autism Spectrum Disorders: Comparing
Morphometry at the Voxel and Regional Level. J
Neuroimaging, 25(6):866-74. doi: 10.1111/jon.12280.
Ingalhalikar, M., Parker, D., Bloy, L., Roberts, T. P.,
Verma, R., 2011. Diffusion based abnormality
markers of pathology: toward learned diagnostic
prediction of ASD. Neuroimage, 57:918-927.
Jiao, Y., Chen, R., Ke, X., Ch,u K., Lu, Z., Herskovits, E.
H., 2010. Predictive models of autism spectrum
disorder based on brain regional cortical thickness.
Neuroimage, 50:89-599.
Klein, A., Tourville, J., 2012. 101 labeled brain images
and a consistent human cortical labeling protocol.
Front Neurosci, 6:171.
Metz, C. E., 2006. Receiver operating characteristics
analysis: a tool for the quantitative evaluation of
observer performance and imaging systems. J Am
Coll Radiol, 3:413-422.
Mourão-Miranda, J., Bokde, A. L., Born, C., Hampel, H.,
Stetter, M., 2005. Classifying brain states and
determining the discriminating activation patterns:
Support Vector Machine on functional MRI data.
Neuroimage, 28(4):980-95.
Mourão-Miranda, J., Hardoon, D. R., Hahn, T., Marquand,
A. F., Williams, S. C., Shawe-Taylor, J., Brammer,
M., 2011. Patient classification as an outlier detection
problem: An application of the One-Class Support
Vector Machine. Neuroimage, (3-4):793-804.
doi:10.1016/j.neuroimage.2011.06.042.
Moya, M., Koch, M., & Hostetler, L., 1993. One-class
classifier networks for target recognition applications.
In Proceedings World Congress on Neural Networks,
797–801. Portland, OR: International Neural Network
Society.
Orrù, G., Pettersson-Yeo, W., Marquand, A.F., et al.,
2012. Using support vector machine to identify
imaging biomarkers of neurological and psychiatric
disease: a critical review. Neurosci Biobehav Rev
36(4):1140-1152.
Retico, A., Tosetti, M., Muratori, F., Calderoni, S, 2015.
Neuroimaging-based methods for autism
identification: a possible translational application?
Functional Neurology CIC Edizioni Internazionali,
29(4):231-239. ISSN:0393-5264.
Schölkopf, B., Mika, S., Burges, C. C., Knirsch, P.,
Müller, K. R., Rätsch, G., Smola, A. J., 1999. Input
space versus feature space in kernel-based methods.
IEEE Trans Neural Netw, 10(5):1000-17.
Schölkopf, B., Smola, A., J., Williamson, R., Barlett, P.
L., 2000. New Support Vector Algorithms, Neural
Computation, 12:1207-1245.
Schölkopf, B., Platt, J., Shawe-Taylor, J. A. S.,
Williamson, R., 2001. Estimating the support of a
BIOIMAGING 2016 - 3rd International Conference on Bioimaging
116

high-dimensional distribution. Neural Computation,
13:7.
Vapnik, V., 1995. The nature of Statistical Learning
Theory, Berlin.
Wanh, Z., Childress A. R., Wang, J., Detre, J. A., 2007.
Support vector machine learning-based fMRI data
group analysis. Neuroimage, 36(4):1139-51.
Zhou, Y., Yu, F., Duong, T., 2014. Multiparametric MRI
Characterization and Prediction in Autism Spectrum
Disorder Using Graph Theory and Machine Learning.
PLoS ONE 9(6): e90405.
Processing Magnetic Resonance Image Features with One-class Support Vector Machines - Investigation of the Autism Spectrum Disorder
Heterogeneity
117
