
Diagnostics of Optic Nerve Head Pathologies using Structural
Analysis of Eye Ultrasound B-scan Images
A. Kriščiukaitis
1,3
, V. Valuckis
2
, A. Kybartaitė-Žilienė
1
and L. Kriaučiūnienė
4
1
Neuroscience Institute, Lithuanian University of Health Sciences, Kaunas, Lithuania
2
Biomedical Engineering Institute, Kaunas University of Technology, Kaunas, Lithuania
3
Department of Physics, Mathematics and Biophysics, Lithuanian University of Health Sciences, Kaunas, Lithuania
4
Department of Ophthalmology of Hospital of Lithuanian University of Health Sciences, Kaunas, Lithuania
Keywords: Eye B-scan Image, Structural Image Analysis, Optic Nerve Head, Drusen.
Abstract: Optic nerve head drusen are congenital and developmental anomalies in a form of calcific degeneration in
some of axons of the optic nerve head. Diagnostic difficulties may be encountered when drusen are buried
deep within the nerve tissue in the optic nerve head, as they can resemble optic disc swelling or other
pathologies. Diagnosing optical disc drusen correctly is important to avoid unnecessary work-up and to
avoid overlooking potential serious conditions such as true papilledema. We propose the method based on
structural analysis of the eye B-scan images combined with mathematical morphology to reveal valuable
estimates reflecting pathogenic changes in the optic nerve and surrounding structures for improvement of
diagnostic quality.
1 INTRODUCTION
Optic nerve head (or optic disk) drusen are
congenital and developmental anomalies in a form
of calcific degeneration in some of axons of the
optic nerve head (Davis and Walter, 2003). Due to
that visual acuity is usually not affected but visual
fields of patients can be abnormal and deteriorate
over time (Davis and Walter, 2003). Drusen of the
optic disc may be easily diagnosed when glowing
yellow hyaline bodies are visible during
ophthalmoscopy. However, diagnostic difficulties
may be encountered when drusen are buried deep
within the nerve tissue in the optic nerve head, as
they can resemble optic disc swelling based on the
ophthalmoscopic appearance alone (Kurz-Levin and
Landau, 1999). Optic disk swelling may be
associated with raised intracranial pressure that is
transmitted to subarachnoid space surrounding an
optic nerve, thereby interrupting metabolic processes
of the nerve and consequently leading to edema and
eventual visual impairment or loss (Passi et al.,
2013). Differentiation of optic disc edema caused by
papilledema or other optic neuropathy from optic
nerve head drusen is very important clinically.
However, using for that B-scan ultrasonography, and
even fluorescein angiography or computed
tomography (CT) remains problematic (Johnson et
al., 2009) Misleading diagnostic conclusions could
be made in differentiation of optic nerve edema,
drusen covering the optic nerve head and combined
optic nerve edema and drusen cases. Diagnosing
optical disc drusen correctly is important to avoid
unnecessary work-up and to avoid overlooking
potential serious conditions such as true
papilledema. Kurz-Levin and Landau (1999)
reviewed retrospectively the clinical records of 142
patients (261 eyes) with suspected drusen of the
optic disc and stated that drusen of the optic nerve
head are diagnosed most reliably using B-scan
echography compared with both pre-injection
control photography and CT scans.
Structural analysis of the eye B-scan images
combined with mathematical morphology methods
can reveal valuable estimates reflecting pathogenic
changes in the optic nerve and surrounding
structures. The idea of this study was to elaborate a
method for computer-assisted evaluation of eye B-
scan ultrasonography images providing optimal
objectivized estimates for optic nerve head
diagnostics.
The proposed estimates should allow
differentiation of following cases: i) optic nerve
Kriš
ˇ
ciukaitis, A., Valuckis, V., Kybartait
˙
e-Žilien
˙
e, A. and Kriau
ˇ
ci ¯unien
˙
e, L.
Diagnostics of Optic Nerve Head Pathologies using Structural Analysis of Eye Ultrasound B-scan Images.
DOI: 10.5220/0005762301010104
In Proceedings of the 9th International Joint Conference on Biomedical Engineering Systems and Technologies (BIOSTEC 2016) - Volume 2: BIOIMAGING, pages 101-104
ISBN: 978-989-758-170-0
Copyright
c
2016 by SCITEPRESS – Science and Technology Publications, Lda. All rights reserved
101
edema; ii) drusen covering the optic nerve head; iii)
combined optic nerve edema and drusen.
2 METHODS
2.1 Image Data Sample
B-scan ultrasound eye images were registered in
Department of Ophthalmology of Lithuanian
University of Health Sciences Hospital by means of
OTI-Scan 1000 ultrasound scanner (Optos, USA), at
10 MHz frequency. An expert-ophthalmologist
selected 11 typical images representing drusen at the
optic nerve head cases, 3 typical images as
representing optic nerve edema cases, and 5 images
– combined drusen and edema cases.
2.2 Structural Analysis of the Images
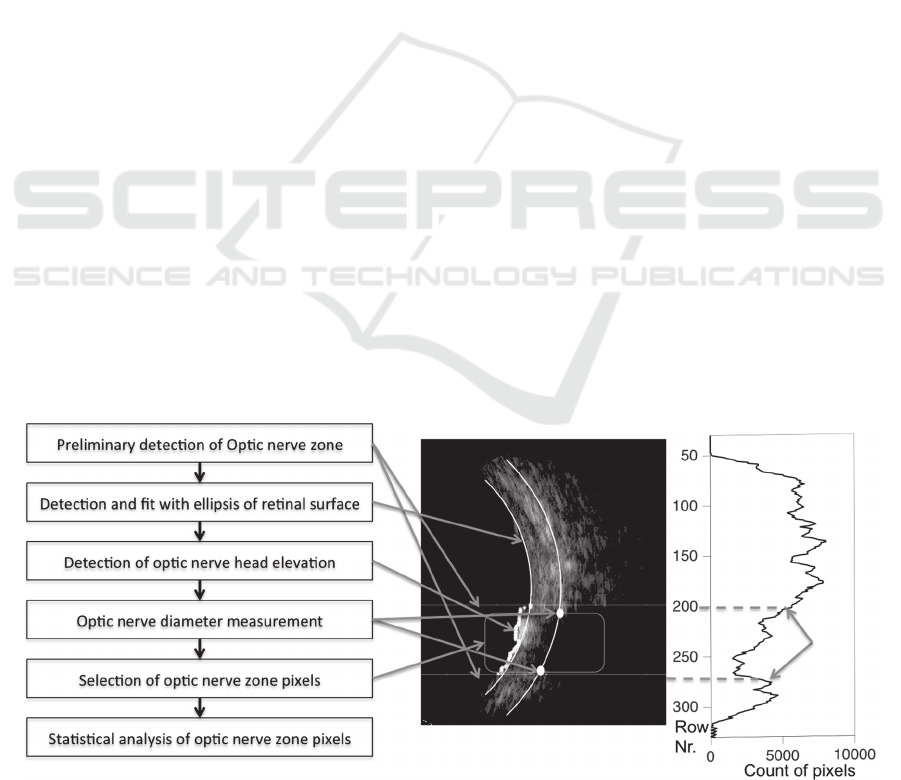
The structural analysis algorithm of the eye B-scan
images is presented on the left of Figure 1. The
whole image firstly is filtered using mathematical
morphology operations “opening” and “closing”
(Najman and Talbot, 2010) discarding registration
noise and filling the gaps in area represented by
white pixels beyond the retinal surface. Count of
white pixels in every row of the image-representing
matrix forms array, which has local minima at the
level of optic nerve (see the graph on the right of
Figure 1). Boundaries of this hollow are considered
as preliminary boundaries of the optic nerve zone.
We search for the pixels representing retinal surface
in every row of image-representing matrix. They are
found as the first maximal contrast points to the right
from the center of an image. Knowing a priori that
the zone of the optic nerve can be elevated in regard
to retinal surface due to edema, we exclude rows of
preliminary detected optical nerve zone from this
procedure. A retinal surface is expected to be round
shaped, so we best fit part of the ellipse to detected
retinal surface representing pixels. The final
estimation of a width of the optic nerve is performed
at 3 mm depth from the fitted ellipse according to
maximal gradient of pixel values at this depth
(shown by two white dots on B-scan image in Figure
1). The final detection of the optic nerve zone is
done using these points. Pixels from rows of image
array from this zone are used for further analysis.
2.3 Diagnostic Feature Estimation and
Analysis
Elevation of the optic nerve head in regard to the
retinal surface is the first feature. It is estimated as
the area between fitted ellipse, representing retinal
surface and the detected real optic nerve surface
(bold white dots on B-scan image in Figure 1). The
optic nerve drusen are represented by aggregates of
white pixels, when certain elevation is present.
However heuristic approach to construct decision
rules for identification of analyzed pathological
structures became sophisticated and we found it as
not reliable during preliminary tests. Therefore we
performed statistical analysis of the pixel values
from the zone of the optic nerve. Following features
were selected and estimated for further analysis:
normalized counts of histogram at standardized 21
bins covering the most expected range of pixel
values together with the main descriptive statistic
parameters of the pixels - mean; variance; skewness;
Figure 1: The algorithm of structural analysis of B-scan eye images (left), illustration of its result (center). Count of white
pixels in every row of the image, used for preliminary detection of the optic nerve zone is shown on the right graph.
BIOIMAGING 2016 - 3rd International Conference on Bioimaging
102

Table 1: Eigenvalues of canonical functions.
Function Eigenvalue % of Variance Cumulative % Canonical Correlation
1 134,070 93,2 93,2 0,996
2 9,820 6,8 100,0 0,953
Table 2: Wilks' Lambda criterion for canonical functions.
Test of Function(s) Wilks' Lambda Chi-square df Sig.
1 through 2 0,001 61,941 24 0,000
2 0,092 20,242 11 0,042
kurtosis and entropy (26 parameters in total for
every analyzed picture). We normalized values of all
features dividing them by estimate of their spread
(difference between the maximum and minimum).
Discriminant analysis was used to construct
canonical discriminant functions best classifying
data reflecting analyzed cases (“drusen”, “drusen
and edema”, “edema”). The canonical function
involves several initial features optimizing their
weight for the best separation of groups. The typical
canonical function is:
Y
i
l
1
X
1
l
2
X
2
... l
p
X
p
C
i
,
(1)
where X are the features and l are their weights.
Quality of classification using canonical functions
was determined by Wilk’s Lambda statistics. For
details about discriminant analysis see (Klecka,
1980). All calculations were performed using IBM
SPSS Statistics 22 package.
3 RESULTS
Typical examples of eye B-scan images with
determined main eye structures in case of “drusen”,
“drusen and edema” and “edema” are shown in
Figure 2. Twelve of 26 initial features were involved
constructing two canonical functions for data
classification according Fisher statistics and Wilk’s
Lambda criterion. Percentage of variation covered
by every canonical function is reflected by
corresponding eigenvalue of co-variation matrix
presented in Table 1.
Quality of classification determined by Wilk’s
Lambda criterion is presented in Table 2. As we see,
values of Wilk’s Lambda criterion are below 0.1 and
significance values are below 0.05 for both
canonical functions, what means that both of them
could be used for classification. However, according
to eigenvalues and percentage of variation covered
(93.2% vs. 6.8%), we can recommend the 1
st
canonical function for classification of the cases.
Standardized canonical discriminant function
coefficients are presented in Table 3.
Table 3: Standardized Coefficients of Canonical
Discriminant Function.
Variables
Functions
1 2
VAR3 19,976 -3,643
VAR4 3,554 6,430
VAR5 11,114 4,164
VAR6 6,823 -5,266
VAR7 12,205 -3,969
VAR8 -1,619 2,627
VAR9 -6,323 8,439
VAR10 24,528 -13,592
VAR11 17,923 10,234
VAR12 -13,304 -0,878
VAR13 25,300 -9,504
VAR15 2.835 6.142
It is interesting that only certain histogram
counts were selected to include into canonical
functions. Maximal values of coefficients indicate
the most important features for classification of the
cases. As we see, the 3
rd
, the 10
th
and the 13
th
histogram counts were found as the most significant.
All 100% of original grouped cases were correctly
classified. However, only 58,8% of cross-validated
grouped cases were correctly classified. Stepwise
selection of features for classification according to
Fisher statistics, using minimum partial F to enter
3.84 and maximum partial F to remove 2.71,
selected variance of pixel values as the only feature
useful for classification. In this case 76.5% of
original grouped cases were correctly classified.
Involvement of neither optic nerve head elevation
estimate nor optic nerve diameter at 3 mm depth into
features set did not improve the classification
results.
Diagnostics of Optic Nerve Head Pathologies using Structural Analysis of Eye Ultrasound B-scan Images
103
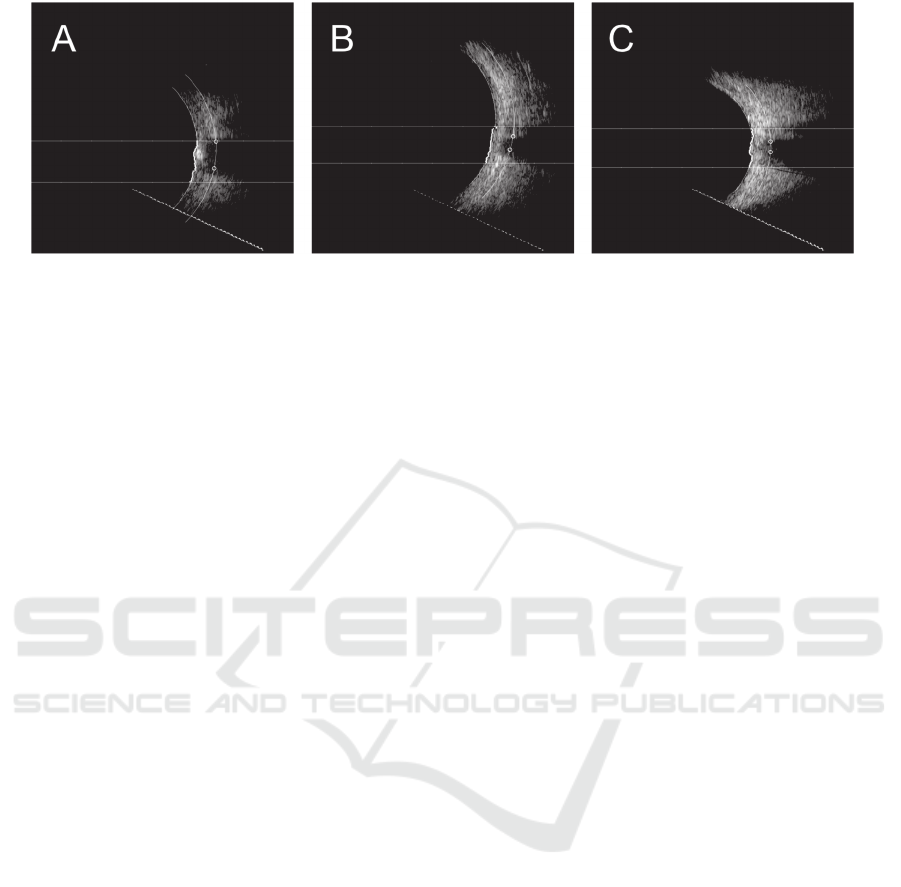
Figure 2: Examples of eye B-scan images with determined main eye structures in cases of A: “drusen”, B: “edema” and C:
“drusen and edema”.
4 DISCUSSION
The elaborated algorithm for data preprocessing and
structural analysis of ultrasound eye B-scan images
extracts subset of pixels, representing the zone of
interest – the area of the optic nerve close to the
retinal surface. Estimated statistical parameters of
pixels were shown as informative features for
differentiation between the three clinical cases.
Constructed canonical functions correctly
classifying all three clinical cases revealed the main
features to be considered when analyzing ultrasound
eye B-scan images. Classification significance was
acceptable. However very limited number of cases
has been analyzed so far and it is the weakest point
of this study. Nevertheless elaborated set of data
preprocessing and structural analysis algorithms
together with proposed methods of statistical
analysis forms a basis for future investigations
including more representative sample of images
covering a wide range of clinical cases.
The elaborated structural analysis algorithm
determines key-structures in the eye B-scan images.
We expect that it would be useful for feature
estimation in semi-automated or automated
diagnostics of other pathologies in the eye.
5 CONCLUSIONS
The elaborated method of computer-assisted
evaluation of eye B-scan images provides the
optimal set of features for diagnostics of pathologies
in the optic nerve head. We demonstrated its
suitability on limited number of pathologies, but it
could be used in many other cases, where
diagnostics is based on analysis of eye B-scan
images.
REFERENCES
Davis P, and Walter J. Optic Nerve Head Drusen.
Seminars in Ophthalmology 2003;18(4): 222–242.
Johnson L; Diehl M; Hamm C; Sommerville D; Petroski
G; Differentiating Optic Disc Edema From Optic
Nerve Head Drusen on Optical Coherence
Tomography. Arch Ophthalmol . 2009;127(1): 45-49.
Klecka W.R. (1980), Discriminant Analysis, Sage
University Paper Series on Quantitative Applications
in the Social Sciences, 07-019. Beverly Hills, CA:
Sage Publications.
Kurz-Levin M; Landau K. A Comparison of Imaging
Techniques for Diagnosing Drusen of the Optic Nerve
Head. Arch Ophthalmol. 1999;117(8):1045-1049.
Najman L, and Talbot H. (Eds). Mathematical
morphology: from theory to applications, ISTE-Wiley.
ISBN 978-1-84821-215-2. (520 pp.) June 2010.
Passi, N., Degnan A. J., and Levy L. M. MR Imaging of
Papilledema and Visual Pathways: Effects of
Increased Intracranial Pressure and Pathophysiologic
Mechanisms. AJNR Am J Neuroradiol. 2013
May;34(5):919-24.
BIOIMAGING 2016 - 3rd International Conference on Bioimaging
104
