
Visual Analytics Towards Tool Interoperability
A Position Paper
Didem Gürdür, Fredrik Asplund, Jad El-khoury, Frederic Loiret and Martin Törngren
Department of Machine Design, KTH Royal Institute of Technology, Stockholm, Sweden
Keywords: Tool Chain Visualization, Interoperability, Visual Analytics, Data Visualization.
Abstract: Complex-engineering projects include artefacts from several engineering disciplines such as mechanical,
electrical, software components, processes and plans. While software tools can be powerful in each
individual discipline, it is difficult to build integrated tool chains. Moreover, it is challenging to evaluate and
update existing tool chains. At the same time, the field of visualization is getting mature and visual analytics
promises an opportunity to develop knowledge, methods, technologies and practice for exploiting and
combining the strengths of human and data. We consider this as a potential to evaluate current tool chains.
This position paper discusses the visualization and visual analytics practices to assess existing tool chains
performance.
1 INTRODUCTION
Development in complex engineering projects
requires tool support from different engineering
disciplines for different phases of the product
lifecycle. Furthermore, each engineering field uses
specific software tools that focus on explicit tasks
throughout the product development process.
Engineers therefore face problems with tool
interoperability through technological problems
related to data transmission or the interpretation of
the transferred data (Yan et al., 2010). Fortineau et
al., (2013) particularly highlight different
interpretations of data that is located in
heterogeneous environments as problematic. These
heterogeneities are based on the differences between
computing environments, languages, techniques,
tools and data sources (Paviot et al., 2011;
Giunchiglia et al., 2004; Spalazzese, 2009), in
different areas of expertise. The absence of
interoperability between tools results in high
development costs and reduced product quality
(Schürr and Dörr, 2005).
This position paper motivates the adaptation of
visualization analytics to interoperability research,
with the aim of facilitating tool interoperability in
heterogeneous engineering environments.
Section II provides a background to both
interoperability and visualization. Section III
describes opportunities related to utilizing visual
analytics approaches to enhance interoperability, and
also discusses the associated challenges. We discuss
technical aspects briefly on the Section IV and end
the paper by outlining the future research required to
overcome these challenges and make good on the
opportunities.
2 STATE-OF-THE-ART
At least 30 different definitions of interoperability
have been used in the literature during the last 30
years (Ford, 2007). Interoperability is a
multidimensional concept, which comprises several
perspectives and approaches from different
directions for different domains. Today altered
definitions of interoperability exist in the literature.
We will use IEEE definition in this paper that states
that the interoperability is: “The ability of two or
more systems or components to exchange and use
the exchanged information in a heterogeneous
network” (Geraci et al., 1991). One of the possible
interoperability problems occurs among tools. Tool
interoperability is a special case of interoperability,
which focuses on the interactions between software
tools in these systems.
A substantial amount of research effort has been
spent in this research field, but interoperability still
remains a broad and complex topic – and measuring
GÃijrdÃijr D., Asplund F., El-khoury J., Loiret F. and TÃ˝urngren M.
Visual Analytics Towards Tool Interoperabilty - A Position Paper.
DOI: 10.5220/0005751401390145
In Proceedings of the 11th Joint Conference on Computer Vision, Imaging and Computer Graphics Theory and Applications (IVAPP 2016), pages 139-145
ISBN: 978-989-758-175-5
Copyright
c
2016 by SCITEPRESS – Science and Technology Publications, Lda. All rights reserved
139
interoperability is especially difficult. Nevertheless,
assessing interoperability with well-chosen measures
is essential for identifying priorities in product
development. Many researchers have studied such
assessments and many approaches are proposed in
the literature (LaVean, 1980; Mensh et al., 1989;
Amanowicz and Gajewski, 1996; Clark and Jones,
1999; Hamilton et al., 2002). Wasserman introduced
5 widely accepted categories or dimensions of tool
integration as Control, Data, Platform, Presentation
and Process (Wasserman, 1990). Asplund and
Törngren identified a set of stakeholders (such as
application domain experts, project managers,
managers, support environment administrators,
customers and standardization organizations) and
six non-functional properties (flexibility, scalability,
cost, evolve ability, efficiency and the degree of
standardization) as especially important in the
subsequent discourse (2015). However, none of
these approaches aimed at developing an application
to measure interoperability. Furthermore, none of
them propose to use data visualization and
visualization analytics as a method to examine tool
interactions.
A path forward would be to leverage on Model
Based Engineering (MBE), which is gaining traction
based on its ability to address platform complexity:
MBE tools impose domain specific constraints to
perform model checking that can detect and prevent
errors in the early stages of the product lifecycle
(Schmidt, 2006). MBE relies on modelling the
product, and then implementing, testing, simulating
and analysing the product based on the models. An
extension to MBE could involve modelling and
automatically synthesizing the tool chains used
throughout the product development (Biehl, 2013).
However, in the industry, tool chains that represent
large investments of time and money often already
exist. A large effort might have been spent on
acquiring suitable tools and training employees in
their use. This would act as a determent to the time
consuming modelling of tool and tool integration,
especially if models are not able to capture all the
required details. To fill this gap between existing
and envisaged tool chains a complementary
approach is needed.
Ways to represent complex relationships already
exist, e.g. bottom up visualization techniques.
Gershon (1992) defines visualization as follows:
“Visualization is more than a method of computing.
Visualization is the process of transforming
information into a visual form, enabling users to
observe the information. The resulting visual display
enables the scientist or engineer to perceive visually
features which are hidden in the data but
nevertheless are needed for data exploration and
analysis.” The visualization research field includes
studies of techniques for creating statistical graphics,
plots, tables, charts, etc. The primary goals of data
visualization are to communicate information clearly
and efficiently to users; to confirm analysis as a
goal-oriented examination of hypotheses; and to
explore data analysis as an interactive and usually
undirected search for structures and trends.
Effective
visualization helps users to analyse and reason about
data and evidence. It is worth underlining that visual
analytics is more than only visualization. According
to Keim et al. (2008)
“Visual analytics combines
automated analysis techniques with interactive
visualizations for an effective understanding,
reasoning and decision making on the basis of very
large and complex data sets.”. The fields of
visualization and visual analytics build upon
methods from scientific analytics, geospatial
analytics and information analytics (Wong and
Thomas, 2004). They profit from knowledge out of
the field of interaction as well as cognitive and
perceptual science. However, they are distinct from
each other, since visual analytics integrate
methodology from the statistical analytics,
knowledge discovery, data management and
knowledge representation research fields (Andrienko
et al., 2010).
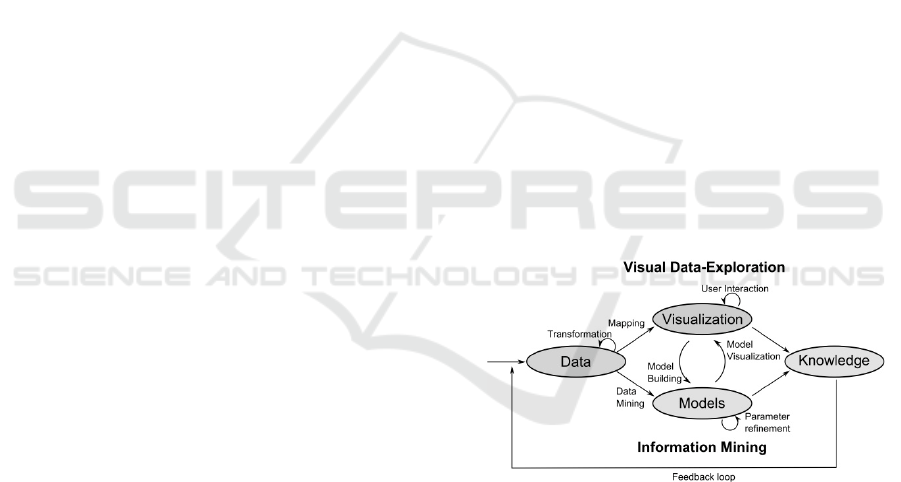
Figure 1: Visual analytics process defined by Keim et al.,
(2008).
Visual analytic tools and techniques are useful
for synthesizing information and to derive insight
from massive, dynamic, ambiguous, and often-
conflicting data, to detect the expected and discover
the unexpected, to provide timely, defensible, and
understandable assessments and to communicate
assessment effectively for action. Keim et al. (2008)
introduced a framework for the visual analytics
process, which is shown in Figure 1. The process
starts by transforming the data by e.g. filtering and
sampling in order to extract meaningful units of data
IVAPP 2016 - International Conference on Information Visualization Theory and Applications
140

for further processing. Next, a visual or automatic
analysis method needs to be applied, e.g. data
mining to estimate models for characterizing the
data. Finally visual data exploration is used, in
which users directly interact with the visual interface
to analyse and explore the data. The resulting
knowledge can then be fed back into further
iterations of the process.
Although visual analytics is not yet a best
practice in industrial product lifecycle processes the
use of databases and statistical techniques are not
new to manufacturing and engineering. Examples of
data and knowledge applications of artificial
intelligence could be found in manufacturing as
early as in the late 1980s (Ramamoorthy and Wah,
1989). The evolution in information technology,
data acquisition systems, and storage technology has
enticed researchers to study the use of knowledge
from databases. Today data from almost all
organizational processes is used in analyses,
including requirements, material planning and
control, product and process design, assembly,
scheduling, sales and maintenance. Moreover, this
data has a large potential both as a source of new
knowledge and a basis for operational predictions.
3 MOTIVATION
The overload of data is well-known phenomenon:
today data is produced at a rapid rate, and the ability
to collect and store data is increasing at a faster pace
than the ability to analyse it (Keim et al., 2008). In
many fields visualization methods and visual
analytics are therefore already commonplace. In
news, banking and management tools these methods
are extensively used to give users an overview of the
saved data. In fact, these tools frequently make
suggestions or otherwise simplify and facilitate
decision-making processes.
Data is raw, unorganized facts and statistics -
often simple, seemingly random and useless until
organized. On the other hand, information is the
processed, organized, structured data that is
presented in a given context so as to make it
valuable. In engineering, visualization and visual
analysis of tool chains could help tool chain
developers to quickly sort and analyse large,
disordered and inconsistent volumes of data and
extract comprehensible information out of it. In the
manufacturing, design, business, and medical
domains the identification of valuable patterns has
been an ambition for long time. This stems partly
from the need to deal with associated high-level
problems related to entire socio-technical systems:
for instance difficulties in adapting tool chains to
new domains, the unfeasibility in scaling tool chains
as organizations grow, tool “lock-in” due to business
models of tool vendors, technology hampering the
efficiency of organizations due to tool chains
mismatches, and non-standardized tool integration
that cannot be evolved to meet production needs
(Asplund and Törngren, 2015). Visual analytics
provides an opportunity to easily find patterns that
might help solve these problems. We believe it is
especially promising to extract patterns on tool
chains and tool interactions, such as which tools that
interact, how frequent these interactions are, what
data that is shared between tools, how many users of
the tools that exist, where the users are located, etc.
Moreover, visual analytics could be a tool to
improve interoperability by leveraging on any
interaction patterns thus revealed.
Visualizations could also be useful in a
preliminary phase to model tool chains more
efficiently. One could extract the relationships that
exist in current tool chains through visualization
techniques, optimize the tool chain for better
interoperability according to well-defined metrics,
and model optimized tool chains through selected
MBE technologies.
Complexity could be classified as a property of a
scenario or as a relation. Kopetz (2013) defines
cognitive complexity as a “relation between a
scenario and an observer who tries to understand
the scenario”. To understand the scenario one needs
to link new concepts or dependencies with already
familiar concepts. We believe visualization and
visual analytics could create this link effectively
since visuals/images have been the foundation of
human understanding since the beginning of
recorded history. Another goal of visual analytics in
the engineering domain could therefore be the
evaluation of complexity. For instance, one could
discern tools that are not part of tool chains by
visualization and consider the need for integrating
them.
Visualization aims to visually represent the data
and visual analytics allow the user to directly
interact with the information, to quickly draw
conclusions and gain insights, and to eventually
make optimal decisions. Furthermore, visual
analytics could combine automated analysis
techniques with interactive visualizations for an
effective and efficient understanding, reasoning, and
decision making (Keim et al., 2008) of tool chain
developers/analysts. These analytics techniques
could include artificial intelligence and machine
learning methods where the visual analytics tool
Visual Analytics Towards Tool Interoperabilty - A Position Paper
141
gives suggestions that can be used to achieve better
interoperability. As an example, analytics about the
sustainability of a tool chain could be introduced by
these methods if suitable metrics where in place.
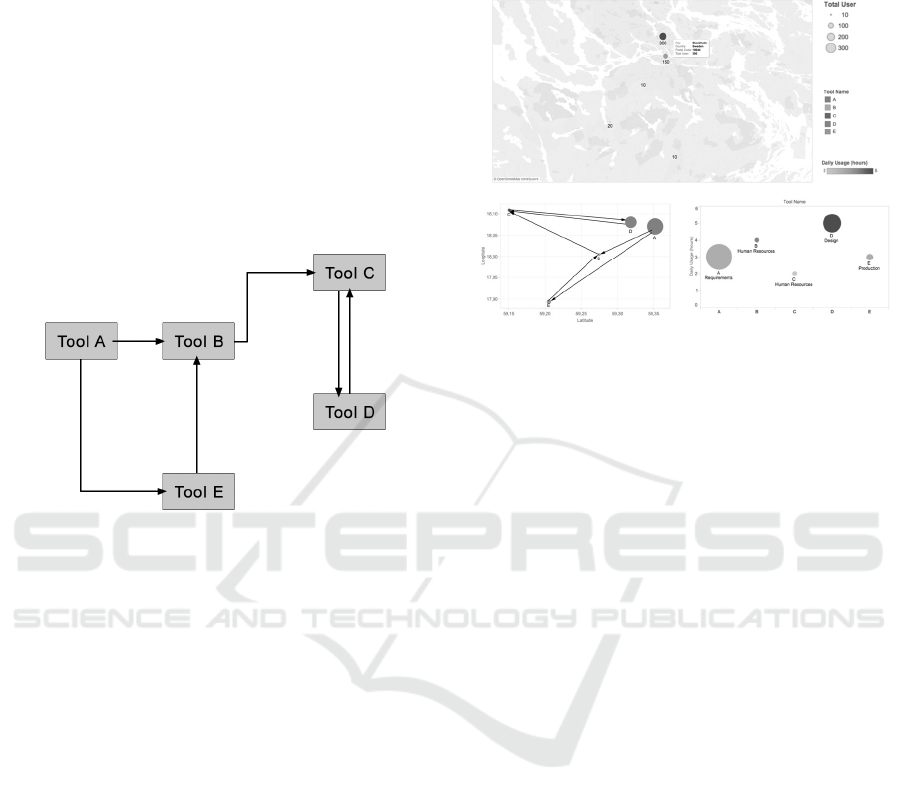
Tool chains are commonly illustrated by block
diagrams as shown in Figure 2. However, real tool
interactions are more complex and multi-
dimensional. For instance, the location of databases,
the number of active users, and the frequency of tool
interactions in a tool chain are often not taken into
consideration; taking further action, such as adding
safety goals based on tool interactions, calculating
the cost of changing a tool chain, assessing
organizational aspects, etc. is not possible.
Figure 2: Block diagram of a sample tool chain.
Even though MBE has an important role in the
development of new tool chains, it is not meant to be
used for understanding existing tool chains, but to
create new ones. Modelling tool chains could be
more beneficial when we have the framework or
platform to extend the model for generating some
interfaces. However, this framework or platform
does not exist now and we are not able to use the
model of tool chain or its properties for further
applications. Moreover, we cannot make any
analysis according to these models of tool chain
since it is not really representing the current
situation. It is highly possible to overlook some
aspect due to oversimplification.
Visual analytics or visualisations constitute a
better chance of generating an overview of the
infrastructure in detail: node-link or network
diagrams have graphical advantages, such as being
able to illustrate each tool with different sized circles
(large circles for mostly used tools and small ones
for opposite), locate the real position of databases,
etc. This is illustrated in Figure 3 by a dashboard
that could give tool chain developers a chance to
illustrate different viewpoints according to different
stakeholders and dimensions. This could even help
optimize performance, automation and cooperation
of distributed development teams through the
lifecycle of the product from requirements to
technical support.
Figure 3: Dashboard of a visualized sample tool chain.
Visual analytics is still not a silver bullet for a
future increase in tool chain interoperability. The
main challenge that needs to be considered before
and after applying the approach is the scalability and
dimensionality of data sources. In many
applications, data streams come from multiple,
heterogeneous sources and need to be integrated and
processed together. In this situation, the methods
need to be able to scale with a range of different data
types, data sources, and levels of quality. The visual
representation algorithms need to be efficient
enough for implementation in interactive systems
(Keim et al., 2008).
Another important point to mention is the quality
of the collected data that will be used for analytics.
Collecting massive amount of data from
heterogeneous environments requires a structured
and well-planned approach. It is vital to control, re-
arrange and filter data, and then to choose the best
analysis algorithms to prevent users from being
misled by erroneous analysis results (Kopetz, 2013).
As noted by several authors in the tool integration
discourse, this will rely on providing a graphical
visualization tailored to the specific user rather than
hoping that all users will be able to completely and
consistently understand “generic” interfaces
(Asplund and Törngren, 2015). The level of detail in
visualizations should also be chosen with care: The
visual abstraction or the level of detail in
visualization could hide relevant data patterns. To
avoid this, visualization or visual analytics tool
should facilitate the use of several levels of detail.
Visual analytics tools for tool chain analysis
should be simple and easy to use to help tool chain
IVAPP 2016 - International Conference on Information Visualization Theory and Applications
142

developers to focus on real interoperability issues.
Complex or excessively technical user interfaces
could distract users (Keim et al., 2008). Another
challenge is the evaluation of tool chain
interoperability. It is very important to extract
dimensions, metrics and viewpoints, which play a
vital role for interoperability in tool chains, and then
integrate these with visual analytics. Such evaluation
metrics could be used to filter the visualization, but
are yet to become available.
4 TECHNICAL DISCUSSION
This position paper is the first attempt of complete
research about the applicability of the visualization
and visual analytics of tool chains. In this paper, we
aim to point out the importance of visualization and
visual analytics to improve tool interoperability.
However, it is vital to relate this new topic with
existing visualization and visual analytics
approaches. In this section, we will investigate
relevant solutions from overlapping research areas
such as visual software analytics and workflow
management.
Visual software analytics investigates visual
analytics approaches of the visualization of artefacts
related to software systems and their development
process (Keim et al., 2008). These software systems
are also complex systems and include time
dependency, heterogeneous data, and influenced by
different stakeholders like development tool chains.
Visualization of software evolution classically uses
information about the modifications of the source
code (Voinea and Telea, 2005; Voinea and Telea,
2008), interactions of developers with code (Ma,
2008), or the development on software metrics.
Diehl (2007) provides a comprehensive survey of
software visualization methods and in his study
divides the concern of visual software analytics to
three as; structure, behaviour and evolution. We can
apply these concerns in tool interoperability context
easily. As we already mentioned, like software,
products also evolve in time with contribution of
stakeholders.
The significance of visual representations to
increase the understanding of computer programs is
not new concept. Goldstein and von Neumann
(1963) presented a system of describing processes
using operation, assertion, and alternative boxes
which then called flowcharts and their the
usefulness, whereas Haibt (1959) developed a
system that could draw them automatically.
Afterwards software visualization techniques
continue to enhance and still developing.
Nevertheless, there are fundamental similarities
between software development and product
development lifecycles. In addition there are proven
useful visualization methods in software engineering
field for the development process that can be
migrated to product development context (Price et
al., 1992; Bohner, 1996; Storey et al., de Souza et
al., 2007). One down side is the immature data
mining state of tool chain information in product
development environment when compared with the
visual mining of software repositories. Visual
mining of data repositories in software development
are still more homogenous than the tool interactions
information and there are very few research done on
especially product lifecycle management data.
Ameri and Dutta (2005) states that even though the
product lifecycle management solutions are aiming
to streamline the flow of information about product
data, few organizations are benefiting from it truly.
Moreover, we need to explore deeper to understand
how we can reach more specific information about
tools during the development process.
There are already existing visualization
applications and frameworks such as AVS (Upson et
al., 1989), VTK (Schroeder, 2004), InfoVis Toolkit
(Fekete, 2004) or VisTrails (Callahan et al., 2006).
For instance VisTrails have been used by Hlawatsch
et al. (2015) to visualize and analyse the evolution of
module workflows. Also there are many researches
done for scientific workflow management, which
used Kepler (Altintas et al., 2004) system. There is
also web based open source Data Driven Documents
(D3.js) (Bostock, 2012) framework for creating
interactive visualizations. However we need to
investigate these applications further to understand
how far we can employ the approaches from the tool
interoperability perspective and examination of their
feasibility is not in the scope of this paper.
5 CONCLUSION AND FUTURE
WORK
In this paper we discussed the interoperability issues
in tool chains and explained how important
visualization and visual analytics are to improve the
interoperability of tools. Even though these
techniques are compared with MBE, we do not
intend to replace modelling practices. On the
contrary we believe visualization has a significant
value in aiding tool chain developers, engineers,
analysts, decision makers, and other stakeholders to
Visual Analytics Towards Tool Interoperabilty - A Position Paper
143

promptly gain insights from the high volumes of
data. When combined with analytics, data
visualization promises opportunities in exploring
data quickly and serves as an interaction medium to
augment requirements analyst’s knowledge
discovery with advanced computational capabilities.
This could affect the whole tool chain
interoperability positively and thereby improve
productivity.
In many cases, the information would have to be
collected from heterogeneous data sources and by of
knowledge that currently only exists in the mind of
experts. It is possible to apply analytical reasoning
hypotheses on the data and reach a better
understanding of the data, which supports the user in
his task to gain insight. Visualization and visual
analytics are an opportunity to apply these
hypotheses/methods, to extract patterns of tool
chains and tool interactions, to evaluate complexity
of tool chains, to create overview of the
infrastructure with different view points, to optimize
performance, automation and cooperation of
distributed development teams and over all to
improve interoperability.
One should not forget that real interoperability
issues in industry often consist of a series of
difficulties. Solving one might be accomplishable;
but doesn’t necessarily solve the overall problem.
The main goal of the proposed research is to bring
the power of visualizations and visual analytic tools
to product development to improve interoperability
between tools. In the future, we will perform a
survey in order to extract interoperability metrics,
which will support the filtering mechanism,
evaluation and analysis of tool chains. We will
collect data streams about tool interactions and
evaluate a visual analytics approach on one use case
to elaborate on the resulting opportunities.
REFERENCES
Altintas, I., Berkley, C., Jaeger, E., Jones, M., Ludascher,
B. and Mock, S., 2004, June. Kepler: an extensible
system for design and execution of scientific
workflows. In Scientific and Statistical Database
Management, 2004. Proceedings. 16th International
Conference on (pp. 423-424). IEEE.
Amanowicz, C. and Gajewski, C. P., 1996, October.
Military communications and information systems
interoperability. In Military Communications
Conference, 1996. MILCOM'96, Conference
Proceedings, IEEE (Vol. 1, pp. 280-283). IEEE.
Ameri, F. and Dutta, D., 2005. Product lifecycle
management: closing the knowledge loops. Computer-
Aided Design and Applications, 2(5), pp.577-590.
Andrienko, G., Andrienko, N., Demsar, U., Dransch, D.,
Dykes, J., Fabrikant, S.I., Jern, M., Kraak, M. J.,
Schumann, H. and Tominski, C., 2010. Space, time
and visual analytics. International Journal of
Geographical Information Science, 24(10), pp.1577-
1600.
Asplund, F. and Törngren, M., 2015. The discourse on
tool integration beyond technology, a literature survey.
Journal of Systems and Software, 106, pp.117-131.
Biehl, M., 2013. A modeling language for the description
and development of tool chains for embedded systems.
Bohner, S. A., 1996. Software change impact analysis.
Bostock, M., 2012. D3. js. Data Driven Documents.
Callahan, S. P., Freire, J., Santos, E., Scheidegger, C. E.,
Silva, C. T. and Vo, H. T., 2006. Managing the
evolution of dataflows with vistrails. In Data
Engineering Workshops, 2006. Proceedings. 22nd
International Conference on (pp. 71-71). IEEE.
Clark, T. and Jones, R., 1999, June. Organisational
interoperability maturity model for C2. In Proceedings
of the 1999 Command and Control Research and
Technology Symposium.
de Souza, C. R., Quirk, S., Trainer, E. and Redmiles, D.
F., 2007, November. Supporting collaborative
software development through the visualization of
socio-technical dependencies. In Proceedings of the
2007 international ACM conference on Supporting
group work (pp. 147-156). ACM.
Diehl, S., 2007. Software visualization: visualizing the
structure, behaviour, and evolution of software.
Springer Science & Business Media.
Fekete, J. D., 2004, October. The infovis toolkit. In
Information Visualization, 2004. INFOVIS 2004. IEEE
Symposium on (pp. 167-174). IEEE.
Ford, T., Colombi, J., Graham, S. and Jacques, D., 2007.
The interoperability score. AIR FORCE INST OF
TECH WRIGHT-PATTERSON AFB OH.
Fortineau, V., Paviot, T. and Lamouri, S., 2013.
Improving the interoperability of industrial
information systems with description logic-based
models—The state of the art. Computers in Industry,
64(4), pp.363-375.
Geraci, A., Katki, F., McMonegal, L., Meyer, B., Lane, J.,
Wilson, P., Radatz, J., Yee, M., Porteous, H. and
Springsteel, F., 1991. IEEE standard computer
dictionary: Compilation of IEEE standard computer
glossaries. IEEE Press.
Gershon, N. D., 1992. From perception to visualization.
Computer graphics, 26(2), pp.414-415.
Giunchiglia, F., Shvaiko, P. and Yatskevich, M., 2004,
February. S-Match: an algorithm and an
implementation of semantic matching. In ESWS (Vol.
3053, pp. 61-75).
Goldstein, H. H. and Neumann, J. V., 1963. Planning and
Coding Problems for an Electronic Computer
Instrument. Collected Works of J. von Neumann, 5,
pp.80-235.
Haibt, L. M., 1959, March. A program to draw multilevel
flow charts. In Papers presented at the the March 3-5,
IVAPP 2016 - International Conference on Information Visualization Theory and Applications
144

1959, western joint computer conference (pp. 131-
137). ACM.
Hamilton Jr, J. A., Rosen, J. D. and Summers, P. A., 2002.
An interoperability road map for C4ISR legacy
systems. Space and Naval Warfare Systems Center San
Diego CA.
Hlawatsch, M., Burch, M., Beck, F., Freire, J., Silva, C.
and Weiskopf, D., Visualizing the Evolution of
Module Workflows.
Keim, D., Andrienko, G., Fekete, J. D., Görg, C.,
Kohlhammer, J. and Melançon, G., 2008. Visual
analytics: Definition, process, and challenges (pp.
154-175). Springer Berlin Heidelberg.
Keim, D. A., Mansmann, F., Schneidewind, J., Thomas, J.
and Ziegler, H., 2008. Visual analytics: Scope and
challenges (pp. 76-90). Springer Berlin Heidelberg.
Kopetz, H., 2013. System-of-Systems complexity. arXiv
preprint arXiv:1311.3629.
Lavean, G. E., 1980. Interoperability in defense
communications. Communications, IEEE Transactions
on, 28(9), pp.1445-1455.
Ma, K. L., 2008, March. Stargate: A unified, interactive
visualization of software projects. In Visualization
Symposium, 2008. PacificVIS'08. IEEE Pacific (pp.
191-198). IEEE.
Mensh, D., Kite, R. and Darby, P., 1989. A methodology
for quantifying interoperability. Nav. Eng. J, 101(3),
p.251.
Paviot, T., Cheutet, V. and Lamouri, S., 2011. A PLCS
framework for PDM/ERP interoperabilty.
International Journal of Product Lifecycle
Management, 5(2-4), pp.295-313.
Price, B., Small, I.S. and Baecker, R.M., 1992, January. A
taxonomy of software visualization. In System
Sciences, 1992. Proceedings of the Twenty-Fifth
Hawaii International Conference on (Vol. 2, pp. 597-
606). IEEE.
Ramamoorthy, C. V. and Wah, B. W., 1989. Knowledge
and data engineering. Knowledge and Data
Engineering, IEEE Transactions on, 1(1), pp.9-16.
Romito, C., Probert, D. and Farrukh, C., 2007, August.
Technology evaluation under information inadequacy.
In Management of Engineering and Technology,
Portland International Center for (pp. 1672-1679).
IEEE.
Schmidt, D. C., 2006. Guest editor's introduction: Model-
driven engineering. Computer, 39(2), pp.0025-31.
Schroeder, W. J., Lorensen, B. and Martin, K., 2004. The
visualization toolkit. Kitware.
Schürr, A. and Dörr, H., 2005. Introductory paper.
Software and Systems Modeling, 4(2), pp.109-111.
Spalazzese, R., 2009, August. Towards mediator
connectors for application level interoperability. In
Proceedings of the doctoral symposium for ESEC/FSE
on Doctoral symposium
(pp. 35-36). ACM.
Storey, M. A. D., Čubranić, D. and German, D. M., 2005,
May. On the use of visualization to support awareness
of human activities in software development: a survey
and a framework. In Proceedings of the 2005 ACM
symposium on Software visualization (pp. 193-202).
ACM.
Upson, C., Faulhaber Jr, T., Kamins, D., Laidlaw, D.,
Schlegel, D., Vroom, J., Gurwitz, R. and Van Dam,
A., 1989. The application visualization system: A
computational environment for scientific visualization.
Computer Graphics and Applications, IEEE, 9(4),
pp.30-42.
Voinea, L., Telea, A. and Van Wijk, J. J., 2005, May.
CVSscan: visualization of code evolution. In
Proceedings of the 2005 ACM symposium on Software
visualization (pp. 47-56). ACM.
Voinea, S. L. and Telea, A., 2006, May. Cvsgrab: Mining
the history of large software projects. In Proceedings
of the Eighth Joint Eurographics/IEEE VGTC
conference on Visualization (pp. 187-194).
Eurographics Association.
Wasserman, A. I., 1990, January. Tool integration in
software engineering environments. In Software
Engineering Environments (pp. 137-149). Springer
Berlin Heidelberg.
Wong, P. C. and Thomas, J., 2004. Visual analytics. IEEE
Computer Graphics and Applications, (5), pp.20-21.
Yan, L., Li, Z., Yuan, X. and Xiong, S., 2010. Method of
Robust Multidisciplinary Design Collaborative
Decision. Journal of Mechanical Engineering, 3.
Visual Analytics Towards Tool Interoperabilty - A Position Paper
145
