
Testing of Micro-optics using Digital Holographic Interferometric
Microscopy
Varun Kumar and Chandra Shakher
Laser Applications and Holography Laboratory, Instrument Design Development Centre,
Indian Institute of Technology Delhi, Hauz Khas, New Delhi 110016, India
Keywords: Digital Holographic Interferometric Microscopy, Phase Map, Micro-lens Array, Micro-optics.
Abstract: Digital holographic interferometric microscopy (DHIM) is used as metrological tool for the testing of
micro-optics. The paper presents the measurement of sag height (h), radius of curvature (ROC), and shape
of micro-lens. The advantage of using the DHIM is that the distortions due to aberrations in the optical
system are avoided by the interferometric comparison of reconstructed phase with and without the object.
1 INTRODUCTION
Micro - optical component such as microlenses and
micro lens array have numerous engineering and
industrial applications for collimation of laser diode,
imaging for sensor system (CCD/CMOS, document
copier machines etc.), for making beam
homogeneous for high power laser, a critical
component in Shack-Hartmann sensor, fiber
coupling and optical switching in communication
technology (Sinzinger 1999, Anderson 1997,
Cormick et al,1999, Hou et al. 2015). Also micro-
optical components have become an alternative to
bulk optics for applications where miniaturization,
reduction of alignment and packaging cost are
necessary (SUSS MicroOptics SA catalog 2007).
The compliance with high-quality standards in the
manufacturing of micro-optical components is a
precondition to be compatible on worldwide
markets. Therefore, high demands are put on quality
assurance. For quality assurance of these lenses, an
economical measurement technique is needed. For
cost and time reason, technique should be fast,
simple, and robust with high resolution. The
technique should provide non contact, non-invasive
and full field information about the shape of micro-
optical component under test. The interferometric
techniques are noncontact type, non invasive and
provide full field information about the shape of the
optical components. The conventional
interferometric technique such as Mach-Zehnder
interferometry, Twyman- Green interferometry and
white light interferometry are available for testing of
micro-optics (Reichelt et al., 2005; Weible et al.,
2004; Wahaba and Kries, 2009). However,
interferometric techniques needs more experimental
efforts for phase measurement (such as phase
shifting techniques) and are thus time consuming
(Reichelt et al., 2005; Weible et al., 2004; Wahaba
and Kries, 2009; Zhang and Yamaguchi, 1998).
White light interferometry is not suited to measure
entire lens profile and yields accurate information
only for vertex of micro-lens (Weible et al., 2004).
Digital holography (DH) overcomes the above
discussed problems. Digital holographic microscopy
(DHM) allows to extract both the amplitude and
phase information of a wavefront transmitted
through the transparent object (micro-lenses array)
from a single digitally recorded hologram by use of
numerical methods (Charrière et al.,2006; Schnar
and Juptner, 1994; Cuche et al. 1999; Cuche et al.
1999, p. 291-293; Schnar, 2005). Due to numerical
reconstruction, the complex object wavefront at
different distances can be reconstructed. Digital
holography provides axial resolution in nanometers
while lateral resolution is limited by diffraction and
the size of the sensor (Cuche et al. 1999; Cuche et al.
1999, p. 291-293).
In this paper, Mach-Zehnder based digital
holographic interferometric system (DHIM) is used
for the testing of refractive micro lens. The
advantage of using the DHIM is that the distortions
due to aberrations in the optical system are avoided
by the interferometric comparison of reconstructed
phase with and without the micro lens array (Anand
142
Kumar, V. and Shakher, C.
Testing of Micro-optics using Digital Holographic Interferometric Microscopy.
DOI: 10.5220/0005742901400145
In Proceedings of the 4th International Conference on Photonics, Optics and Laser Technology (PHOTOPTICS 2016), pages 142-147
ISBN: 978-989-758-174-8
Copyright
c
2016 by SCITEPRESS – Science and Technology Publications, Lda. All rights reserved
et al., 2011, p. 547). In the experiment, first a digital
hologram is recorded in the absence of micro-lens
array which is used as a reference hologram. Second
hologram is recorded in the presence of micro-lens
array. The presence of transparent micro-lens array
will induce a phase change in the transmitted laser
light. Complex amplitude of object wavefront in
presence and absence of micro-lens array is
reconstructed by using Fresnel reconstruction
method (Schnar and Juptner, 2005). From the
reconstructed complex amplitude, one can evaluate
the phase of object wave in presence and absence of
micro-lens array. Phase difference between the two
states of object wave will provide the information
about optical path length change occurring between
two states. By knowing the value of the refractive
index of micro-lens array material and air, the
surface profile of micro-lens array is calculated.
From the experimentally calculated value of sag
height (h) and diameter of micro-lens (D), the radius
of curvature of micro-lens is calculated.
2 EXPERIMENTAL SET UP AND
THEORY
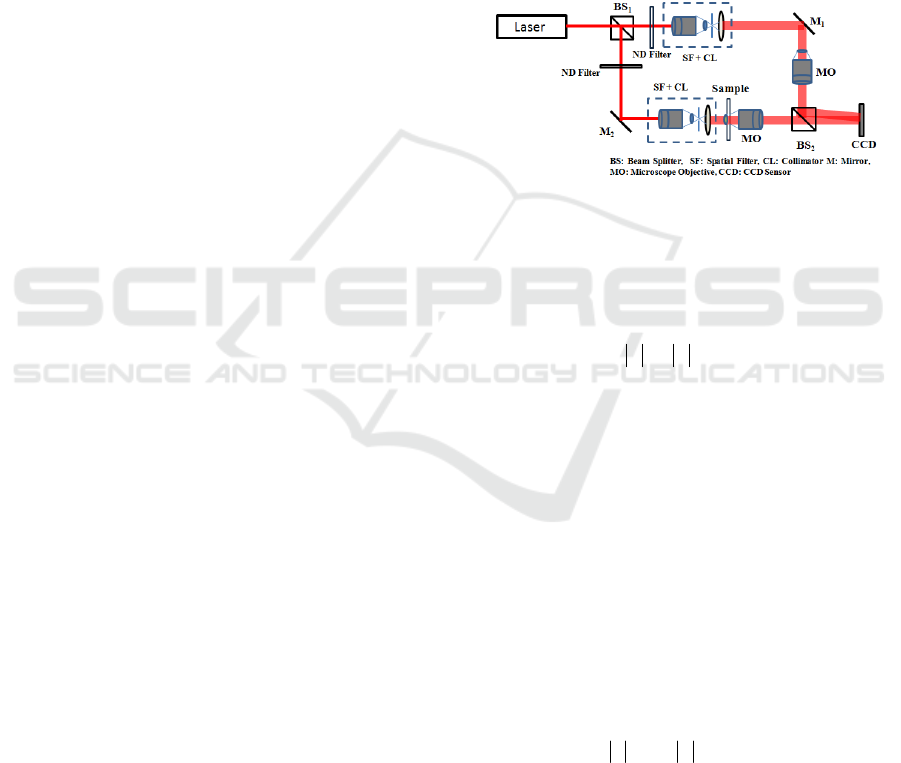
Figure 1 shows the schematic of experimental set up
of digital holographic microscope. The Experimental
set up is based on Mach- Zehnder interferometer. A
5 mW He-Ne laser (Make – Melles Griot, λ=632.8
nm) is used as a light source. Light from the laser
source is divided into two beams using a beam
splitter BS1. One of the beams acts as a reference
beam and the other acts as an object beam. Light in
the two arms of the interferometers are expanded
and collimated by assembly of spatial filter (SF)
[Make – Newport Corp.] and collimating lens (CL).
Light in the one arm is passed through the object
under test (micro-lenses array). In the experiment,
round shape and plano – convex micro lens array
supplied by THORLABS with micro lens sag height
(h=0.87 μm), diameter (D=146 μm) and radius of
curvature (ROC=3.063 mm) was used. The object
under test was mounted on 2D translation stage in
the object arm of the Mach-Zehnder interferometer
and a microscope objective (20 X, NA=0.40) was
used to increase the lateral resolution of the digital
holographic microscopic system. A similar
microscope objective (20X, NA=0.40) was also used
in the reference arm of the interferometer to match
the curvature in the object and reference wavefront.
A minute angle is introduced in the reference beam
to make the off axis holographic system. The
microscope objectives in both arms and beam
splitter are adjusted in such a way that the
interference fringes are straight; this avoids the need
to perform any digital correction due to spherical
aberration introduced by microscope objectives
(Anand et al., 2011, p. 547). ND filters are used in
the reference arm and object arm to adjust the
intensity for recording good contrast fringes in the
hologram. All the optical components (mirrors,
lenses, beam splitters, ND filters) used in the
experiments are supplied by M/S Melles Griot
(Netherland).
Figure 1: Mach-Zehnder interferometer based Digital
Holographic Microscope for testing of micro lens array.
The object beam interferes with the reference
beam at the hologram plane (CCD Plane). The
hologram with intensity (Schnar and Juptner, 2005)
**
22
),( ROORORYXH +++=
(1)
is recorded by CCD sensor (Make – Lumenera
Corporation, Model – Infinity3-1M). In equation 1,
R is the reference wavefront and O is the object
wavefront, and * denote the complex conjugate. The
pixel size on CCD sensor is 6.45μm ×6.45μm. Total
numbers of pixels are 1392×1040 and the sensor
chip dimension is 2/3". Dynamic range of the CCD
sensor is 8-bit. Computer with 64 bit Intel (R) Core
(TM) i5 microprocessor and CPU clock rate of 3.2
GHz was used to process the data. The digital
hologram is stored in computer for further
processing. In order to reconstruct the digital
hologram, a digital reference wave R
D
is used to
reconstruct the digital transmitted wavefront O(m
,n), and is given by (Schnar and Juptner, 2005).
**
22
RORORRORRRHRO
DDDDD
+++==
(2)
At right hand side of equation (2), first two terms
are dc term and correspond to the zero order
diffraction and the third term is the twin image. The
fourth term is the real image. To avoid the overlap
between these three components (dc term, twin
image and real image) during reconstruction, the
Testing of Micro-optics using Digital Holographic Interferometric Microscopy
143
hologram is recorded in off – axis geometry. For this
purpose, angle of reference beam (θ) with normal to
CCD plane is adjusted such that θ is sufficiently
large enough to ensure separation between real and
twin images in reconstruction plane. However, the
angle θ should not small enough so that spatial
frequency of micro interference pattern does not
exceed than the resolving power of CCD sensor
(Schnar and Juptner, 2005, p. R92).
2.1 Hologram Reconstruction
In digital holography reconstruction of object
wavefront is done by numerical methods by
simulating the diffraction of reference wave at the
microstructure of recorded digital hologram using
scalar diffraction theory. The most commonly used
numerical reconstruction methods are Fresnel
reconstruction method, convolution method, and
phase shifting method. The diffraction of
reconstructing wave at the digital hologram is
described by the Fresnel-Kirchhoff integral (Schnar
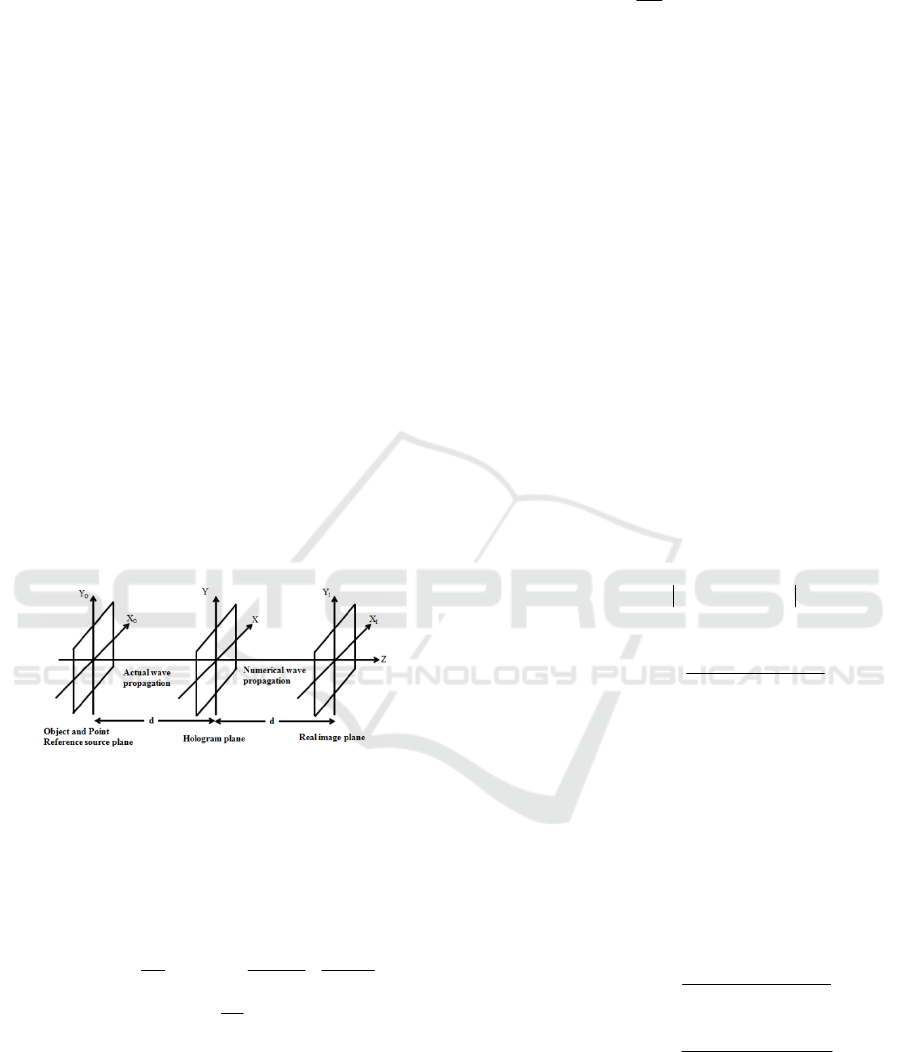
and Juptner, 2005, p. R90; Wagner et al., 1999). (X
O
,
Y
O
), (X, Y), and (X
I
, Y
I
) are the Cartesian co-ordinate
system of the object, hologram and image planes
respectively (see Fig. 2).
Figure 2: Cartesian co-ordinate system used in the Fresnel
Reconstruction method.
The digital form of complex amplitude of
diffracted wave in the reconstruction (image) plane
using the Fresnel-Kirchoff diffraction integral with
the Fresnel approximation is given by (Kumar et al.,
2015, p. 1258)
)]}(exp[),(),({
)](exp[),(
2222
22
2
22
2
YqXp
d
iqpHqpRFFT
YN
n
XM
m
di
d
i
YnXmO
D
II
Δ+Δ−×
Δ
+
Δ
−=ΔΔ
λ
π
λπ
λ
(3)
where m, n and p, q are the integers (m, p = 0, 1,
2, 3,..........M-1; and n, q = 0, 1, 2, 3,..........N-1). M ×
N are the number of pixels in the CCD sensor.
Δ
X
and
Δ
Y are the pixel size of CCD sensor. H (p, q) is
the recorded digital hologram, λ is the wavelength,
and d is the reconstruction distance respectively.
If we assume that reference wave is a plane wave
of wavelength λ, R
D
can be expressed as:
()
⎥
⎦
⎤
⎢
⎣
⎡
Δ+Δ= yqkxpkiR
yxD
λ
π
2
exp
(4)
Where k
x
and k
y
are the components of wave vector.
To remove the dc term and -1 order term, the
recorded raw digital hologram H (p, q) is filtered in
Fourier domain (Takeda et al., 1989; Cuche et al.
2000). For this purpose, first we perform the Fourier
transform on H (p, q), and the Fourier spectrum of H
(p, q) gives the zero order term (dc term), +1 order
and -1 order. Now to remove the dc term and -1
order term, rectangular band pass filter is applied on
the +1 order term. The inverse Fourier transform of
the selected spectrum (+1 order) provide the
complex amplitude containing information about the
object wavefront O (m
Δ
X, n
Δ
Y, Z=0). Complex
amplitude O (m
Δ
X, n
Δ
Y, d) at a distance d parallel to
CCD plane is computed from the filtered spectrum
by using equation (3).
Numerical reconstruction of recorded digital
hologram H (p, q) yields the complex amplitude of
object wavefront. Once the complex amplitude of
object wavefront is calculated, the intensity and
phase of the object can be calculated. The intensity
of object wavefront is calculated as (Schnar and
Juptner, 2005, p. R89)
2
),(),(
IIII
YnXmOYnXmI ΔΔ=ΔΔ
(5)
The phase is calculated as
)],(Re[
)],(Im[
arctan),(
II
II
II
YnXmO
YnXmO
YnXm
ΔΔ
ΔΔ
=ΔΔ
φ
(6)
where, the operators Re and Im denote real and
imaginary part of a complex function.
The phase of the two states of object (initial and
final) are evaluated individually from complex
amplitude of object wave front in two states
),(
1 II
YnXmO ΔΔ
and
),(
2
II
YnXmO ΔΔ
.
Interferometric comparison i.e. phase difference
provide information about change between two
states. The phase of initial state and final states can
be written as
)],(Re[
)],(Im[
arctan),(
1
1
1
II
II
II
YnXmO
YnXmO
YnXm
ΔΔ
ΔΔ
=ΔΔ
φ
(6a)
)],(Re[
)],(Im[
arctan),(
2
2
2
II
II
II
YnXmO
YnXmO
YnXm
ΔΔ
ΔΔ
=ΔΔ
φ
(6b)
The phase takes values between –π and π, the
principal value of arctan function. The interference
phase, which is phase difference between the phase
in presence of object (micro-lens array) and absence
of micro lens array, is calculated by modulo 2π
subtraction (Schnar and Juptner, 2002, p. R94)
PHOTOPTICS 2016 - 4th International Conference on Photonics, Optics and Laser Technology
144
()
()() () ()
()() ()()
⎩
⎨
⎧
<+−
≥−
=Δ
nmnmifnmnm
nmnmifnmnm
nm
,,2,,
,,,,
,
1212
1212
φφπφφ
φφφφ
φ
(7)
The modulo 2π phase difference map of micro
lenslet array and ambient air is unwrapped using
Goldstein phase unwrapping method to remove the 2
π phase discontinuity (Goldstein, 1988).
3 EXPERIMENT RESULTS AND
DISCUSSION
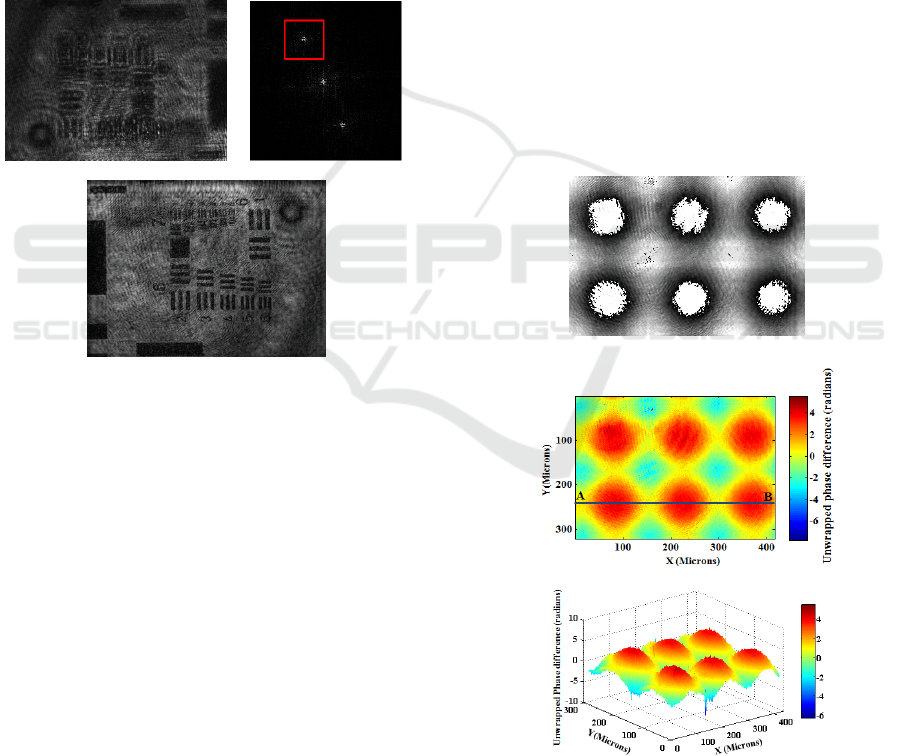
Initially the experiment was carried out on USAF
resolution test chart. Figure 3(a) shows the recorded
hologram of the USAF Resolution test target.
(a) (b)
(c)
Figure 3: (a) Hologram of USAF resolution chart (b)
Fourier spectrum of hologram (c) Intensity image.
A Fourier spectrum of the hologram gives the
virtual image, real image and dc term (zero order
diffraction). Figure 3 (b) shows the Fourier spectrum
of the recorded digital hologram of USAF resolution
test chart. A band pass rectangular filter is applied to
remove the dc term and twin image. Inverse Fourier
transform gives complex amplitude of object
wavefront at CCD plane. Complex amplitude of
object wavefront in reconstruction plane is
calculated by solving equation (3). The intensity
image of the USAF resolution test chart is evaluated
using equation (5) and is shown in Figure 3(c). From
the intensity image of resolution test target, it is
clear that we are able to resolve the small details of
6
th
element of 7
th
group and it corresponds to 228.1
lines pair/mm (i.e width of one line is 2.19 μm in
USAF resolution test target). For resolving one line,
the width of one line (2.19 μm) should be covered
by at least two pixels. The achieved resolution
(1.095 μm) from the holographic set up agrees with
the predicted resolution limit of the microscope
objective (20X, NA=0.40). The resolution limit of
microscope objective is given by Abbe criterion
(0.61λ/NA = 0.965 μm).
3.1 Results of Testing of Micro-lens
Array
First, we record a digital hologram of ambient air (in
absence of micro-lens array) as a reference
hologram. Now, micro-lenses array is mounted on
2D translational stage and inserted in the object arm
of the Mach–Zehnder interferometer. In presence of
micro-lenses array second digital hologram is
recorded. Phases in the two individual states of
object (ambient air and presence of micro-lenses
array) are numerically reconstructed from equation
(6a) and (6b) respectively. Fig.4 (a) shows the
modulo 2π phase difference map of micro-lenses and
ambient air. The modulo 2π phase difference map of
micro- lenses and ambient air is unwrapped using
Goldstein phase unwrapping method to remove the 2
(a)
(b)
(c)
Figure 4: (a) Modulo 2π phase difference, (b) 2D
unwrapped phase difference map of Micro-lens array and
ambient air, and (c) 3D unwrapped phase difference map
of Micro-lens array and ambient air.
Testing of Micro-optics using Digital Holographic Interferometric Microscopy
145
π phase discontinuity. Fig. 4(b) shows the 2D
unwrapped phase difference map of micro-lens and
ambient air. Fig. 4(c) shows the 3D unwrapped
phase difference map of micro-lenses and ambient
air.
Now the optical path length difference (
Δ
n × h)
can be connected to experimentally calculated
unwrapped phase difference through the equation
hn ×Δ=Δ
λ
π
φ
2
(8)
where
Δ
n is the refractive index change (n-n
0
), n is
refractive index of micro-lens material and n
0
is the
refractive index of ambient air, and h is the distance
travelled by laser light (λ=632.8 nm) through the
micro-lens array.
Micro-lenses array is made up of fused silica.
Consider, the refractive index of micro lenses array
material is homogeneous. The refractive index of the
fused silica is n = 1.457 at wavelength 632.8 nm.
Refractive index of air n
0
=1. The height distribution
of the micro-lenses can be evaluated from equation
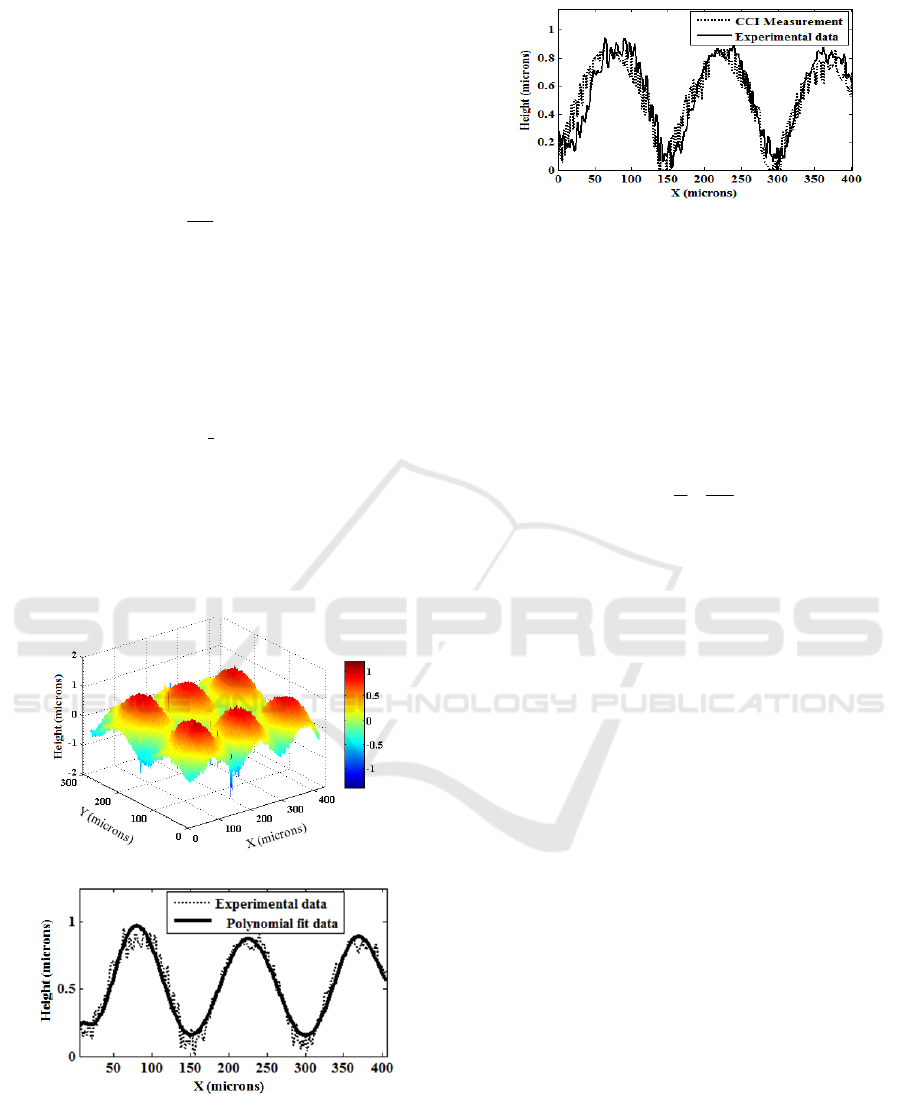
(8). Fig. 5(a) shows the 3D height map of the micro-
lenses array. Fig. 5(b) shows the height profile of
micro-lenses along the line AB as marked in Fig.
4(b).
(a)
(b)
Figure 5: (a) 3D height map of micro-lens Array (b)
Height profile of micro-lenses along the line AB as
marked in Fig. 4(b).
Figure 6: Comparison of height profiles of micro-lenses
array obtained by digital holographic interferometric
microscopy (DHIM) and Coherence Correlation
Interferometer.
The diameter of micro-lens in the micro-lenses
array is D=146 μm and experimentally evaluated
maximal height (sag) of micro-lens of micro-lens
array is h = 0.81 μm. From these values, the radius
of curvature (ROC) is computed according to
equation (Kühn et al., 2007).
h
Dh
ROC
82
2
+=
(9)
The computed value of radius of curvature of the
micro-lens array is 3289.91 μm. The sag height of
micro-lens agrees well within the experimental limit
as provided in the specification by the manufacturer
(0.87 μm).
Height profile of micro-lenses measured by
DHIM is compared with commercially available
Coherence Correlation Interferometer
(Manufacturer: Taylor Hobson Ltd. UK, Axial
resolution 0.1 A
0
). Fig.6 shows the comparison of
height profiles of micro-lenses array obtained by
DHIM and Coherence Correlation Interferometer
(CCI). Root mean square error (RSME) between the
measurement done by DHIM and CCI is 0.12 %.
4 CONCLUSIONS
In this paper Mach- Zehnder based off- axis digital
holographic interferometric microscope (DHIM) is
applied to test the micro-lens array. In the
experiment, round shape and plano – convex micro
lens array supplied by THORLABS with micro lens
sag height (h=0.87 μm) and radius of curvature
(ROC=3.063 mm) was used. The measured value of
sag height (h=0.81 μm) and radius of curvature
(ROC=3.289 mm) of micro-lens array by using
DHIM and data supplied by manufacturer deviate by
0.6 μm (h=6.89 %) and ROC =7.4% respectively.
PHOTOPTICS 2016 - 4th International Conference on Photonics, Optics and Laser Technology
146

ACKNOWLEDGEMENTS
The financial assistance received from the Defence
Research and Development Organization (DRDO),
Ministry of Defence, Government of India, under the
project entitled ‘Testing of micro optics using digital
holographic interferometry’ is highly acknowledged.
REFERENCES
Sinzinger, S., and Jahns, J., (1999). Micro-optics. New
York: Wiley.
Anderson, R. H. (1997) Close-up imaging of documents
and displays with lens arrays, Appled Optics, 18 (4),
p. 477- 484.
Cormick, F. B. Mc., Tooley, F. A. P. , Cloonan, T. J.,
Sasian, J. M., Hinton, H. S., Merserau, K. O., and
Feldblum, A. Y. (1999) Optical interconnections using
microlens arrays. Optical and Quantum Electroics. 24
(4). p. S465-S477.
Hou, T., Zheng, C., Bai, S., Ma, Q., Bridges, D., Hu, A.,
and Duley, W. W. (2015) Fabrication,
characterization, and applications of microlenses.
Applied Optics. 54(24), p. 7366-7377.
www.suss-microoptics.com
Reichelt, S. and Zappe, H. (2005) Combined Twyman–
Green and Mach–Zehnder interferometer for
microlens testing. Applied Optics. 44(27), p. 5786-
5792.
Weible, K. J., Volkel, R., Eisner, M., Hoffmann, S.,
Scharf, T., and Herzig, H. P. (2004) Metrology of
refractive microlens arrays in Optical Micro- and
Nanometrology in Manufacturing Technology, Proc.
SPIE. 5458, p. 43–51.
Wahba, H. H., and Kreis, T. (2009) Characterization of
graded index optical fibers by digital holographic
interferometry. Applied Optics. 48 (8), p. 1573-1582.
Zhang, T., and Yamaguchi, I. (1998) Three-dimensional
microscopy with phase-shifting digital holography.
Optics Letter. 23(15), p. 1221-1223.
Charrière, F., Kühn, J., Colomb, T., Cuche, F. M., E.,
Emery, Y., Weible, K., Marquet, P., and Depeursinge,
C., (2006) Characterization of microlenses by digital
holographic microscopy. Applied Optics. 45(5), p.
829-835.
Schnars, U., and Jüptner, W., (1994) Direct recording of
holograms by a CCD target and numerical
reconstruction. Applied Optics. 33(2), p. 179–181.
Cuche, E., Marquet, P., and Depeursinge, C., (1999)
Simultaneous amplitude and quantitative phase-
contrast microscopy by numerical reconstruction of
Fresnel off-axis holograms. Applied optics. 38(34), p.
6994–7001.
Cuche, E., Bevilacqua, F. and Depeursinge, C., (1999)
Digital holography for quantitative phase-contrast
imaging. Optics Letter. 24(5), p. 291-293.
Schnars, U., and Jueptner, W. (2005) Digital Holography:
Digital Hologram Recording, Numerical
Reconstruction and Related Techniques. Berlin,
Germany: Springer-Verlag.
Anand, A., Chhaniwal, V. K., and Javidi, B., (2011),
Imaging embryonic stem cell dynamics using
quantitative 3-d digital holographic microscopy. IEEE
Photonics Journal. 3(3), p. 546-554.
Schnars, U. and Juptner, W. P. O. (2002) Digital
recording and numerical reconstruction of holograms.
Measurement Science and Technology. 13, p. R85–
R101.
Wagner, C., Seebacher, S., Osten, W., and Juptner, W.,
(1999) Digital recording and numerical reconstruction
of lensless Fourier holograms in optical metrology.
Appied Optics, 38(22), p. 4812– 4820.
Kumar, V., and Shakher, C, (2015) Study of heat
dissipation process from heat sink using lensless
Fourier transform digital holographic interferometry,
Applied Optics. 54 (6), p. 1257-1266.
Takeda,M., (1989) Spatial-carrier fringe-pattern analysis
and its applications to precision interferometry and
profilometry : an overview. Proc. SPIE. 1121. p. 73-
88.
Cuche, E., Marquet, P., and Depeursinge, C., (2000)
Spatial filtering for zero-order and twin-image
elimination in digital off-axis holography. Applied
Optics. 39(23), p. 4070-4075.
Goldstein, R. M., Zebker, H. A., and Werner, C., (1988)
Satellite radar interferometry: two-dimensional phase
unwrapping. Radio Science. 23(4), p. 713–720.
Kühn, J., Charrière, F., Colomb, T., Cuche, E., Emery, Y.,
and Depeursinge, C., (2007) Digital holographic
microscopy for nanometric quality control of micro-
optical components. Proc. of SPIE, 6475.
Testing of Micro-optics using Digital Holographic Interferometric Microscopy
147
