
A Method to Improve the Precision of Interferometric
Phase-recognization under Open-loop PZT Drive
Liangen Yang, Xuanze Wang, Bingkang Liu, Zhongsheng Zhai and Tao He
School of Mechanical Engineering, Hubei University of Technology, Nanhu, Wuhan, China
Keywords: Phase Recognization, Four Steps Algorithm, Ellipse Fitting, Lagrange Interpolation, Open-loop PZT Drive.
Abstract: For the monochromatic light interferometry under open-loop PZT drive, a high precision method for phase
recognization that satisfies the four steps phase-shift algorithm is proposed. The total idea of the phase
recognization method is as follows. Firstly, two pixels with suitable phase-difference are selected from the
interference field and the interference equations of the two pixels' gray values are established in one driven
cycle of PZT. Secondly, the parameters of interference equations can be obtained by using ellipse fitting
algorithm. Thirdly, the point-to-point step length of PZT drive and sequence phases can be determined
through reverse calculation of sequence phases. Finally, in order to calculate initial phase of every pixels
four interference grayscale images that meet the four steps phase-shift algorithm are designed and calculated
through Lagrange parabolic interpolation. The experimental results have shown that this method decreases
the requirement for hardware, environment and needs less interference grayscale images than traditional
methods. The method can meet the high precision demands of surface topography measurement and has
high processing speed.
1 INTRODUCTION
In the interference measurement of surface
topography by monochromatic light or quasi
monochromatic light, the calculation accuracy of
interferometric phase determines directly the
accuracy of the measurement results. Therefore, the
phase information should be accurately extracted
before unwrapping operation for the interferometric
phase. At present, there are many ways to extract
interferometric phase. For example, three-step
method (Wyant et al., 1984), four-step method
(Wyant, 1982), five-step method (Hariharan et al.,
1987), FFT algorithm (Wang and Da, 2012), wavelet
transform (Cui et al., 2012), phase retrieval method
used for wavelength-scanning (Liu et al., 2014) or
wavelength-tuning Interferometer (Kato and
Yamaguchi, 2000) and so on. The essence of these
algorithms is to obtain the initial phases of
interference sequence of every pixel by eliminating
the influence of amplitude and offset parameters.
The difference among three-step method, four-step
method and five-step method is the anti-noise-
interference ability. The FFT algorithm requires the
interference sequence for a complete cycle and
always needs a large amount of data processing. As
a result, it has low efficiency. Futhermore, these
methods require PZT be closed-loop controlled,
which increases the difficulty and cost of driver
element (Deng, 2014). Because tiny vibration during
measurement process will lead to the driving step
length change and has a great influence on the final
measurement results, the measurement system has
also very high requirements for measuring
environment.
An algorithm for calculating the interference
phase through arbitrary driving step lengths was
presented (Hao et al., 2009). The requirement of the
approach is as follows. Firstly, find out the
maximum and the minimum gray values of a point
in the interference field from the sequence
interference grayscale images. Then the sequence
phases are calculated. Finally, the sequence phases
of every point in the interference field are computed.
The method doesn't require controlling the driving
step length of PZT, but it costs more time on image
acquisition and needs more interference images than
other methods. When the number of interference
images is small, the real maximum and minimum of
gray values cannot be found out. As a result, this
method cannot be used.
Yang, L., Wang, X., Liu, B., Zhai, Z. and He, T.
A Method to Improve the Precision of Interferometric Phase-recognization under Open-loop PZT Drive.
DOI: 10.5220/0005737701230129
In Proceedings of the 4th International Conference on Photonics, Optics and Laser Technology (PHOTOPTICS 2016), pages 125-131
ISBN: 978-989-758-174-8
Copyright
c
2016 by SCITEPRESS – Science and Technology Publications, Lda. All rights reserved
125
This paper has two core problems need to be
solved. The first is how to obtain the initial phase
information of every pixel in the interference field
based on sequence grayscale images under the open-
loop drive conditions of PZT. The second is to
ensure phase information has high recognition
precision and recognition precision is not effected by
environment.
Based on four-step method, this paper proposed a
high accuracy phase recognition method that doesn't
require PZT to be equal driving step length. The
main idea is to acquire exactly the interference
sequence phases or step lengths of PZT by ellipse
fitting algorithm according to gray correlation
information of every pixel in the interference field
based on the interference equations. By extracting
sequence phases of interference grayscale images
and Lagrange parabolic interpolation algorithm (Liu
et al,2010), four interference grayscale images with
phase difference π/2 which meet requirement for
calculation of four-step phase-shift method are
calculated and constructed. Finally, through
interference grayscale images, phase information of
every pixel in the interference field can be obtained
by using four-step method.
2 CALCULATION METHOD OF
PZT DRIVING STEP LENGTH
In theory, gray values g
i
of every pixel in the
interference field satisfies the expression:
CAg
ii
)cos(
0
(1)
Where i is the No. of driving sequence points
i=1,…, N. θ
i
is the driving sequence phases. A, C, θ
0
are the amplitude, offset and initial phase of every
pixel.
The relation between θ
i
and driving displace-
ment Δ
i
satisfies equation (2):
/4
ii
(2)
Therefore, the driving step length of PZT is
proportional to the interferometric phase. The key to
determine the driving step length is obtain driving
phase of every point in interference sequence θ
i
. The
calculation of θ
i
depends on the calculation of A and
C when the gray values are known. In this section
we discuss how to calculate A and C.
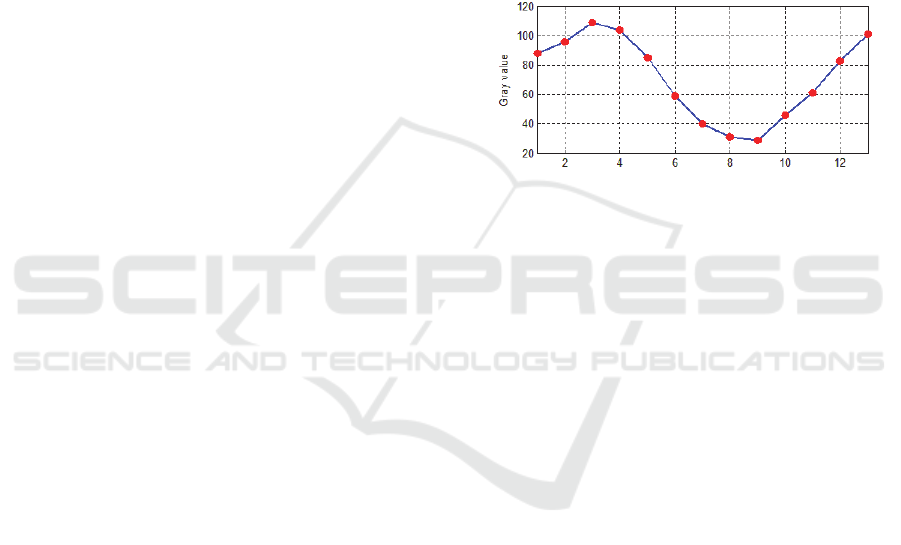
13 sequence phases of a pixel is shown in Fig.1.
The figure shows clearly that the driving step
lengths don't satisfy the equal step lengths condition,
because the sequence gray curve should be an
approximate the trigonometric function curve if the
driving step lengths are equal. This means the gray
values with large random noise.
2.1 Establishment of Interference
Equations
By taking it into account that every point in the
interference field has the same driving step length or
sequence phases at any time of PZT drive and by
choosing two points arbitrarily, sequence gray
values equations can be established as follows:
Figure 1: Sequence gray values of single pixel.
2
2
0
2
1
22
11
0
111
)cos(
)cos(
CAg
CAg
ii
ii
(3)
If g
1i
, g
2i
are respectively the transverse and
longitudinal coordinates, the theoretical trajectory of
sequence points should be an ellipse. The centers of
the ellipse are respectively C
1
, C
2
. The parameters of
the ellipse are determined by alternating amplitude
A
1
, A
2
and initial phase difference (θ
20
-θ
10
) between
two pixels. The trajectory is a positive ellipse when
the phase difference is π/2.
Parameters C
1
, C
2
, A
1
, A
2
and (θ
20
-θ
10
) can be
obtained through ellipse fitting. The fitting accuracy
of the parameters is mainly affected by the noise of
pixel gray values and the oval shape.
2.2 Method to Improve the Fitting
Precision of the Interference
Equations
Because the fitting accuracy of ellipse parameters is
influenced by the noise of gray values of pixels and
shape of the ellipse, the pixel points used for fitting
should be selected properly and de-noise processing
for the gray values of pixel points should be
conducted.
The gray values of interference sequence satisfy
orthogonal relation and fitted ellipse has highest
PHOTOPTICS 2016 - 4th International Conference on Photonics, Optics and Laser Technology
126
accuracy when the phase difference between two
pixels is π/2. Therefore, the phase difference
between two pixels used for ellipse fitting should
meet requirement of π/2 as far as possible. The
adopted scheme is as follows.
Firstly, the sequence gray values of every pixel
should be calculated as follows in specified area
(where has high SNR):
2
121
1
N
N
mn mn
iiN
mn
N
mn
i
gi gi
s
gi
(4)
Where s
mn
is in [-1,1]. In order to get two points
whose phase difference is π/2, the maximum and the
minimum in absolute values of s
mn
are selected as
the fitted objects. It can be proved in theory that the
phase difference between two pixel points is close to
π/2, which is conducive to enhancing the accuracy of
ellipse fitting.
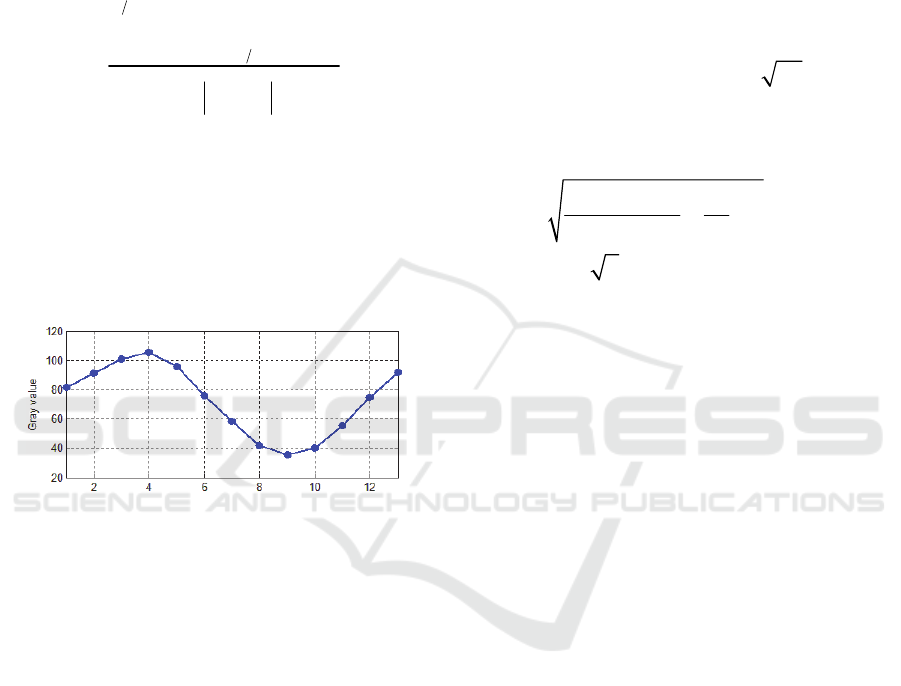
Figure 2: Neighborhood average sequence gray values.
Secondly, for the two selected pixel points, de-
noise processing can be conducted by neighborhood
average operation for gray values in order to
eliminate the random noise.
The sequence gray average values of
neighborhood 100 points of a pixel is shown in
Fig.2. Compared to Fig.1, the random noise of
sequence gray values has been greatly suppressed by
observing the variation trend of every point's slope
on the curve or the degree of curve smoothing. Fig.2
has shown that the open-loop PZT drive has
disadvantage of unequal linear step lengths.
2.3 Solving Method of Ellipse Fitting
The ellipse fitting is mainly to obtain the regression
coefficients by linear regression of elliptic equation
in a rectangular coordinate system. Then the
parameters of interference equations can be
calculated according to the relation between the
regression coefficients and these parameters.
The elliptic rectangular coordinate equation of
interference equations is shown as below:
0
21
2
21
2
1
2
ddgcgbggagg
iiiii
i
(5)
Where the parameters a, b, c, d, e can be
obtained by regression calculation based on the
linear least squares fitting. Through the relation
between the parameter equation and coordinate
equation, equation (6) can be derived:
1
20 10
2
2
12
2
1
1
21
cos ( / 4 )
(2)/(4 )
()/2
(2)
/sin
44
/
ab
Cacd ba
CcaC
Cac d
c
Ae
AA b
(6)
Where the symbol of phase difference φ is
determined by the rotation direction of sequence
gray values in the ellipse. The symbol is negative
when the direction is counterclockwise, otherwise it
is positive. Vector cross product is adopted as a
method for judging symbol. The judgment equation
is as follows:
)0,,(
)0,,(),,(
222112
221111
cgcg
cgcgddd
zyx
(7)
If d
z
>0, the symbol is negative, otherwise it is
positive.
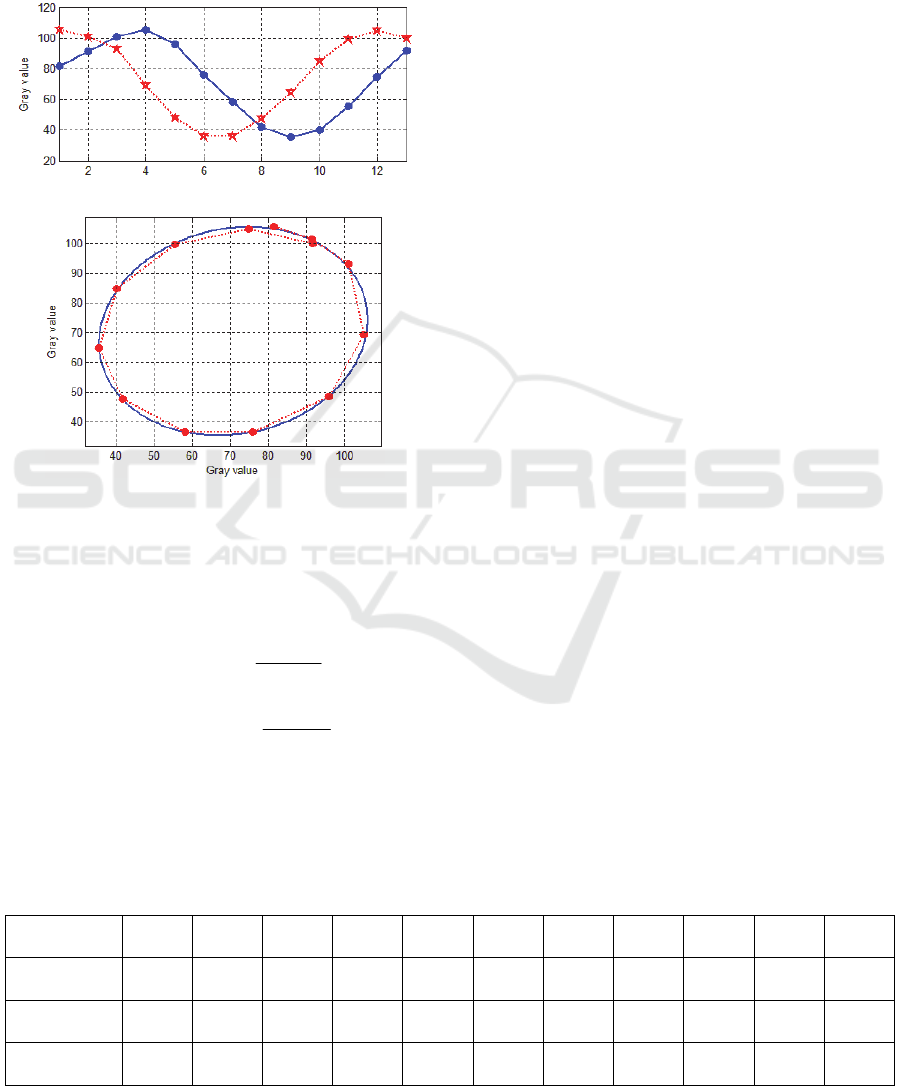
13 sequence gray values of two pixels after de-
noise processing and zero mean and ellipse fitting
result are shown respectively in Fig.3 (a) and (b).
Because the ellipse fitting accuracy of the data
points in integral period is higher than that of non-
integral period in the same conditions. Therefore, 13
points are used for ellipse fitting.
2.4 Inverse Calculation of Driving
Phases and Step Lengths
According to the result of ellipse fitting, the phase
calculation of two sequence gray values under
certain conditions may be started after getting the
parameters of equation (6). The conditions
mentioned above are as below: (a) the head and tail
points are not used in calculation. (b) Inverse
calculation of phases can be conducted when both
A Method to Improve the Precision of Interferometric Phase-recognization under Open-loop PZT Drive
127
the difference between gray values of the current
point and the front point
1ii
g
g
and the difference
between gray values of the current point and back
point
1ii
g
g
are positive or negative. Otherwise
calculation is not conducted.
(a)
(b)
Figure 3: (a) Sequence gray values of two pixels after de-
noise processing and zero mean; (b) ellipse fitting for
sequence gray values of two pixels.
The calculation equations are as follows:
1
11
1101
1
11 2
2202
2
cos
cos
i
ii
i
ii
gC
A
g
C
A
(8)
Where the symbol of phase is determined by the
differential symbol of current point. If
1
0
ii
gg
,
the symbol of phase is negative, otherwise is positive.
The sequence phases and synthetic phases of
sequence gray values are calculated in Table 1.
Besides the head and tail points, the points that
don't participate in inverse calculation include the
4th, 9th points on the dashed line and the 6th, 12th
points on the solid line in Fig.3.
Based on the fitting phase φ= 1.4543, the method
for calculating the synthetic phases of the 11 points
is as follows: if the phases of two corresponding
points in two sequences both exist, the synthetic
phase
12
()/2
iii
. If the phase only exist
in sequence 1,
1ii
. If the phase only exist in
sequence 2,
2ii
. By rounding with 2π, the
calculated phase is between (-π,π). The synthetic
phases are shown as the final row in Table 1.
10 actual point by point driving phases are
obtained by unwrapping and differential processing
for the 11 synthetic phases. The actual driving step
lengths of PZT can be got by equation (2). Fig.4
shows that actual step lengths of every point are
different from equal step lengths in theory.
3 CONSTRUCTION OF FOUR
INTERFERENCE GRAYSCALE
IMAGES
The four interference grayscale images with phase
difference 90 º can be constructed based on the
actual driving phases and step lengths. After ellipse
fitting, the calculation of actual phase is effective
from the 2th interference image of sampling
sequence. Therefore, the 2th interference grayscale
image is taken as an initial phase grayscale image g
0
and the rest 3 interference grayscale images with
phase difference π/2 are constructed. The
construction method is as follows.
Firstly, unwrapping calculation for the sequence
synthetic phases in Table 1 is conducted and the
starting point is offset to zero by a simple
calculation. The unwrapped phases before and after
Table 1: Sequence phases and synthetic phases.
Sequence
number
2 3 4 5 6 7 8 9 10 11 12
Sequence
phases 1 (rad)
1.032 0.717 X 0.892 1.442 1.892 2.387 X -2.445 -1.968 -1.472
Sequence
phases 2 (rad)
0.688 0.970 1.594 2.151 X -2.578 -2.170 -1.707 -1.198 -0.753 X
Synthetic
phases (rad)
-0.899 -0.601 0.139 0.795 1.442 2.071 2.523 3.122 -2.549 -2.087 -1.472
PHOTOPTICS 2016 - 4th International Conference on Photonics, Optics and Laser Technology
128
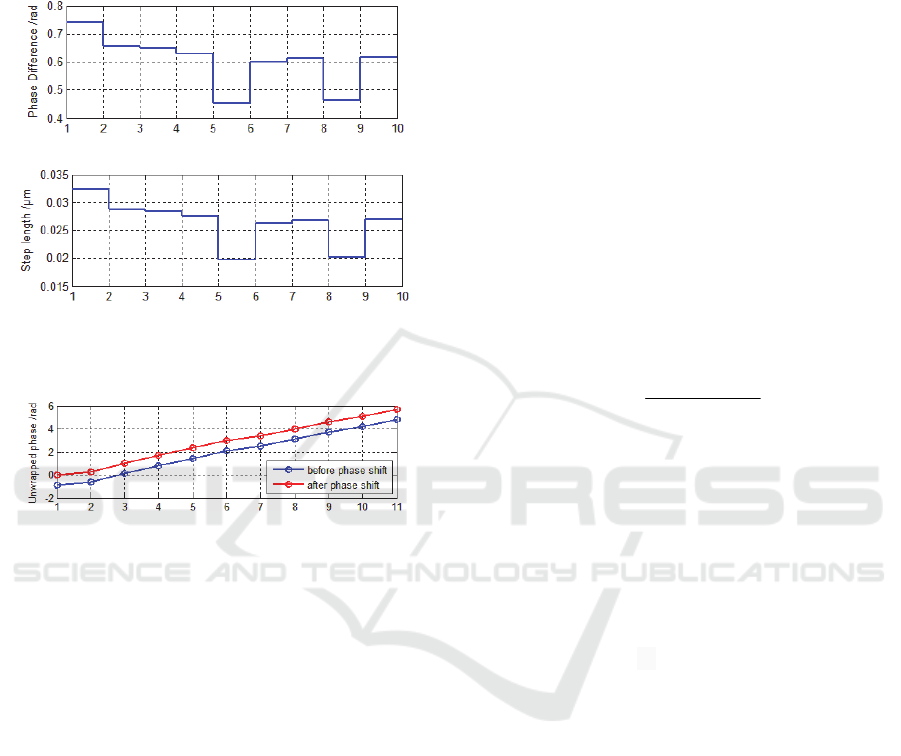
shift are shown in Fig. 5.
Then three points whose phases close to π/2, π
and 3π/2 are selected and the differences ε
1
, ε
2
and ε
3
between the three points and its target point are
calculated respectively.
(a)
(b)
Figure 4: (a) The real driving phases of PZT; (b) the real
driving step length of PZT.
Figure 5: The results of synthetic phases after unwrapping
operation.
For example, the three points in Fig. 5 whose
phases close to π/2, π and 3π/2 are the 4th, 6th and
9th point. Radian deviations which take the three
points as the center respectively are (-0.5324,
0.1231, 0.7698), (-0.8010, -0.1711, 0.2806) and (-
0.6912, -0.0789, 0.3828).
Finally, by using Lagrange parabolic
interpolation algorithm the grayscale images of
target phase are reconstructed. For example, the
equation to reconstruct the grayscale image of π/2 is
as shown in equation (9):
/2 12 23 34
gkgkgkg
(9)
Where g
2
, g
3
and g
4
represent respectively gray
values of the 2rd, 3th and 4th grayscale image.
The reconstruction coefficients k
1
, k
2
and k
3
can
be calculated by equation (10):
)])(/[(
)])(/[(
)])(/[(
2313213
3212312
3121321
k
k
k
(10)
The g
π
and g
3π/2
can be got by the same way. The
theoretical calculating data shows that the
truncation errors of gray values of the three
reconstructed grayscale images, which caused by
Lagrange interpolation, are less than 0.21%, 0.24%
and 0.13% respectively.
4 EXPERIMENTAL RESULTS
Taking a square wave specimen with multiple
grooves as measured surface, multi-wavelength
interference grayscales images are sampled and
phases of every sequence interference grayscale
image is extracted by above methods. Four grayscale
image after sequence interference grayscale images
which wavelength is 530nm are reconstructed and
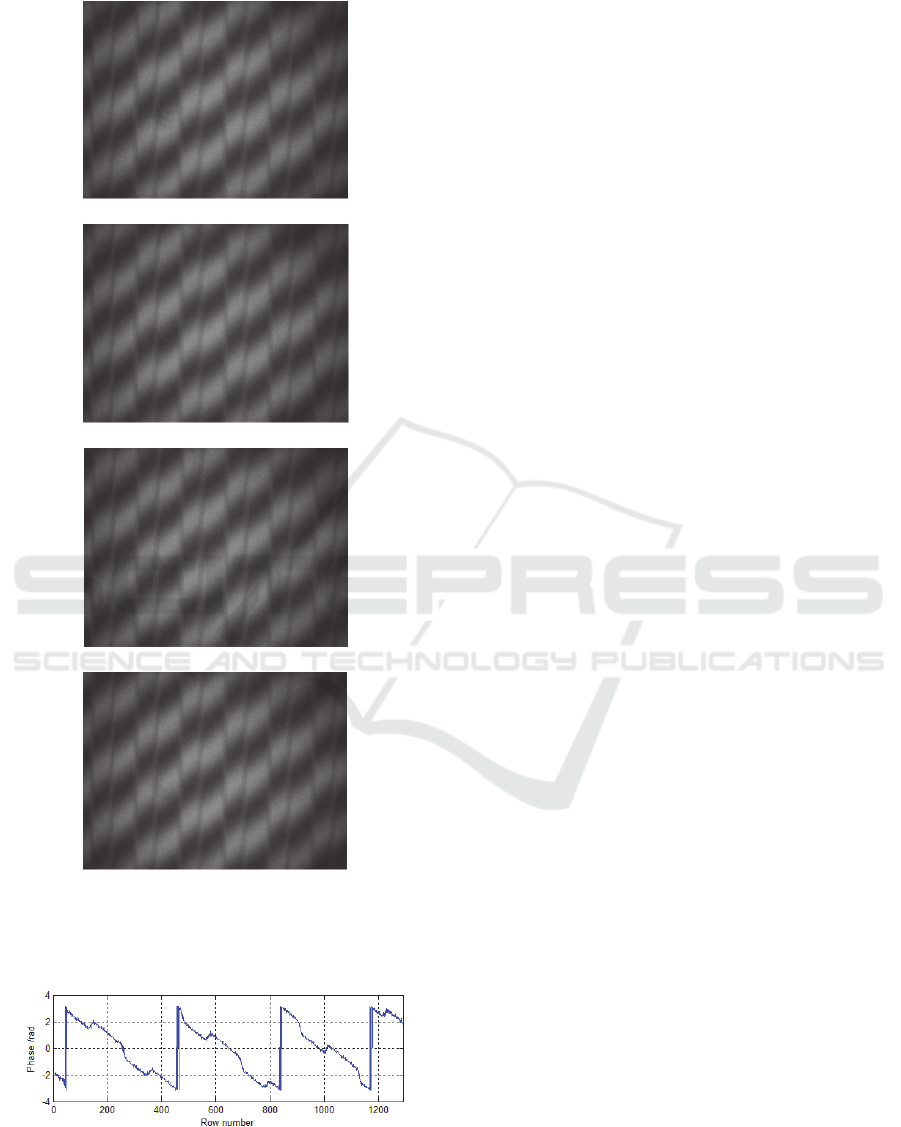
with phase difference π/2 are shown in Figure 6.
At last, phase of every point is calculated from
the reconstructed grayscale images. The equations
for calculation are as follows:
)(tan
0
2/2/3
1
0
gg
gg
(11)
The calculation results of phases of a row in the
interference grayscale image are shown in Fig.7. The
trend of obtained phases reflects the topography
change of square wave specimen with multiple
grooves well. Phases are extracted sequentially from
the sequence interference grayscale images
of 550nm and 640nm wavelength in the same
way. For two-wavelength measurement, if the
difference of wavelength is small, the measuring
range will enlarge quickly, but the measuring
accuracy will be very low (Houairi and Cassaing,
2009). So the phase differences between two near
wavelength (530nm, 550nm) are applied to recognize
the measurement result in a large scale. The phase
differences of two far wavelengths (550nm, 640nm)
are used to reduce the error of measurement result. At
last the phase of single wavelength (550nm) is used to
calculate final measurement result and the relative
heights of every point in the interference grayscale
image, namely the surface topography information,
are got (Warnasooriya and. Kim, 2007).
According to above method, the roughness Ra of
the square wave specimen with multiple
grooves is 0.4390μm by calculation. Based on the
highest national roughness standard of China, Ra of
the square wave specimen with multiple grooves is
calibrated by China National Institute Metrology is
0.44μm. The expand uncertainty of calibration
results is U
95
=5%. Therefore the relative
A Method to Improve the Precision of Interferometric Phase-recognization under Open-loop PZT Drive
129
measurement error δ of the above method is 0.23%.
(a)
(b)
(c)
(d)
Figure 6: Reconstructed four interference grayscale
images with π/2 phase-difference. (a)0º; (b)π/2; (c)π;
(d)3π/2.
Figure 7: The phase results of a row of interference
grayscale image.
5 CONCLUSIONS
The method requires only 12-14 sequence
interference grayscale images to complete the whole
operation and the amount of processing data is
smaller than that of the random driving step lengths
algorithm. It does not require strictly equal driving
step lengths and simplifies control for PZT in
traditional four step method. Through the incidence
relation between sequence gray values of two pixels,
the solution of driving step lengths is transformed to
ellipse fitting problem in the mathematics. The
actual driving step lengths and driving phases under
open-loop PZT drive are obtained accurately, which
provides conditions for constructing the four
sequence interference grayscale images with high
precision. The method has a guiding significance to
related technologies of phase recognition. The
relative error of reconstruction of gray values can be
controlled within 0.5% easily by using the Lagrange
parabolic interpolation algorithm. Therefore, the
PZT in the method is open-loop drive. This method
has good resistance to local environmental vibration
disturbance and the influence of nonlinear driving
error of PZT is small. The method reduces the
difficulty and cost of driving and close-loop control,
and lays a foundation for multi-wavelength
switching measurement.
ACKNOWLEDGEMENTS
The paper is supported by Natural Science
Foundation of China (No. 51275157, 51175154) and
Open Fund of State key Laboratory of Precision
Measuring Technology and Instruments of Tianjin
University ( No. PIL1209).
REFERENCES
James C. Wyant , Chris L. Koliopoulos , Bharat
Bhushan, Orrin E. George.( 1984) An optical
profilometer for surface characterization of magnetic
media. ASLE Trans.7, 101-113.
Wyant J C. (1982) Interferometric optical metrology:
basic systems and principles. Laser Focus 5,65-71.
Hariharan P., Oreb B., Eiju T. (1987) Digital phase-
shifting interferometry: a simple error-compensating
phase calculations algorithm. Applied Optics 26,
2540-2505.
Wang Chenxing, Da Feipeng. (2012) A Novel Windowed
Fourier Transform for Phase Retrieval in 3D Shape
Measurement. Acta Optica Sinica 32/6,0612005.
PHOTOPTICS 2016 - 4th International Conference on Photonics, Optics and Laser Technology
130

Cui Shilin, Tian Fei, Li Dehua. (2012) Phase Retrieval
Method with Continuous Wavelet Transform Based on
Exponent Spacing Scales. Acta Optica Sinica 32/7,
0712001.
Liu Jian, Tian Ailing, Liu Bingcai, Wang, Hongjun. (2014)
A Phase Extraction Algorithm in Wavelength Tuning
Interferometry. Acta Optica Sinica 34/3, 0312001.
Jun-Ichi KATO, Ichirou YAMAGUCHI. (2000) Phase-
Shifting Fringe Analysis for Laser Diode Wavelength-
Scanning Interferometer. Optical Review 7/2, 158-
163.
Linjuan Deng, Yunxia Fu, Xiaoyu Cai, Xiao Yu; Li,
Yuan; Lei, Li Hua; Zhao, Dong. (2014) Study on
Phase Shifting Algorithm and System of White Light
Interference. Advanced Materials Research 889-
890,749-754.
Qun Hao, Qiudong Zhu, Yao Hu. (2009) Random phase-
shifting interferometry without accurately controlling
or calibrating the phase shifts. Optics Letters 34/8,
1288-1290.
Liu Dong, Yang Yongying, Tian Chao, Luo, Yongjie;
Zhuo, Yongmo. (2010) Study on Phase Retrieval from
Single Close Fringe Pattern with High Precision.
Chinese J. Lasers 37/2, 531-536.
Kamel Houairi, Frederic Cassaing. (2009) Two-
wavelength interferometry: extended range and
accurate optical path difference analytical eatimator.
J.Opt. Soc. Am. A 26/12, 2503-2511.
N. Warnasooriya, M. K. Kim. (2007)LED-based multi-
wavelength phase imaging interference microscopy.
Opt. Express 15/15, 9239-9247.
A Method to Improve the Precision of Interferometric Phase-recognization under Open-loop PZT Drive
131
