
An Entropy-based Model for a Fast Computation of SSIM
Vittoria Bruni
1,2
and Domenico Vitulano
2
1
Dept. of SBAI, University of Rome La Sapienza, Via A. Scarpa 16, Rome, Italy
2
Istituto per le Applicazioni del Calcolo, CNR, Via dei Taurini 19, Rome, Italy
Keywords:
Information Theory, SSIM, Image Quality Assessment, Typical Set.
Abstract:
The paper presents a model for assessing image quality from a subset of pixels. It is based on the fact that
human beings do not explore the whole image information for quantifying its degree of distortion. Hence, the
vision process can be seen in agreement with the Asymptotic Equipartition Property. The latter assures the
existence of a subset of sequences of image blocks able to describe the whole image source with a prefixed and
small error. Specifically, the well known Structural SIMilarity index (SSIM) has been considered. Its entropy
has been used for defining a method for the selection of those image pixels that enable SSIM estimation with
enough precision. Experimental results show that the proposed selection method is able to reduce the number
of operations required by SSIM of about 200 times, with an estimation error less than 8%.
1 INTRODUCTION
A wide literature has definitely proved that embed-
ding and translating HVS concepts in image process-
ing based applications promote the optimization of
several applications in terms of efficiency, precision,
automaticity and, sometimes, computing time (Bruni
et al., 2012; Bruni et al., 2013a; Hontsch and Karam,
2002; Hou and Yau, 2010; Jourlin and Pinoli, 1998;
Lee and Lee, 2006; Panetta et al., 2008; Wang and
Li, 2011). In this context, the definition of mea-
sures for image quality assessment that correlate more
with human visual system plays a fundamental role
(Bruni et al., 2013b; Ferzli and Karam, 2009; Moor-
thy and Bovik, 2009; Sheikh et al., 2005; Wang et al.,
2004; Wang and E.P.Simoncelli, 2005; Wang and Li,
2011). Despite its recognized lack of correlation with
human perception, the classical mean squared error
(MSE) is still used in many applications, especially
in optimization problems, due to its simplicity, low
computational effort and nice mathematical proper-
ties. The Structural SIMilarity index (SSIM) (Wang
et al., 2004) revealed to be a robust competitor of
MSE thanks to its discrete correlation with HVS, its
definition through very simple operations and, as re-
centy proved, its interesting mathematical properties
that can promote its use, for example, in regulariza-
tion methods. Unfortunately, the computational cost
required by SSIM is higher than the one required by
MSE. SSIM is a pixelwise measure but it involves
block-based operations for each pixel
1
.
The aim of this paper is to speed up the compu-
tation of SSIM by computing it on a reduced num-
ber of blocks. This strategy mainly relies on the fact
that humans are able to assign a score to the image
just looking at few specific points, known as fixation
points (Monte et al., 2005; Frazor and Geisler, 2006).
This way of selecting information is closely related to
some concepts in Information Theory and, in partic-
ular, to the Asymptotic Equipartition Property (Cover
and Thomas, 1991). This principle states that for a
given source, there exists a subset of sequences ableto
represent the whole source — i.e. with entropy close
to the source entropy. Accordingly, in the context of
vision, there exists morethan one sequence of fixation
points of a given length that is able to code the whole
image information content. Hence, by defining the
visual distortion typical set as in (Bruni and Vitulano,
2014), we want to develop a method for extracting at
least one sequence belonging to this set from which
1
For the i−th pixel SSIM, is defined as follows:
SSIM(b
i
, d
i
) =
2µ
b
i
µ
d
i
+C
1
µ
2
b
i
+ µ
2
d
i
+C
1
σ
b
i
d
i
+C
2
σ
2
b
i
+ σ
2
d
i
+C
2
,
where b
i
and d
i
are blocks centered at i respectively in the
original and distorted image, µ
∗
and σ
∗
respectively are the
mean and the standard deviation of ∗, σ
b
i
d
i
is the correlation
between b
i
and d
i
, whileC
1
andC
2
are numerical stabilizing
constants.
226
Bruni, V. and Vitulano, D.
An Entropy-based Model for a Fast Computation of SSIM.
DOI: 10.5220/0005730002260233
In Proceedings of the 11th Joint Conference on Computer Vision, Imaging and Computer Graphics Theory and Applications (VISIGRAPP 2016) - Volume 4: VISAPP, pages 226-233
ISBN: 978-989-758-175-5
Copyright
c
2016 by SCITEPRESS – Science and Technology Publications, Lda. All rights reserved

assessing the quality of the whole image. With re-
spect to the literature concerning the selection of the
best pooling weights for an image quality assessment
measure (Moorthyand Bovik, 2009; Park et al., 2011;
Wang and Li, 2011)), the proposed method can also
be seen as a binary pooling, preserving some blocks
while discarding the others.
The proposed method consists of the following
main steps:
1. Luminance based image segmentation: the image
is split into a finite number of distinct regions hav-
ing different characteristics;
2. Finite random walk on a connected and weighted
graph whose nodes are the regions given by the
segmentation. This step provides a sequence of
points belonging to the typical set of length K.
K is automatically determined for each image us-
ing the Minimum Description Length principle
(MDL) (Grunwald, 2004).
It will be shown that the mean value of the SSIM eval-
uated on blocks centered at these points gives a faith-
ful estimationof SSIM of the whole image with a con-
siderable computational saving. Experimental results
on test images from TID2013 database (Ponomarenko
et al., 2015) show that it is possible to reach a speed
up for SSIM, evaluated for different distortion levels,
over 200:1 with a relative estimation error lower than
8%.
The outline of the paper is the following. The next
Section gives some preliminary results on the visual
distortion typical set. Section 3 presents a method
for determining a sequence of points belonging to
this set; details about the algorithm and its computa-
tional cost will also be given. Section 4 presents some
experimental results obtained on TID2013 database
while the last section draws the conclusions.
2 SOME PRELIMINARY
RESULTS
In (Bruni and Vitulano, 2014), the visual distortion
typical set A
ε
M
has been defined as a subset of all se-
quences composed of samples of the original image
I (and the corresponding ones in the degraded image
I
d
) such that they give an approximated value
ˆ
M of
the expected value of the measure M (i.e.
¯
M) within
an error ε, i.e.: |
ˆ
M −
¯
M| < ε, where M is the refer-
ence quality measure. In our case, M is the pointwise
SSIM,
¯
M is the mean of M computed using all im-
age pixels, while
ˆ
M is the mean of M computed on a
reduced number of image pixels. More formally, A
ε
M
is the set of sequences of fixed size whose entropy
is close to the entropy of the source. The existence
of A
ε
M
is guaranteed by the Asymptotic Equipartition
Property (AEP) (Cover andThomas, 1991), that states
that for i.i.d. r.v.s X
i
it holds:
1
n
log
1
p(X
1
,X
2
,..,X
n
)
→
H(X) n → ∞.
AEP is the entropic version of the weak law of
large numbers. However, the entropy based version
is more mathematically tractable as entropy increases
as the number of samples grows (Cover and Thomas,
1991), while it is not so for the mean value. Based
on these concepts, in (Bruni and Vitulano, 2014) the
authors gave some guidelinesfor an optimized extrac-
tion of the visual distortion typical set from the cou-
ple of images (I, I
d
). Specifically, it has been formally
proved that:
1. Not all information in I and I
d
is really important;
it is sufficient to select just a part of it for assess-
ing image quality. In addition, an entropy based
criterion can be applied for selecting the signifi-
cant information. Specifically, it has been proved
the following result:
Proposition 1. Let X ∼ Q with a positive and
numerical alphabet χ and {X
1
} ∼ p
1
, {X
1
, X
2
} ∼
p
2
, ..., {X
1
, X
2
, ..., X
n
} ∼ p
n
. Let µ
n
be the mean
of p
n
, µ be the mean of Q and D
KL
the Kullbach-
Leibler divergence. Then
(a) the sequence {µ
n
} is not monotonic for increas-
ing n;
(b) |µ
n
− µ|
2
≤ 2M
n
D
KL
(p
n
||Q) ∀n, with M
n
=
max
x∈χ
x.
This Proposition along with the known results on
the monotonicity of the entropy per element of a
stationary stochastic process (Cover and Thomas,
1991), support the use of the entropy as fun-
damental measure to use in the selection of se-
quences belonging to the visual distortion typical
set.
2. In the construction of the sequence of interest, it
is more convenient to select non overlapping local
regions (for instance, blocks) as samples of I (and
I
d
) rather than to randomly select isolated pixels.
3. It is more convenient to extract significant infor-
mation from M rather than from the couple of im-
ages I and I
d
.
What was missing in (Bruni and Vitulano, 2014) is a
constructive method for determining the typical set:
only its existence along with some criteria and guide-
lines for its best search have been provided. That is
why, in the sequel we will give an answer to the fol-
lowing question
4. How to find a sequence belonging to A
ε
M
using a
fast procedure.
An Entropy-based Model for a Fast Computation of SSIM
227

It is worth outlining that there is a wide literature
concerning fixation points (Frazor and Geisler, 2006;
Monte et al., 2005; Raj et al., 2005), i.e. those points
that allow to sinthesize and understand scene infor-
mation in the preattentive phase. Several approaches
for the determination of a subset of scene informa-
tion mainly rely on the construction of saliency maps
(Benabdelkader and Boulemden, 2005; Bruni et al.,
2011; Wang et al., 2010). However, to the best of au-
thors’ knowledge, there are not complete theoretical
formalisms that lead to a specific subset that can be
extracted in a limited time (Raj et al., 2005), as the
proposed approach does. In addition, unlike existing
methods that provide empirical and computationally
demanding strategies that lead to a specific solution
(i.e. a specified walk in the scene under exam), the
proposed approach proves the existence of more than
one walk given I, I
d
, M and ε, in agreement with the
concept of typical set in Information Theory (Cover
and Thomas, 1991).
3 THE PROPOSED MODEL
Fixation points vary from observer to observer since
they depend on personal cognitive experience, the
scope of the observation and image content. How-
ever, if we restrict to the class of natural images, some
rules of visual system, that guide the saccadic move-
ments in the preattentive phase, can be modelled in
an easier way. The characteristics of natural scenes
guided the adaptation of the visual system over time;
hence, their sources are the ones with which the visual
system is more familiar. In the first milliseconds of
scene inspection, fixation points are not conditioned
by the observer, but mainly by image features; that is
why only global distortions (affecting all image pix-
els) will be considered in the remaining part of the
paper. In fact, a local distortion would strongly orient
the path of fixations, that cannot be easy predictable
without additional information on the distortion kind.
The proposed method consists of the following
main steps:
1. Luminance based segmentation of the image I.
The output is a partition of the image in 2
L
re-
gions R
i
, i = 1, . . . , 2
L
having different charac-
teristics. To this aim the Successive Mean Quan-
tization Transform (SMQT) (Nilsson et al., 2005)
applied to the approximation band of the wavelet
expansion of the image has been employed.
2. Finite random walk on a connected and weighted
graph whose nodes are the regions R
i
, i =
Figure 1: From left to right top to bottom: Original image;
Image affected by additive gaussian noise; pointwise SSIM
map; Image affected by gaussian blur; pointwise SSIM
map.
1, . . . , 2
L
. This step provides a sequence belong-
ing to the typical set of length K. K is automat-
ically determined for each image using the Mini-
mum Description Length principle.
3.1 Luminance based Segmentation
The first step aims at discriminating image regions in
agreement with the visibility of distortion. In fact,
global distortions are not perceived in the same way
in the whole image. For example, as shown in Fig. 1
random noise is more visible in flat regions while it is
masked in textured regions. On the contrary, blurring
is more visible in textured regions than in flat regions.
Hence, the proposed method segments the image ac-
cording to this visibility criterion. Specifically, the
luminance value at a given fixed resolution has been
selected as the visibility criterion. Luminance is one
of the two measures that regulate the adaptation pro-
cess in the preattentive phase. The second one is the
contrast that has not been considered here for sim-
plicity. The resolution aims at simulating early vision
process, that essentially is a low pass filter whose cut-
off frequency depends on the viewing distance. In
order to speed up the segmentation process, the ap-
proximation band (low-pass component) at level J
(A
J
) of the dyadic wavelet expansion of the image
I has been computed (Mallat, 1998), since its dimen-
sion is
1
2
J+1
of the original image size. For segment-
ing A
J
, the Successive Mean Quantization Transform
(SMQT) has been adopted due to its simplicity and
reduced computational effort. SMQT builds a binary
tree using the following rule: given a set of data A
J
and a real parameter L (number of levels), split A
J
into two subsets,
A
J
0
=
n
x ∈ A
J
|A
J
(x) ≤
A
J
o
VISAPP 2016 - International Conference on Computer Vision Theory and Applications
228

and
A
J
1
=
n
x ∈ A
J
|A
J
(x) > A
J
o
,
where
A
J
is the mean value of A
J
. A
J
0
and A
J
1
are
the first level of the SMQT. The same procedure is
recursively applied to A
J
0
and A
J
1
until the L
th
level,
that is composed of 2
L
subsets (regions) that will be
denoted with R
1
, R
2
, . . ., R
2
L
.
3.2 Random Walk on a Connected
Graph
The fixation path is determined by suitably extracting
points from these regions. To this aim, the observa-
tion process has been modeled as a Markov chain, i.e.
random walk on a connected weighted graph whose
nodes are the 2
L
regions R
1
, R
2
, . . . , R
2
L
, with weights
W
ij
≥ 0 on the edge joining node i to node j. The
graph is undirected, i.eW
ij
= W
ji
, andW
ij
= 0 if there
is not an edge joining the node i to the node j.
Hence, given a point randomly extracted from the
region R
i
, the successive point in the walk is a ran-
dom point in the region R
j
chosen among the nodes
connected to R
i
with a probability
P
ij
=
W
ij
∑
i∼k
W
ik
(1)
that is proportional to the weight W
ij
. By denoting
with n
i
the number of pixels in the region R
i
, the
weights are defined as follows
W
ij
=
n
i
i = j
Z
ij
+Z
ji
2
i 6= j
(2)
where Z
ij
= n
j
∑
i∼k,k6=i
n
k
∑
2
L
k=1
n
k
. W
ij
takes into account the
representativeness of the region R
j
in the image and
also as neighbouring region of R
i
. Even though a
more refined definition of the weights could be used,
this choice is simple but enough significant for our
preliminary study.
The initial point of the walk is extracted on the
basis of the stationary distribution of the process, as
described in (Cover and Thomas, 1991). On the con-
trary, the last point of the walk is determined on the
basis of the minimum descritpion length principle
(Grunwald, 2004), as shown in the sequel.
3.3 MDL for Blocks Number
This principle allows the selection of a good model
for approximating the data with the least complex-
ity. It is based on the concept that good compression
means good approximation, in agreement with the
definition of Kolmogorov complexity. Specifically,
the simpler version of MDL, namely crude-MDL, se-
lects a model from a set of candidates M
(1)
, M
(2)
, . . .
by minimizing the following cost
L(M
(k)
) + L(X|M
(k)
) (3)
where L(M
(k)
) is the cost (in terms of bits) required
for coding the model M
(k)
, while L(X|M
(k)
) is the
number of bits required for coding the data X given
the model. In general, the better the model the higher
its cost but the smaller the approximation error. That
is why the selection of the best model is a trade off
between complexity and good approximation. In our
case the model M
(k)
is the fixation path containing
the SSIM value of k points whose average gave an ap-
proximation of SSIM of the whole image. The data X
are correspondingblocks in I and I
d
centered at these-
lected pixels that are involved in SSIM computation.
The cost is measured as entropy per element. More
precisely, by indicating with M
1
, M
2
, M
k
the value of
SSIM computed in the first k points selected dur-
ing the random walk on the graph described above,
and with (b
1
, b
2
, ·· · , b
k
) the blocks used for the eval-
uation of SSIM, we have L(X|M
(k)
) =
H(M
1
,M
2
,M
k
)
k
and L(X|M
(k)
) =
H(b
1
,b
2
,...,b
k
)+2log
2
(k)+1
2w
2
where H is
the entropy, w
2
is the dimension of a block and
2log
2
(k) + 1 is the cost for coding the integer k. By
coding the blocks independently, H(b
1
, b
2
, ·· · , b
k
) =
kH(b
i
), i = 1, 2, . .. , k and by considering a com-
pression ratio 8 : 1, eq. (4) can be rewritten as
K = argmin
k
H(M
1
, M
2
, M
k
)
k
+
k+ 2log
2
(k) + 1
2w
2
(4)
where K gives the length of the optimal path, i.e. the
length of a sequence in the visual distortion typical
set.
3.4 Algorithm
1. Compute the wavelet approximation band A
J
at
J − th level of the image I
2. Apply L levels of the SMQT transform to A
J
and
extract the regions R
1
, R
2
, . . . , R
2
L
3. Compute the cardinality n
1
, n
2
, . . ., n
2
L
of the seg-
mented regions and evaluate the weights of the
graph as in eq. (2)
4. Extract a point from a region R
1
according to the
stationary distribution of the graph as defined eq.
(2)
5. Compute M
1
, i.e. SSIM on a block of dimension
w× w centered at the selected point and set k = 2
6. Extract a point in the region R
j
selected according
to the probability P
i, j
defined in eq. (1)
An Entropy-based Model for a Fast Computation of SSIM
229

7. Compute M
k
, i.e. SSIM on a block of dimension
w× w centered at the selected point
8. Evaluate the argument of eq. (4) and assign its
value to the variable L
k
9. If L
k
> L
k−1
, set K = k − 1 and
ˆ
M =
∑
K
k=1
M
k
K
and
stop; otherwise set k = k+ 1 and go to step 6.
ˆ
M is the approximation for SSIM given by the model,
while K is the number of blocks used for getting it.
3.5 Model’s Complexity
By denoting with C
log
the cost for the calculation of
the logarithm of a number, with N the image size and
with |χ| the cardinality of the alphabet of SSIM, it is
possible to prove that the proposed algorithm requires
7
3
1−
1
2
2J
+ 2L+ 1
N − 2
L
− L+ 1+ 2
2L
)+
+
8w
2
+ 30+
3
2
C
log
+ log
2
|χ|
K + (4 + C
log
)
K
2
2
operations, i.e. multiplications, algebraic sums, di-
visions and comparisons, while the computation of
SSIM using all image pixels requires
(8w
2
+ 18)N
operations. Hence, by comparing the number of op-
erations given above, it is possible to determine the
maximum value for K, which gives a gain in the com-
putation of SSIM. This value depends on the parame-
ters of the proposed method and the image size.
4 EXPERIMENTAL RESULTS
The proposed method has been tested on several im-
ages affected by different distortion kinds and levels.
In this paper we will give some results obtained from
natural images extracted from TID2013 database
(Ponomarenko et al., 2015) affected by global distor-
tions like additive and multiplicative gaussian noise,
high freuency noise, gaussian blurring, jpeg and jpeg
2000 compression, mean shift and contrast change.
For each distortion, four levels have been considered.
In all tests the following parameters have been used.
The level J of the wavelet transform has been set
equal to 3 and a Daubechies with 2 vanishing mo-
ments has been adopted; the levels L of the SMQT
have been fixed to 3 in order to have 8 regions; the di-
mension of the blocks for SSIM computationof SSIM
has been fixed to 17× 17, since it corresponds to a vi-
sual angle equal to 0.56 degrees (Monte et al., 2005)
— however smaller dimensions provide similar re-
sults; the cardinality of the alphabet for SSIM has
been set equal to 200, that corresponds to a quanti-
zation step equal to 0.01. Table 1 provides the results
achieved on 512 × 384 Ocean image (image I16 in
TID2013). It is worth outlining that each run of the
proposed algorithm provides a different sequence in
the visual distortion typical set of the image. That is
why the average value of SSIM estimations obtained
by 30 runs of the algorithm has been given in Table 1.
The same table includes the standard deviation of the
estimation as well as the average number of blocks
used for computing it and the corresponding standard
deviation. As it can be observed, the estimation error
increases as the distortion level increases but it does
not overexceed 8% and the standard deviation is quite
small. For some distortion kinds, like gaussian noise
and gaussian blur this percentage is less than 5% and
for distortions like mean shift and contrast change it
is does not overexceed 1.2%. The average number
of blocks is less than 50, it means that the number
of operations required for the computation of SSIM
of Ocean image is reduced of about 200 times. It
is worth outilining that similar results have been ob-
tained for the other images in the database; for some
of them the average number of blocks is smaller than
50, while the average estimation error is still less than
8%. It is also worth stressing that the proposed proce-
dure does not involve an exhaustive search of points
of interest, as required by the contrast-based proce-
dure in (Raj et al., 2005).
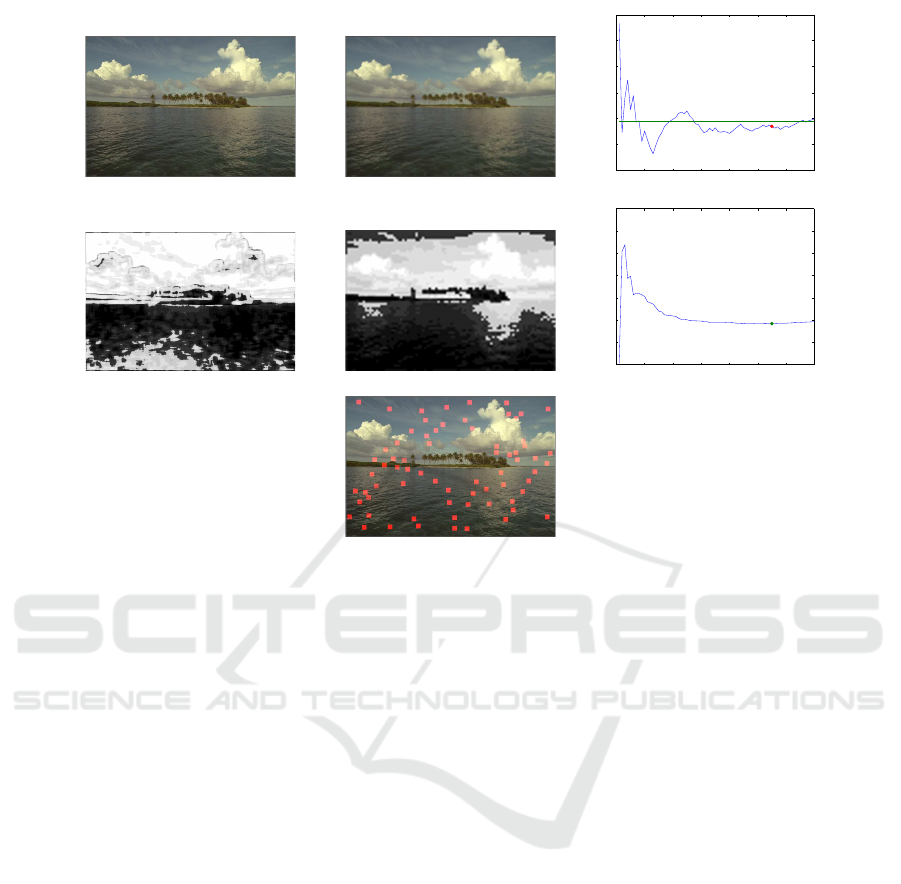
Figure 2 shows the segmentation used for Ocean
image. As it can be observed, the segmentation is not
far from the one given by the SSIM map except for
the edges. It is due to the fact that the criterion used
for the segmentation is based just on the luminance
and then a region based segmentation has been em-
ployed. Nonethless, the optimal point selected by the
MDL principle on the entropy curve corresponds to a
good value of SSIM, providing acceptable estimation
errors. The same figure shows the blocks belonging
to the selected fixation path. As it can be observed,
more blocks are selected in regions where blurring is
more visible.
5 CONCLUSIONS AND FUTURE
RESEARCH
This paper has presented a method for the estima-
tion of the Strucutral SIMilarity index from a reduced
number of suitably selected image pixels. It mod-
els the observation process in the preattentive phase
as a random walk on a graph whose nodes are im-
VISAPP 2016 - International Conference on Computer Vision Theory and Applications
230

Table 1: Ocean image; I16 in TID2013 database. SSIM (
¯
M), estimated SSIM (
ˆ
M) using the proposed method, mean value of
the estimation error (%) over 30 runs (ε), standard deviation of the estimation error (σ
ε
), mean value of the number of blocks
used (
¯
K), standard deviation of the number of blocks (σ
K
).
distortion level
¯
M
ˆ
M
ε σ
ε
¯
K
σ
K
high 2 0.8661 0.8672 1.1222 0.0113 48.00 2.92
frequency 3 0.7034 0.7086 2.6788 0.0237 48.87 4.54
noise 4 0.4829 0.4842 4.9297 0.0275 48.70 3.51
5 0.2722 0.2627 8.9767 0.0284 47.80 4.43
2 0.8673 0.8728 1.4447 0.0132 45.67 3.87
Gaussian 3 0.7781 0.7821 2.1462 0.0217 48.50 4.55
noise 4 0.6614 0.6607 3.4739 0.0308 48.87 3.50
5 0.5276 0.5272 4.3112 0.0260 49.30 3.37
2 0.9513 0.9542 0.6528 0.0069 37.37 6.15
Gaussian 3 0.8805 0.8828 1.4811 0.0159 44.47 5.10
blur 4 0.7925 0.8045 2.9532 0.0260 46.00 6.59
5 0.7012 0.7128 4.1474 0.0346 48.40 4.67
2 0.9451 0.9448 0.5260 0.0061 41.87 5.17
JPEG 3 0.8891 0.8895 0.8761 0.0097 47.33 3.94
compression 4 0.7578 0.7518 2.1654 0.0198 48.33 3.56
5 0.6320 0.6257 4.1073 0.0311 49.37 4.10
2 0.8516 0.8553 1.9288 0.0183 46.73 3.59
JPEG2K 3 0.6942 0.6939 4.0191 0.0326 49.43 4.35
compression 4 0.5394 0.5529 6.4984 0.0395 47.73 3.55
5 0.4799 0.4827 7.6406 0.0426 49.53 2.83
2 0.9951 0.9950 0.1259 0.0015 21.00 5.52
Mean 3 0.9778 0.9779 0.2198 0.0028 34.37 6.13
shift 4 0.9620 0.9644 0.5506 0.0059 31.27 7.36
5 0.8929 0.8930 1.0167 0.0111 45.53 4.57
2 0.9829 0.9832 0.3674 0.0042 29.23 5.70
Contrast 3 0.9713 0.9711 0.1596 0.0019 33.53 5.51
change 4 0.9349 0.9392 0.8867 0.0086 40.20 5.70
5 0.8726 0.8749 0.7490 0.0081 44.60 3.28
Multiplicative 2 0.8594 0.8697 2.3503 0.0220 45.80 5.25
gaussian 3 0.7730 0.7851 3.3095 0.0286 47.40 4.33
noise 4 0.6615 0.6627 4.0346 0.0327 48.60 3.75
5 0.5376 0.5346 5.0814 0.0322 50.77 3.18
age regions having distinct visual characteristics and
whose edges are weighted accounting for the repre-
sentativeness of the region in the whole image and
also in the neighborhood of proximal regions. The
length of the sequence is automatically determined
for each image by means of the minimum description
length that selects the number of blocks able to guar-
antee a good tradeoff between good estimation er-
ror and reduced computational complexity. The pro-
posed method makes some assumptions on the class
of analysed images (natural images) and distortion
kind (global distortion); in addition, it uses some sim-
ple criteria and fixed parameters in the segmentation
step. Nonetheless, even though in its simpler form,
the results are satisfying and promising. Very few
blocks provide SSIM estimation with errors less than
8%; this worst case is reached in very particular cases.
Future research will be devoted to the use of more re-
fined criteria in the segmentation process and to make
adaptive and automatic the choice of the parameters
involved in the segmentation step (resolution of the
wavelet transform, number of regions of image parti-
tion). Furthermore, some dependency on region con-
tent will be introduced in the definition of the edge
weights of the graph that is used for defining the fixa-
tion path. In fact, such an approach may also allow: i)
to improve the design of existing QA measures, ii) to
design novel and possibly more precise QA measure,
iii) to build novelHVS based regularization functions,
iv) to add some novel elements to Visual Information
Theory with possible effects on the definition of new
visive image coding schemes.
An Entropy-based Model for a Fast Computation of SSIM
231
0 10 20 30 40 50 60 70
0.7
0.75
0.8
0.85
0.9
0.95
1
SSIM
0 10 20 30 40 50 60 70
0
0.1
0.2
0.3
0.4
0.5
0.6
0.7
MDL
Figure 2: First row Original Ocean image (left); Blurred image (middle); SSIM value estimated for an increasing number
of blocks (the optimal point has been marked) (right). Second row SSIM map (left); Segmentation provided by the SMQT
(middle); entropy per sample used in the MDL based procedure — the optimal point has been marked (right). Last row
selected image blocks.
ACKNOWLEDGEMENTS
The Authors would like to thank Simone Guarracino
for the development of part of the Matlab code of the
proposed method.
REFERENCES
Benabdelkader, S. and Boulemden, M. (2005). Recursive
algorithm based on fuzzy 2-partition entropy for 2-
level image thresholding. In Pattern Recognition. El-
sevier.
Bruni, V., Crawford, A., Kokaram, A., and Vitulano, D.
(2013a). Semi-transparent blotches removal from
sepia images exploiting visibility laws. In Signal Im-
age and Video Processing, 7(1), 11-26.
Bruni, V., Rossi, E., and Vitulano, D. (2012). On the equiva-
lence between jensen shannon divergence and michel-
son contrast. In IEEE Trans. on IInformation Theory,
Vol. 58, No. 7. IEEE.
Bruni, V., Rossi, E., and Vitulano, D. (2013b). Jensen-
shannon divergence for visual quality assessment. In
Signal Image and Video Processing, Vol. 7, No. 3.
Springer.
Bruni, V. and Vitulano, D. (2014). A fast computation
method for iqa metrics based on their typical set. In
Proc. of ICPRAM 2014.
Bruni, V., Vitulano, D., and Ramponi, G. (2011). Image
quality assessment through a subset of the image data.
In Proc. of ISPA 2011. IEEE.
Cover, T. M. and Thomas, J. A. (1991). Elements of Infor-
mation Theory. John Wiley sons.
Ferzli, R. and Karam, L. J. (2009). A no-reference objective
image sharpness metric based on the notion of just no-
ticeable blur (jnb). In IEEE Trans. Image Processing,
Vol. 18, No. 4. IEEE.
Frazor, R. and Geisler, W. (2006). Local luminance and
contrast in natural in natural images, 46. In Vision
Research.
Grunwald, P. D. (2004). A tutorial introduction to the min-
imum description length principle. In Advances in
Minimum Description Length: Theory and Applica-
tions. Myung Grunwald, Pitt.
Hontsch, I. and Karam, L. (2002). Adaptive image coding
with perceptual distortion control. In IEEE Trans. on
Image Processing. IEEE.
Hou, Z. and Yau, W. (2010). Visible entropy: A measure
for image visibility. In Proc. of ICPR.
Jourlin, M. and Pinoli, J. C. (1998). A model for logarithmic
image processing. In J. Microsc., Vol. 149.
Lee, H. and Lee, S. (2006). Visual entropy gain for wavelet
image coding. In IEEE Sig. Proc. Letters. IEEE.
VISAPP 2016 - International Conference on Computer Vision Theory and Applications
232

Mallat, S. (1998). A wavelet tour of signal processing. Aca-
demic Press.
Monte, V., Frazor, R., Bonin, V., Geisler, W., and Corandin,
M. (2005). Independence of luminance and contrast
in natural scenes and in the early visual system 8(12).
In Nature Neuroscience.
Moorthy, A. and Bovik, A. (2009). Visual importance pool-
ing for image quality assessment. In IEEE Journal on
Special Topics in Sig. Proc., 3(2).
Nilsson, M., Dahl, M., and Claesson, I. (2005). The suc-
cessive mean quantization transform. In Proc. of
ICASSP05.
Panetta, K. A., Wharton, E. J., and Agaian, S. S. (2008).
Human visual system-based image enhancement and
logarithmic contrast measure. In IEEE Transaction on
Systems, Man, and Cybernetics-Part B, Vol. 38, No. 1.
IEEE.
Park, J., Sshadrinathan, K., Lee, S., and Bovik, A. C.
(2011). Spatio-temporal quality pooling accounting
for transients severe impairments and egomotion. In
Proc. of ICIP 2011. IEEE.
Ponomarenko, N., Jin, L., Ieremeiev, O., Lukin, V., Egiazar-
ian, K., Astola, J., Vozel, B., Chehdi, K., Carli, M.,
Battisti, F., and Kuo, C. J. (2015). Image database
tid2013. In Image Communication, Vol. 30. Elsevier
Science Inc.
Raj, R., Geisler, W., Frazor, R., and Bovik, A. (2005). Con-
trast statistics for foveated visual systems: fixation se-
lection by minimizing contrast entropy. In J Opt Soc
Am A, Vol. 20, No. 10. Opt Image Sci Vis.
Sheikh, H. R., Bovik, A. C., and Veciana, G. D. (2005). An
information fidelity criterion for image quality assess-
ment using natural scene statistics. In IEEE Trans. on
Image Proc., Vol. 14, No. 12. IEEE.
Wang, W., Wang, Y., Huang, Q., and Gao, W. (2010). Mea-
suring visual saliency by site entropy rate. In Proc. of
GVPR 2010. IEEE.
Wang, Z., Bovik, A. C., Sheikh, H. R., and Simoncelli, E. P.
(2004). Image quality assessment: From error visibil-
ity to structural similarity. In IEEE Trans. on Image
Proc., Vol. 13, No. 4. IEEE.
Wang, Z. and E.P.Simoncelli (2005). Reduced-reference
image quality assessment using a wavelet-domain nat-
ural image statistic model. In Proc. of SPIE Human
Vision and Electronic Imaging X, vol. 5666. SPIE.
Wang, Z. and Li, Q. (2011). Information content weight-
ing for perceptual image quality assessment. In IEEE
Trans. on Image Proc., Vol. 20, No. 5. IEEE.
An Entropy-based Model for a Fast Computation of SSIM
233
