
Assessing 3D Geovisualization for the Communication of Public Art
Vincenzo Lombardo and Rossana Damiano
CIRMA and Dipartimento di Informatica, Universit
`
a di Torino, corso Svizzera 185, Torino, Italy
Keywords:
Contemporary Public Art, 3D, Geovisualization.
Abstract:
This paper presents the assessment of a 3D geovisualization framework and system for the documentation and
communication of contemporary public art. The paper reviews the specific requirements of the contemporary
public art and discusses the critical issues connected to the visualization of such artworks. The framework
implements a visualization pipeline that relies on both a semantic representation of the artworks and a mixture
of graphic elements acquired from reality or designed for the application. The web-based visualization system
realizes a geolocalized 3D layout that selects the relevant traits that characterize the contemporary public
artworks. The system is implemented in a prototype applied to the visualization of contemporary public
artworks of the municipality of Turin (Italy). The assessment is achieved through the evaluation of a number
of typical tasks that general audiences engage with contemporary public art, the system has revealed to be
more adequate to its design goals.
1 INTRODUCTION
In the last decades, contemporary public art has been
a very dynamic area, involving both public and private
subjects and originating a novel professional artist
category. Public art is peculiarly planned for and
staged in some specific public space, usually open air
or in publicly accessible buildings, for all people to
enjoy it (Miles, 1997). Contemporary art in general
lacks, on the one hand, an effective documentation for
the institutions (documentation needed for purposes
of maintenance and re-installation), and, on the other,
an effective communication to large audiences (com-
munication needed because of its peculiar, sometimes
obscure languages). We claim that the 3D geovisu-
alization can effectively support these documentation
and communication task for contemporary public art.
The usage of contextualized 3D graphics repre-
sentation is not new in contemporary public art en-
terprise, especially in the design phase. The pre-
visualization of projects (see, e.g., the reStacked
project)
1
usually employs a 3D model that highlights
the major features of the artwork to provide a quick
overlook on its size, the materials employed, the per-
spectives from a number of relevant points of view,
entrances/exit positioning, etc.. Also, 4D CAD tech-
nology (i.e. 3D plus time as fourth dimension on
1
http://www.njstudio.co.kr/main/project/2013 reSTAC
Ked [Competition]/2013 reSTACKed [Competition].html
CAD software) is employed by designers and engi-
neers to analyze and visualize construction projects
in order to plan construction operations (Mahalingam
et al., 2010). 3D graphics is also particularly appro-
priate for the case of reconstructions of cultural her-
itage items from the past such as in the case of the
Po
`
eme
´
electronique a multimedia installation that was
hosted inside the Philips Pavilion at the 1958 Brussels
World Fair, and never repeated because the pavilion
was turned down at the end of the fair (VEP project
(Lombardo et al., 2006)).
Public art also makes the case for geographic vi-
sualization (geovisualization for short), thanks to its
close relationship with the urban setting. Geovisual-
ization enriches that traditional static maps with the
exploratory capabilities of the interactive maps, in-
cluding several layer representation, zooming in/out,
the possibility of changing the visual appearance
(MacEachren and Kraak, 2001). For the visualization
purposes, the representations of urban maps lately re-
quire a third dimension, which is necessary to rep-
resent the height of the new buildings (of increasing
importance), and the visible and invisible phenom-
ena that happen at several meters above and under
the ground and can be represented using the surfaces
of the buildings as a support (Donolo, 2014). Many
large cities today exist in 3D geolocalized copies,
though in general applications tend to focus on vi-
sual interpretations of statistical data as well as data
314
Lombardo, V. and Damiano, R.
Assessing 3D Geovisualization for the Communication of Public Art.
DOI: 10.5220/0005724503120320
In Proceedings of the 11th Joint Conference on Computer Vision, Imaging and Computer Graphics Theory and Applications (VISIGRAPP 2016) - Volume 1: GRAPP, pages 314-322
ISBN: 978-989-758-175-5
Copyright
c
2016 by SCITEPRESS – Science and Technology Publications, Lda. All rights reserved
from the urban infrastructure. Noticeable applica-
tions are “We Are Data”
2
and “OSM Buildings”
3
.
“We Are Data”, developed by UbiSoft on the environ-
ment backbone of the videogame “Watch dogs”, is a
promotional website for the game, which visualizes
the infrastructure data of three European cities (Paris,
London, and Berlin), displaying data about message
exchanging, tweets, public transportation timetable,
on an interactive 3D map that also precisely character-
izes the building heights and the major monuments
4
;
“OSM Buildings” is a library that provides an addi-
tional layer to existing web maps, employed in urban
projects to support the participation of administrators
and citizens in planning processes.
In this paper, we present a 3D geovisualization
framework and a system for the documentation and
communication of contemporary public art. The ma-
jor novelty of the system is a methodology for a 3D
geopositioned system that allows the access to the
documentation of the public artworks and commu-
nicates the attitude of a city towards the contempo-
rary public art. The paper is organized as follows.
The next section introduces the visualization frame-
work, called Invisibilia, and the architecture required
to implement it as a functioning system. The system
features a three–layered visualization structure, with
each visualization layer concerning a different infor-
mation layer. Finally, we evaluate the visualization
system design through an experimental test on a group
of users. The paper ends with some reflections on the
lessons learned and conclusion.
2 VISUALIZATION OF
CONTEMPORARY PUBLIC
ART
The visualization of public art monuments, and espe-
cially in the case of contemporary public art, is ad-
dressed by municipalities with simple methods. In
most case, communication is limited to printed cat-
alogues (mostly distributed through pdf files on web
sites
5
), which report illustrations of the artwork and
a few explanations. Usually, such catalogues are ac-
companied by interactive maps, that report the po-
2
http://www.wearedata.org
3
http://www.osmbuildings.org
4
Philippa Warr, Watch Dogs website maps
your unprotected social data, 27 JUNE 2013,
http://www.wired.co.uk/news/archive/2013-06/27/watch-
dogs-wearedata
5
See, e.g., the Chicago public art guide, http://www.city
ofchicago.org/content/dam/city/depts/dca/Public20Art/
publicartguide1.pdf
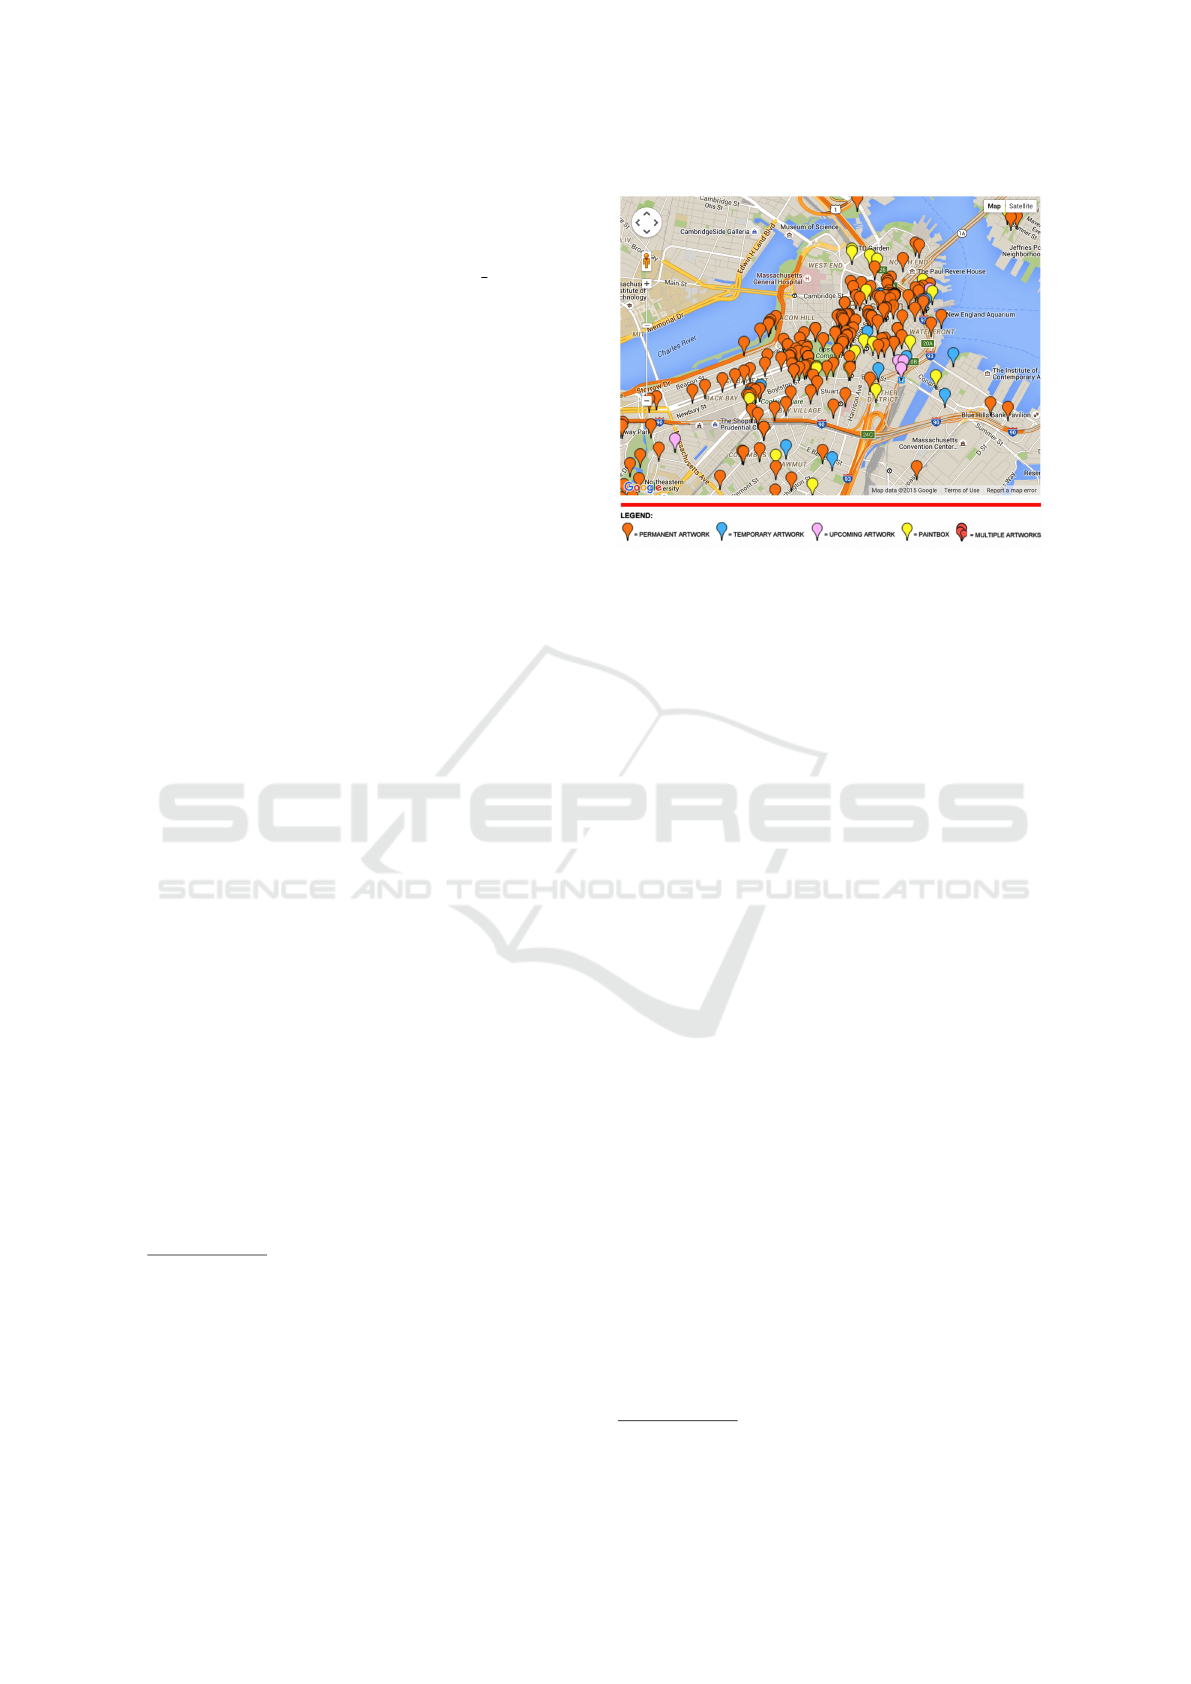
Figure 1: Interactive map of Boston public art
(http://www.publicartboston.com/map/node). A
similar map is available for public art in Turin
(http://www.comune.torino.it/papum/).
sitions of the artworks with anonymous pins that
provide access to further information, typically the
archival sheet of the municipality or a simplified form
of it (see Figure 1).
However, the documentation, and thus the com-
munication about contemporary public art can be
more knowledgeable. The Invisibilia project
6
has in-
vestigated how the digital technologies can support
the documentation of the “invisible” issues concern-
ing contemporary art (including installations, perfor-
mances, and site-specific situations), that are always
at risk of vanishing. The name Invisibilia refers to the
notion of the “intangible” cultural heritage promoted
by UNESCO, and emphasizes the fact that in contem-
porary art the relationship between the aesthetic ap-
preciation of the single “work” goes beyond its mate-
rial visibility (Lughi, 2014). The artistic and aesthetic
experiences connected and enhanced by digital me-
dia are the foundations for the reflexivity, a prereq-
uisite to understanding the new logics of cultural pro-
duction and consumption and the new forms of active
citizenship that are taking shape in the contemporary
landscape.
The project Invisibilia has investigated and de-
veloped a number of proposals to develop the study,
maintenance, reuse and profitability of these partic-
ular heritage. In particular, for the case of contem-
porary public art, the project has addressed the issue
of representing the layout of the artworks at the city
scale and the urban setting of the individual artworks,
together with the access paths (on foot, on a vehicle,
mixed), and the media items that document the indi-
6
http://www.invisibilia.unito.it
Assessing 3D Geovisualization for the Communication of Public Art
315

Example:)Merz’s)FRBR)
Figure 2: Merz’s igloo fountain in Turin: design, construction, final.
vidual artworks. The approach has been to encode
the intangible aspects of contemporary art into a rich
digital semantic representation and exploit such a rep-
resentation for several tasks. In this paper, we address
the visualization framework, which exploits the spa-
tial and urban components of the semantic knowledge
(Lieto et al., 2014).
The case studies of project Invisibilia are four
public artworks of the city of Turin: Merz’s igloo–
fountain “Fontana” (Fountain), Clegg’s “Punti di
vista” (Points of view), Kirkeby’s “Opera per Torino”
(Opus for Torino), and Levi/Cliostraat’s “Baci urbani
– Piercing” (Urban kisses – Piercing). The specific
descriptions in this paper are exemplified through
the artwork “Fontana” (Fountain) by the artist Mario
Merz (see Figure 2). Released in 2002, it has the
shape of an igloo with the surface consisting of a puz-
zle of plates of slate, emerging from a rectangular wa-
ter tab, with water jets, located in a road widening;
four red neon lights, that light up at evening, mark the
cardinal points. Specifically conceived for the setting
where it is located, this artwork intends to trigger in
the audience a reflection on the meaning of urbaniza-
tion though a basic, yet well construed type of house,
the igloo.
2.1 The Invisibilia Visualization
Framework and System
The visualization framework of Invisibilia (Figure
3) integrates knowledge about the artworks with the
graphic elements representing them and the media
documentation about them. We devised a three-
layered system to visualize the contemporary public
art. The Layer 1 provides a synoptic view of the con-
temporary public artworks in the city: we build the vi-
sualization on a thematic base map, providing a geo-
referenced distribution of the artworks (represented
as 3D graphic elements) that exploits the knowledge
(the GPS data) imported from the public data bases
and additional knowledge from the artwork data sheet
(height, diameter, etc.). The Layer 2 provides the
view of the individual artwork through a graphic rep-
resentation of the artwork itself in relation with the
urban proximity; this representation, which includes
the modalities through which the visitors access the
artwork, exploits the knowledge about the artwork (its
function, its components, etc.), and the knowledge
about spatial layout of the urban area; while the art-
work is a unique 3D model, the neighboring elements
are serial iconic elements that are exploited through-
out the artwork visualizations. The Layer 3 is the doc-
umentation view, staged as an image gallery, each im-
age representing some media concerning the artwork.
The user directly accesses Layer 1 from the home
page: here she/he is presented with the overall lay-
out of public artworks across the city and explores the
3D map through automatic scene rotation and manual
zooming in/out; the graphic elements corresponding
to the contemporary public artworks are highlighted.
Once she/he clicks on some artwork, she/he enters
Layer 2, where she/he can explore the specific urban
setting of the artwork, switching day/night views and
activating the animations showing the visiting paths
allowed for the artwork (on foot, by car or mixed).
Finally, by clicking on the body of the artwork, the
user accesses Layer 3, where she/he can view the me-
dia repository about the artwork.
The implementation of such a visualization frame-
work is a standard semantic architecture (Figure 4, cf.
(Damiano et al., 2014)): the ontology framework, im-
plemented in the Stanbol framework
7
, maintains the
ontological knowledge base (the formal descriptions
of the artworks), about the public art, which describes
the artworks, their documentation and their spatial
properties, including their relationship with the ur-
ban context that surround them; the visual renderer,
developed in two versions (one based on the three.js
library, with spatial data encoded in a json data file,
another based on GoogleEarth, which requires a kmz
file), displays the visual data, namely, 1) the 3D mod-
els associated with artworks and urban elements sur-
rouding them in the visual scene, 2) the Maps down-
loaded from some repository and employed through
the Leaflet libraries, 3) the GeoJSON data extracted
from the Geoportal of the city and augmented with
7
https://stanbol.apache.org
GRAPP 2016 - International Conference on Computer Graphics Theory and Applications
316
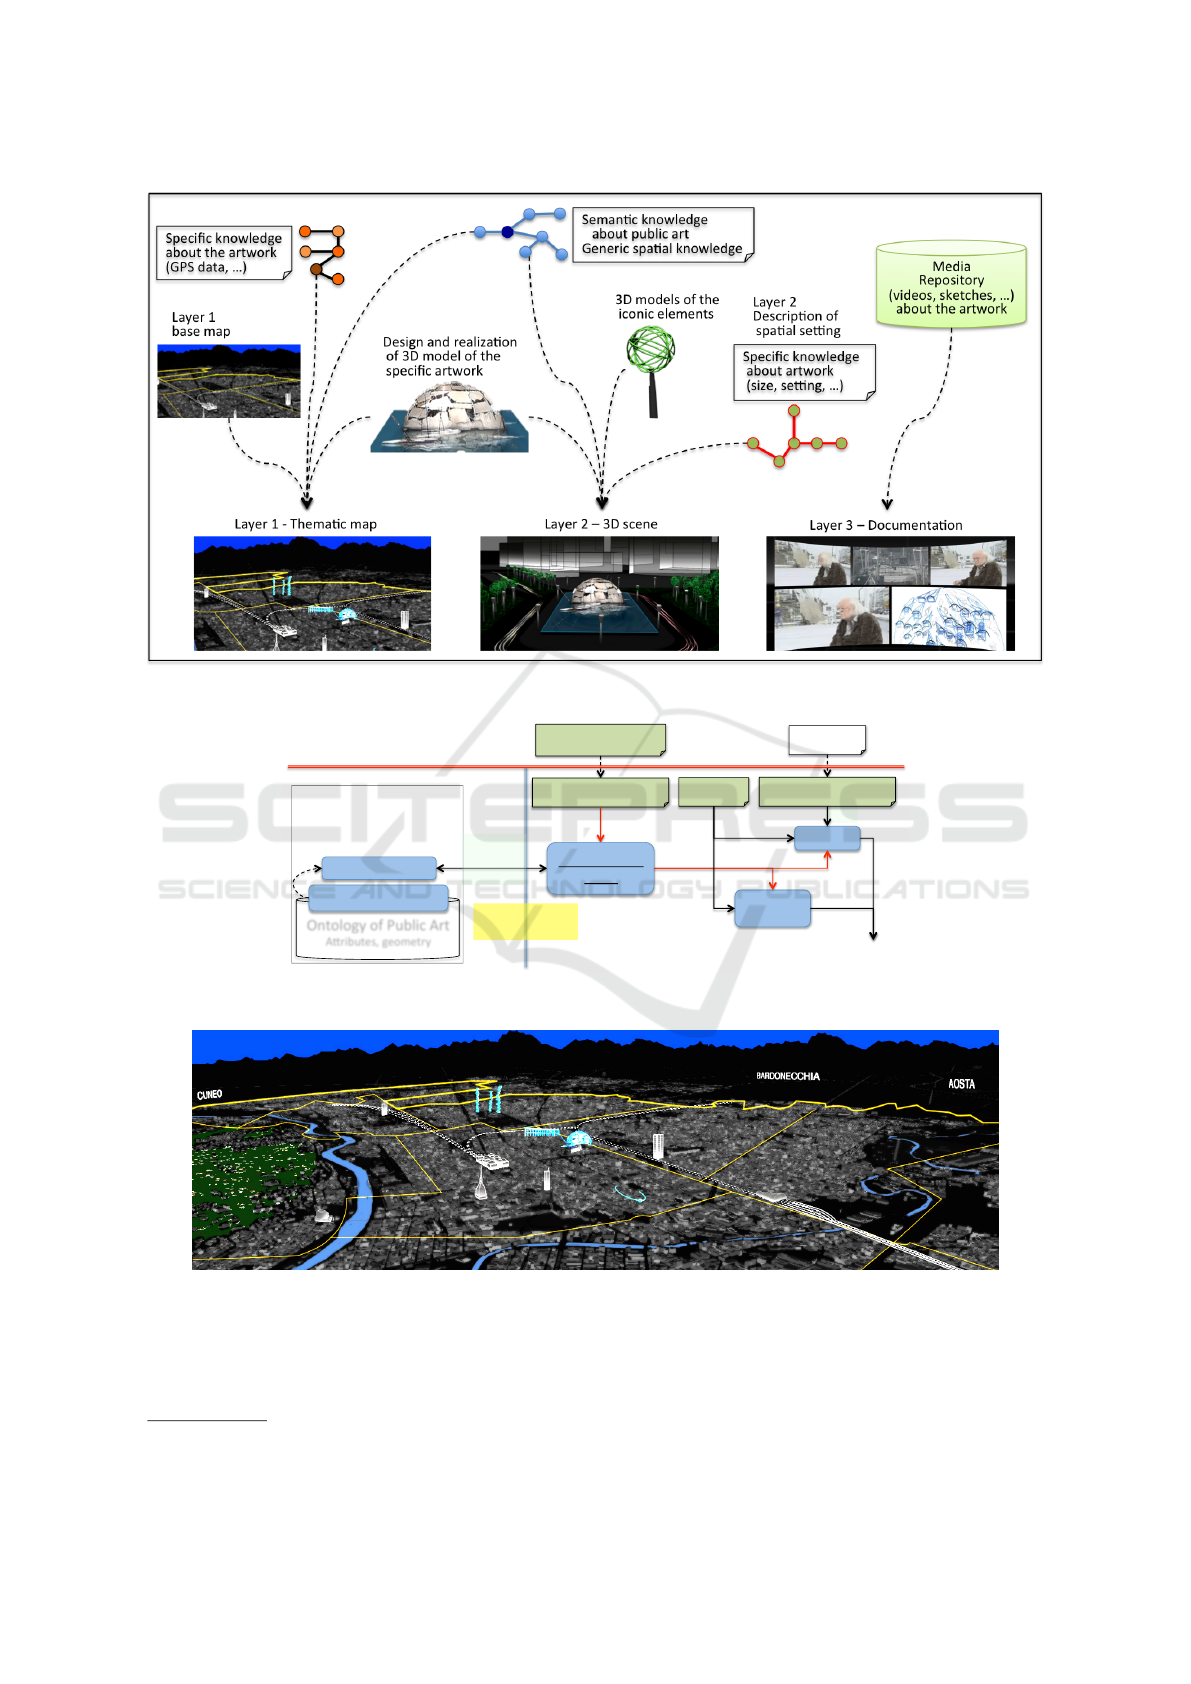
Figure 3: The visualization framework of Invisibilia.
!"#$%&'((
)*+),)-.(/01234)05(
(
(
(
(
(
(
(
(
60)+)+.73()/(1089:+38+;03((
<=:23>:>(>;?2:@3AB(
Browser'
C3)D!&$(
<C3)7)0+1,(8:+.(";0:*B(
+9033D!((
=17>(
C3)D!&$E(
F-3)23+0.(F1@0:?;+3>(
GH(2)A3,>(
I>)*(
&*+),)-.(J;30.(#6K(
&*+),)-.()/(6;?,:8(#0+(
#@0:?;+3>L(-3)23+0.(
#6K("0:7,3(>+)03(
Ajax'
Communica2on'
GH(A1+1((
MN+018O)*(
PHQRS='(
&*+),)-.RTRGH(
17:(UI>(
Server' Client'
External'resources'
C))-,3(
M10+9(
52,(
A13(
7*-(
=17>E(
F01>+30:V3A(F03/303*83A(
Figure 4: Prototype architecture of visualization framework.
Figure 5: Top level view. Design in Blender, visualized in three.js.
information on geometry and other attributes.
8
The user interface dynamically arranges the set of
graphic items (artwork and contextual items), stag-
8
http://www.comune.torino.it/geoportale/
ing and setting them based on their spatial and vi-
sual properties, as extracted from the semantic knowl-
edge. The presentation metaphor, provided by the
“city map”, drives the visual experience through: an
environment, the base city thematic map, where the
Assessing 3D Geovisualization for the Communication of Public Art
317
graphic elements are located; the active elements, the
public art models, that can be clicked by the user; the
contextual elements, i.e. the serial objects that are
positioned in the environment. The interaction de-
sign is inspired by the notion of guided exploration,
with iconic elements and controls inviting the user to
click on the artworks posited in the urban landscape
(in Layer 1), and on the most significant parts of the
artwork (in Layer 2).
The design of the graphic elements and of the
scene layout must reconcile the tasks of supporting
the user in visualizing the invisible aspects of the art-
works with the communication issues related with the
documentation of the artworks. The public artworks
come with a marked visual stance, which makes a vi-
sualization of the artwork documentation more chal-
lenging. We can sum up the following premises about
the visualization: it cannot be a replacement for the
original artwork, though exhibited in virtual terms; it
has to balance between the goals of the visualization
and the peculiarities of the artwork; it must adhere to
the model (of the features) of the artwork; the autho-
rial intervention should be limited to the documenta-
tion section. The visual components that represent the
characteristics of the artworks are derived from the
existing documentation and are augmented with the
serial iconic elements, appropriately designed by the
visualization artist. These elements must be in overt
contrast with the original elements, though creating
an environment that can visually host the original ele-
ments. The idea is to acquire from reality the graphic
elements of the artworks, to design from scratch the
simple iconic elements, and finally to integrate them
into a single visual framework.
The synoptic view of Layer 1 provides a top-view
cartographic representation of the public artworks on
a city map, with their relative positions; the public
artworks are represented by visual items that display
the actual shape of the artwork; these items can be
original (if they exist in the documentation) or intro-
duced ex-novo. The inspiration for such solution is
the tourist city map, that combine topological and to-
pographical elements
9
: in our case, we decided to em-
ploy Geoportal data from the Geographical web portal
of the Municipality of Turin. In order to recall sight-
seeing heritage–oriented thematic maps, which have
a longstanding tradition in cartography and are effec-
tive in guiding tourists in picking the preferred sites
in a city, we applied the Geoportal data some graphi-
cal transformations, by enlarging and highlighting the
elements of interest for our domain, without any al-
teration on the geometry of other elements, Also, we
9
http://www.torino.city-sightseeing.it/eng/percorsi
1.htm
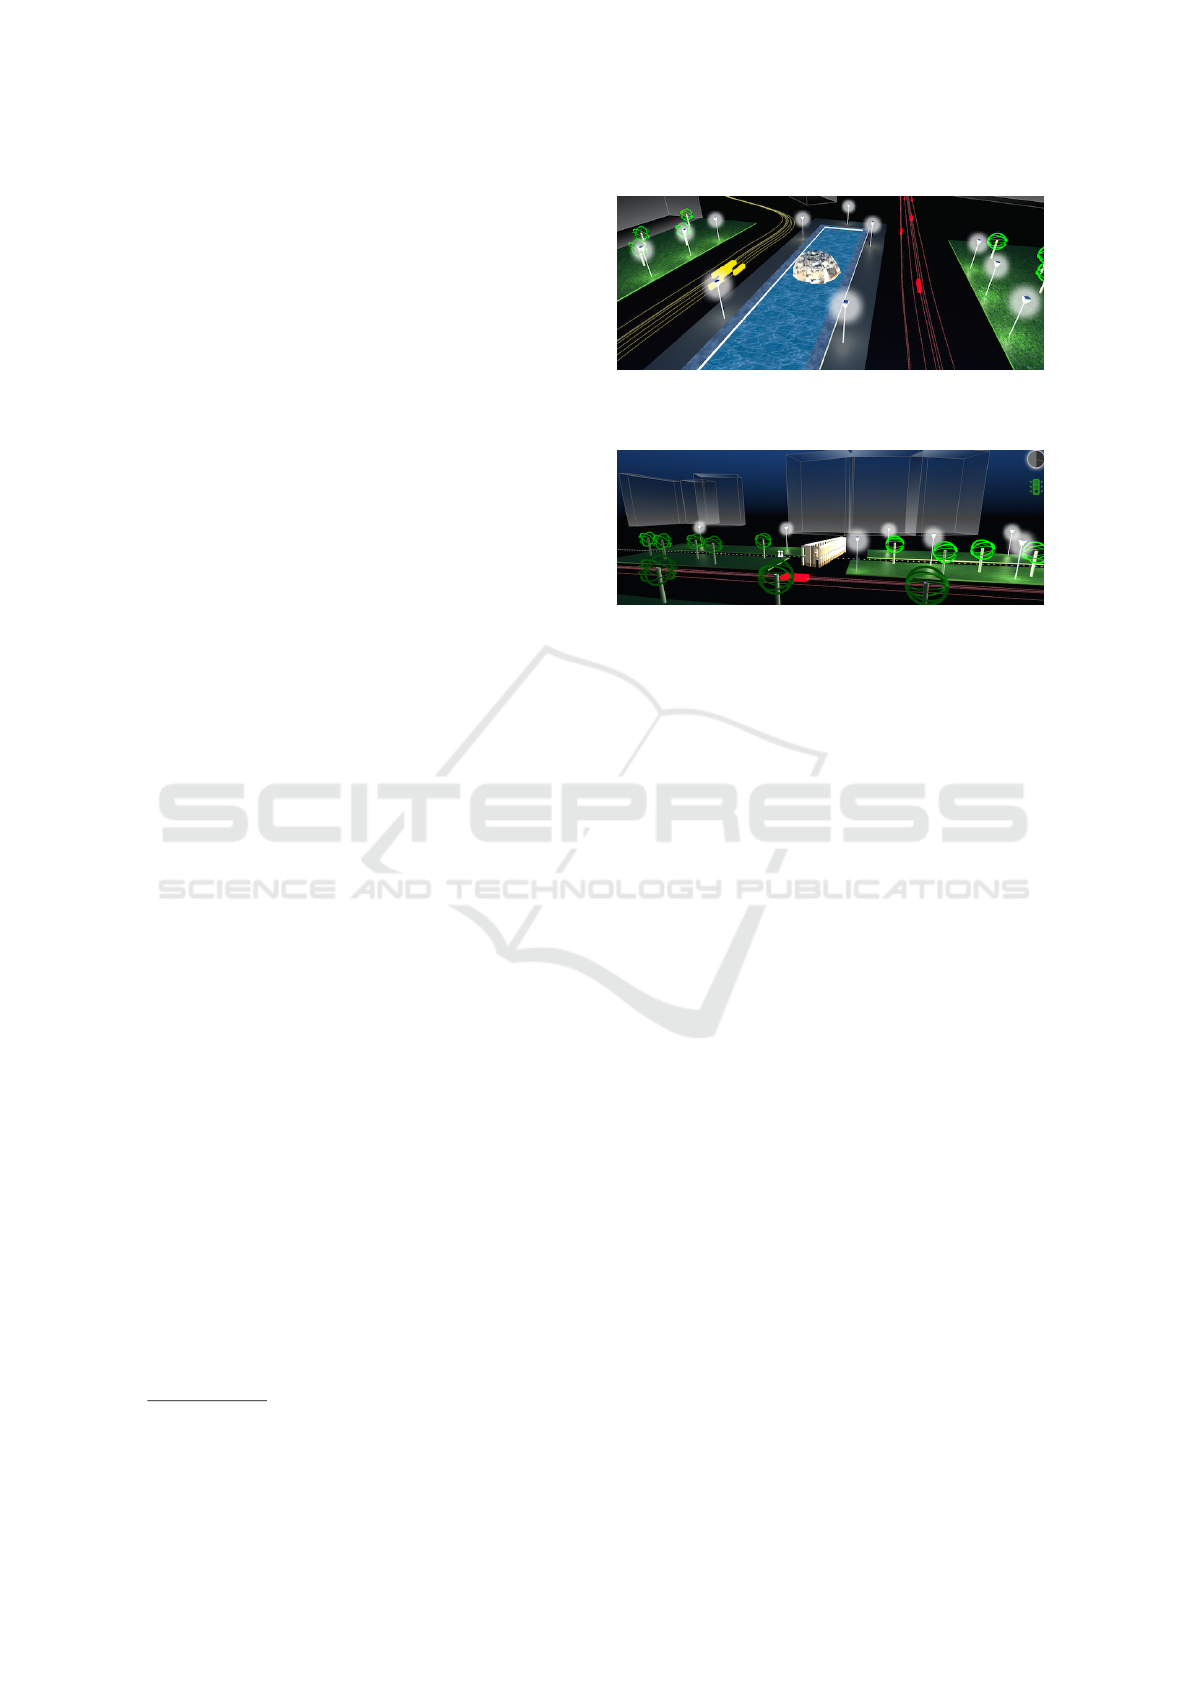
Figure 6: Invisibilia artwork level view: implementation of
Merz’s Fountain in three.js library.
Figure 7: Invisibilia artwork level view: implementation of
Kirkeby’s “Opera per Torino” in three.js library.
augmented the thematic map with a 3D perspective,
positioning the 3D models of the elements of inter-
est. The base thematic map of the synoptic view (see
Figure 5), includes topographic elements, such as the
rivers (in blue), the major access as well as inner roads
(in yellow and white), and the major reference build-
ings (in light grey) in order to provide orientation
cues. The topological elements, one per public art-
work, are colored in a light blue glow to give a sense
of presence against a dark background. The imple-
mentation shown in the figure has been carried out
with the three.js library, with maps from public repos-
itory imported through the Leaflet
˙
js library (actually,
in the current implementation, personalized maps are
rasterized to cover a plan with an exact match of the
references, given the relocation from the central point
through a simple javascript function).
The individual artwork view of the Layer 2 is
a perspective view that is reached through a 3D-
simulated camera motion: this view remains in the
graphic style described above, with superimposed ac-
tive icons for accessing the visualization of the me-
dia documentation. In Figure 6 we can see the art-
work, with contextual elements represented as styl-
ized icons, replicated over the several artwork visual-
izations (cf. Figure 7).
The object representing the artworks are 3D mod-
els with photographic texturing, obtained by means of
photogrammetric techniques. The input data are sets
of digital images, acquired through a compact digital
camera, which have been processed through the soft-
ware Photoscan (see Figure 8). This approach, which
can be carried out by a non 3D professional, such as
GRAPP 2016 - International Conference on Computer Graphics Theory and Applications
318

the personnel of the city hall offices, makes the project
sustainable from the operational point of view; as in-
tended in the design phase, then, the visual appear-
ance makes the object different from the iconic style
adopted for the other elements.
The documentation about the artwork (Layer 3)
can be accessed from the Layer 2 and it includes doc-
uments of various type, such as video clips, text doc-
uments, pictures, etc., (cf. images in Figure 2) which
illustrate all the phases of the artistic creation, from
conception to realization. In the next section, we pro-
vide an assessment of the visualization methodology
for the layers 1 and 2, which are novel for the case of
public art. The assessment will provide useful indi-
cations for the implementability of the methodology
beyond the prototype level.
3 EVALUATION
Based on the paradigm of the user studies, we con-
ducted a test to assess the effectiveness of the pro-
posed visualization of contemporary public art.
Design and procedure. The test included a set of
tasks, designed to test the achievement of the follow-
ing objectives:
• on a city scale (Layer 1), enabling the user to un-
derstand the localization of the artworks and their
spatial relations with the reference points of the
city;
• on a local scale (Layer 2), enabling the user to
understand the physical features of each artwork
(e.g., location, size and shape), the values it con-
veys, and its interaction with the urban environ-
ment;
At the end of each task, the user was requested to an-
swer some questions about the task and to express
her/his liking for the specific functionality and the
overall system. The test was conducted on the online
prototype. The users were given a written description
of the tasks and printed questionnaires. As part of the
test methodology, the users were observed during the
execution of the tasks, to collect observations for the
qualitative evaluation of the system (Donolo, 2014).
The test was conducted in September 2015 on 10
users, 6 males and 4 women, with ages spanning from
21 to over 65. All users were acquainted with the city,
since they either lived of studied in Turin. The aver-
age execution time for the testing session was about
20 minutes.
Description and results. The 6 tasks for Layer 1 (city
map) were aimed at assessing the user’s capability
of locating the artworks at the city scale visualiza-
tion and relating them to the relevant geographical
information about the city (reference points, periph-
ery/center, etc.).
1. Detecting a set of geographical and urban refer-
ence points (rivers, main roads, railways, etc.).
The capability of users to orientate themselves on
the map varied significantly depending on the ref-
erence point types: all users were able to detect
the city rivers and the city center, most users were
able to detect the main roads (7 users), but only
few were able to find the north (4 users) direction
on the map.
2. Detecting the artworks based on their pictures.
The users were generally able to localize the art-
works. In particular, all users were able to locate
the best known artworks on the map (Piercing and
Fontana), 9 and 8 users were able to locate, re-
spectively, Opera per Torino and Punti di Vista.
3. Detecting a set of cultural institutions (museums
and foundations). All users were able to locate
the Contemporary Art Gallery, while only some
(6 users) were able to locate the less known insti-
tutions.
4. Detecting the main monuments of the city. All
users were able to detect the most famous monu-
ment (Mole Antonelliana) on the map, with high
rates for other monuments as well; some of the
city’s main squares (e.g., Piazza San Carlo) were
not recognized (3 users).
5. Marking the artworks that are to the city center
and those situated on the periphery of the urban
area. The selections made by the users (artworks
in the city center and artworks on the periphery of
the urban area) were all acceptable.
Also, the user was request to express her/his liking of
the rotation functionality in the visualization system
(Q1.1), on 5 point scale (1– disliking, 5 – liking). At
the city level, most users preferred to rotate the scene
manually, an observation that is consistent with the
liking of the automatic rotation (3.6 avg.).
The test on the Layer 2 (artwork scale) was aimed
at assessing the user’s understanding of the features
of the single artworks and included 5 tasks on two
artworks (Fontana Igloo and Opera per Torino).
1. Providing a free description of the artwork.
Fontana Igloo was described as an “igloo situated
in a square water basin” by most users, with some
variations concerning the material, opaque glass
for some (1 user), stone for others (2 users), and
unspecified for most. The shape and the color of
the artwork were correctly perceived by all users.
Assessing 3D Geovisualization for the Communication of Public Art
319

Figure 8: Composition of Merz’s Fountain scans in Photoscan.
All descriptions of Opera per Torino shared the
use of the word “arcades” or its synonyms; the
references to an old industrial building and to a
Roman aqueduct were often present.
2. Assessing the size of the artwork, given an ap-
proximate size scale (small, medium, large, extra
large size). Given this scale, the size of Fontana
Igloo was correctly described by the users as
small-medium and the size of Opera per Torino
was correctly described as medium-large. This
task was accompanied by a question about the
most useful elements for assessing the artwork
size (pedestrians, buildings, roads, green areas,
etc). For Fontana Igloo, the other buildings in
the scene were considered useful by 7 users, while
lampposts by 6 users; only 4 users chose the trees
as a useful element of estimating the size. For
Opera per Torino, streets were chosen by 7 users
and trees by 6, and only 5 users chose the build-
ings. These choices depend on the actual context
were the artworks are locate: while Igloo Fontana
is surrounded by streets and buildings, Opera per
Torino is situated in a green area, farther from
buildings.
3. Activating the day/night visualization function-
ality and assessing whether the appearance of the
artwork changed significantly from day to night
or not. This functionality was quite effective in
conveying the dynamic aspects of the artwork ap-
pearance: 9 users out of 10 correctly perceived
Fontana Igloo different from day to night (the
igloo is lit by night), while only 5 users perceived
Opera per Torino as different by night (actually no
difference, except for the light cast by the lamp-
posts). The user was also asked to assess her/his
liking of this functionality on a 5 point scale. The
average liking of this functionality, however, is
similar for both artworks (3.4 for Fontana Igloo,
3.9 for Opera per Torino).
4. Classifying the localization of the artwork with
respect to the elements of the urban road sys-
tem (roadside, pedestrian area, roundabout, etc.).
Most user correctly classified Fontana Igloo as a
traffic divider (7), and Opera per Torino (8) as lo-
cated in a green area alongside a large road.
5. Activating the visualization of the pedestrian and
vehicular paths across and around the artwork,
and indicating the ways the artwork could be ac-
cessed (by car, on foot, or mixed). Most users
correctly understood that it is not possible to get
near Fontana Igloo on foot (6 users), and the large
majority (9 users) correctly answered that it was
possible to walk across the arcades of Opera per
Torino. The user was also asked to assess her/his
linking of this functionality on a 5 point rank.
This functionality had a positive acceptance (3.7
avg. for Igloo Fontana and 4.3 avg. for Opera per
Torino).
The user was also requested to rate the verisimilitude
of the 3D visualization of the artwork on a 5-point
scale (1 – not at all similar, 5 – very similar). In case
the user was not familiar with the artwork, this ques-
tion was reformulated as the liking of the 3D visual-
ization of the artwork (again on a 5-point scale). The
rating showed a difference between the two visualiza-
tions: 3.0 avg. for “Fontana Igloo” and 3.9 avg. for
“Opera per Torino”.
The final questionnaire concerned the overall lik-
ing of the system (Q1, 5 point scale) the easiness of
the navigation (Q2, 5 point scale), a closed list ques-
tion (Q3) about the web sites she/he would consult to
get the same information (such as Google Street View
or Wikipedia), a question (Q4) about the most similar
media (scale model, promotional videoclip, map and
leaflet). The analysis of the final questionnaire shows
a good acceptance of the system (Q3.1, 4.1 avg.) and
of the 3D navigation (Q4.2, 3.9 avg.). The most sim-
ilar websites chosen by the users were Google Street
View (10 users) and Wikipedia (6 users); the most
similar media were the scale model (6 users), the pro-
GRAPP 2016 - International Conference on Computer Graphics Theory and Applications
320

motional videoclip (5 users), and the map (4 users).
Discussion. To sum up, the evaluation shows that the
visualization system basically attained the goals that
drove the design phase, i.e., conveying the overall lay-
out of the public artworks in the city, their spatial and
artistic values and their relations with the urban sys-
tem. The 3D visualization of the artworks in the city
worked well to locate the artworks and the other ge-
ographical and urban reference points, with the ex-
ception of the cardinal points, not explicitly shown on
the map. The inability of users to localize the cardinal
points provides a clear indication for redesign. As ex-
pected, the familiarity with the artworks and with the
other reference points worked in favor of the users’
ability to locate them on the map, as shown by the
fact that the most frequently recognized entities are
those located in the central area of the city.
At Layer 2, the visualization was effective in de-
scribing both the artworks and the urban context sur-
rounding them, including the paths around and across
the artworks, while the effectiveness of the night/day
visualization can be improved, since it turned out to
be slightly confusing about the dynamic aspects of
the artworks. The analysis of the descriptions of the
artworks provided by the users suggests that the 3D
visualization of the artwork works well to communi-
cate the appearance of the artworks and their values.
However, the quality of the visualization seems to be
relevant for the acceptance, as demonstrated by the
difference between the two artworks: the users pre-
ferred the visualization of Opera per Torino, that is
technically less challenging than Fontana Igloo, due
to the presence of the water and of the stone plates
that form the covering of the igloo. An indication
for redesign is provided by the complaint about the
scarcity of textual information in the visualization.
4 CONCLUSIONS
In this paper, we have described a framework for the
documentation and communication of contemporary
public art via a 3D geovisualization framework. The
paper has analyzed the specific requirements of con-
temporary public art, discussing the critical issues
connected to the visualization of art forms, that should
not be eclipsed by the visualization.
The visualization framework is arranged onto
three levels: a synoptic view, with the spatial layout
of all the artworks at the city level; an artwork view,
with the model of the artwork and standardized icons
for the context model; a documentation view, with a
dashboard of the documents about the artworks. The
framework has been assessed through an implemen-
tation with off-the-shelf technologies and evaluated
against a number of tasks that generic audiences ad-
dress in the case of contemporary public art.
In the next future, we will test the visualization
framework with professionals and users for the popu-
lating pipeline and the efficiency of the web site, re-
spectively. It will also be interesting to address as-
pects related to system immersivity and alternative
interaction methods, that provide access to further in-
formation about the public artworks.
ACKNOWLEDGEMENTS
Part of this research was funded through the Invisi-
bilia Project (2012-2014), supported by Compagnia
di San Paolo, Progetti di ricerca di ateneo (2011), DR
n. 247 28.01.2011. We thank Giulio Lughi, coordina-
tor of the project. We thank Alessandro Olivero and
Nadia Guardini for their implementation of the virtual
environment. We also thank Massimo Morelli, Adri-
ana Ramundo e Valentino Chiarla, of Pensativa s.r.l.,
for their collaboration and support in the implementa-
tion process.
REFERENCES
Damiano, R., Lieto, A., and Lombardo, V. (2014).
Ontology-based visualisation of cultural heritage. In
Eighth International Conference on Complex, Intelli-
gent and Software Intensive Systems, pages 558–563.
IEEE.
Donolo, R. M. (2014). Contributions to Geovisualiza-
tion for Territorial Intelligence. PhD thesis, INSTI-
TUT NATIONAL DES SCIENCES APPLIQUEES
DE LYON and UNIVERSIT
´
A DEGLI STUDI DI
ROMA TOR VERGATA.
Lieto, A., Damiano, R., and Michielon, V. (2014). Concep-
tual models for intangible art. a formal modeling pro-
posal. Mimesis Journal. Scritture della performance,
(3, 2):70–78.
Lombardo, V., Valle, A., Nunnari, F., Giordana, F., and
Arghinenti, A. (2006). Archeology of multimedia.
In Proceedings of the Association for Computing
Machinery Multimedia Conference 2006 (ACM-MM
2006), pages 269–278, Santa Barbara, CA, USA. As-
sociation for Computing Machinery.
Lughi, G. (2014). Dossier invisibilia: Digital media and
contemporary art. Mimesis, 3(2):43–52.
MacEachren, A. M. and Kraak, M. J. (2001). Research
challenges in geovisualization. Cartography and Ge-
ographic Information Science, 28(1):3–12.
Mahalingam, A., Kashyap, R., and Mahajan, C. (2010). An
evaluation of the applicability of 4d cad on construc-
Assessing 3D Geovisualization for the Communication of Public Art
321

tion projects. Automation in Construction, 19:148–
159.
Miles, M. (1997). Art, space and the city: public art and
urban futures. Psychology Press.
GRAPP 2016 - International Conference on Computer Graphics Theory and Applications
322
